Transcription
The Dynamic Population of ManhattanMitchell L. Moss and Carson QingRudin Center for Transportation Policy and ManagementWagner School of Public ServiceNew York UniversityMarch, 2012
IntroductionWe cannot understand Manhattan in the 21st century by relying on conventionalmeasures of urban activity. Simply put, Manhattan consists of much more than its residentialpopulation and daily workforce. This island, measuring just 22.96 square miles, servesapproximately 4 million people on a typical weekday, 2.9 million on a weekend day, and aweekday night population of 2.05 million. Manhattan, with a residential population of 1.6 millionmore than doubles its daytime population as a result of the complex network of tunnels, bridges,railroad lines, subways, commuter rail, ferry systems, bicycle lanes, and pedestrian walkwaysthat link Manhattan to the surrounding counties, cities and towns.This transportation infrastructure, largely built during the twentieth century, is operatedby the City of New York, Metropolitan Transportation Authority, and Port Authority of New York& New Jersey. The infrastructure network generates a constant flow of people who areresponsible for Manhattan’s emergence as a world capital for finance, media, fashion, and thearts.The residential population count does not include the 1.6 million commuters who enterManhattan every weekday, or the hundreds of thousands of visitors who use Manhattan’s touristattractions, hospitals, universities, and nightclubs. This report analyzes the volume of peopleflowing in and out of Manhattan during a 24-hour period; we provide an upper estimate of theactual number of people in Manhattan during a typical work day.Manhattan: A city of 4 million Manhattan’s daytime population is approximately 3.94 million; the censusdefined daytime population omits almost one-fourth of the total, or nearly800,000 people. The daytime population consists of approximately 1.61 millioncommuting workers, 1.46 million local residents, 404,000 out-of-town visitors,374,000 local day-trip visitors, 17,000 hospital patients, and 70,000 commutingstudents. 52% of Manhattan’s Census-defined daytime population consists ofindividuals who do not live in Manhattan and commute there for work.Every day, 1.63 million commuters enter Manhattan for work, while 132,000Manhattan residents commute elsewhere for work1
According to the US Census definition of “daytime population,” there areapproximately 3.1 million people in Manhattan during the work day, compared toa residential population of 1.6 million people at night. The weekend daytime population of Manhattan is approximately 2.9 millionpeople, with 565,000 commuting workers and 1.54 million local residents; theweekday night time population is at most 2.05 million, suggesting that therecould be to up to 471,000 more people in Manhattan at night consisting of latenight workers, "night-trip" visitors from the outer boroughs and suburbs, hospitalpatients, and overnight visitors, in addition to the 1.58 million local residents. The total number of people in Manhattan can vary dramatically at differenttimes of the day and week. Population estimates based on the US Censusmeasure the residential population of each neighborhood, but the populationdensity of key areas of Manhattan are substantially greater during the day withthe inflows of commuters, and certain neighborhoods attract visitors at night in farexcess of the residential population. Peak population events, or “day-trip” events, draw in people from across the cityand region could potentially push Manhattan’s daytime population well above 4million, perhaps even 5 million, depending on the conditions and circumstances. Manhattan has the greatest increase in population during the day amongall U.S. counties or administrative equivalents ( 1.49 million), and thehighest ratio between day and night population (1.92), which suggests that thereare nearly double as many people in Manhattan during the day than at nightduring a typical work day. Queens, Brooklyn, and The Bronx, in that order, have the greatest decreasein population during the day of all U.S. counties; there are approximately366,000 fewer people in Queens during the day than at night. Four out of every five Manhattan-bound commuters from the outerboroughs and suburbs travel to work by public transit each day: 50.1% bysubway, 17.1% by rail, and 13.8% by bus. Recent trends in subway ridershipindicate that the greatest increase in trips by time of day over the past decadeoccurred during late night hours, from 7 PM to 6 AM, and during weekends,highlighting that population flows into, out of, and within Manhattan are nolonger occurring only at peak commuting hours. Manhattan’s capacity to accommodate high volumes of population flow allows itto serve as the transaction-maximizing place (Meier, 1968).2
The Census-defined Daytime PopulationThe U.S. Census Bureau’s definition of “total population” is based on where people live;planners traditionally analyze demographic data from the metropolitan level to the census blocklevel based on residential population. An understanding of the actual number of people inManhattan, or any other major commuting district, during the day is critical for planners,developers and transportation agencies. Measuring the flow of people during daytime hours inManhattan and the actual day and night population of commuters, residents, visitors, andstudents is essential given the changing pattern of work and life in the 21st century. Admittedly,the U.S. Census Bureau does provide a formula used to approximate its definition of daytimepopulation for large geographic areas:(Number of workers – Workers living in the area) (Total Population – Residents working outside the area)The smallest census geographies that this formula can be applied to, based on the most recentAmerican Community Survey population and worker estimates, are counties and censusdesignated places (CDPs). The census-defined daytime population does not include other keysegments of the population, such as commuting students and overnight and day-trip visitors to agiven geographic area. It only captures the change in daytime population due to commuting forwork.Estimating the Actual Daytime PopulationManhattan’s population varies by type of day and night, and encompasses far morepeople than those who simply live or work on this island, as the following table indicates.3
By measuring the actual daytime population in Manhattan, it is clear that the Censusdefined daytime population ignores up to 25% of the actual population. The table belowprovides a more detailed summary of each group of people included in these estimates:commuting workers, local residents, out-of-town visitors, day-trip visitors, hospital patients, andcommuting students.4
WEEKDAY DAYTIME POPULATION, tudentsTOTALUpper1.61 million1.46 million404,256374,22318,23670,0543.94 millionCensus defined daytime population 3.07 million. Based on upper estimate, that figure is an undercount of 940,000WEEKEND DAYTIME POPULATION, tudentsTOTALUpper564,6651.54 million404,256374,22318,23602.90 millionCensus defined weekend daytime population 2.14 million. Based on upper estimate, that figure is an undercount of 880,000WEEKNIGHT POPULATION, rsCommutingstudents17,7471.58 million404,25631,86317,2600TOTAL2.05 millionUpperCensus defined nighttime population number of local residents, or 1.62 million. Based on upper estimate, that figure is anundercount of 550,000Sources: US Census Bureau 2010 American Community Survey, NYC & Company, Audience Research & Analysis, US News andWorld Report, New York UniversityThe figures above represent the upper estimates of day, weekend, and night populationsin Manhattan: recent Census data indicated that on any given day of the week, no more than83% of workers actually commute to work. Flexible scheduling and telecommuting have madethe journey to work less rigid, as the percent of the labor force at work and commuting to workhave both declined nationwide during weekdays since 1996, according to the Census Bureau’sSurvey of Income and Program Participation. Based on the proportion of American workers atwork and commuting to work for each day, the following table was generated to illustrate thefluctuations in daytime population by day of the week, peaking on Wednesday with a total of3.685 million.5
Manhattan’s Daytime Population by Day of the WeekGroupCommuters*ResidentsVisitorsOtherUPPER 0002,679,000*Estimate of commuting workers is based on the percent of U.S. workers who travel to work by day of week, according to 2008 Survey ofIncome and Program Participation data.Sources: US Census Bureau 2005-09 American Community Survey, 2008 Survey of Income and Program Participation, NYC & Company,Audience Research & Analysis, US News and World Report, New York UniversityDaytime Population DensityAn analysis of tract-to-tract worker flow data from the 2000 Census TransportationPlanning Package indicates that census tracts in Midtown and Financial District (typically lessthan one-tenth of a square mile) have up to 70,000 commuters and residents in skyscrapersand office buildings during the day with a population density of up to 980,000 people per squaremile (to achieve an equivalent level of density for all of Manhattan, the entire population ofTexas would have to relocate to the borough)i. If visitors staying in hotels or touring nearbyneighborhoods were included, the number of people per square mile could even exceed 1million in several of these tracts. While density has often been cited as one of the mostdistinctive features of Manhattan, the actual population density of the most activeneighborhoods during the day could still be many times greater when factoring in the 2.5 milliontotal Manhattan workers and other visitors to the city inhabiting the city’s offices and hotels.The transformation of Manhattan’s neighborhoods, such as Tribeca, Soho and WestChelsea, from manufacturing to residential uses has contributed to new levels of activity asbars, galleries, restaurants, and nightclubs have emerged in what were once industrialenclaves. The dispersion of a diverse range of activities across Manhattan has enabled it toattract up to 2.5 million non-residents each day.6
Peak Population EventsManhattan also hosts special events and celebrations that attract millions of additionalpeople from across the city, region, and beyond. While the visitor counts from the figures above(pp. 4-6) are upper estimates, they only represent average counts (see Methodology, p. 18) anddo not represent the peak number of visitors to Manhattan, which of course fluctuates greatlyover the course of a week or month. These high-volume “day-trip” events that draw in peoplefrom across the city and region could potentially push Manhattan’s daytime population wellabove 4 million, perhaps even 5 million, depending on the conditions and circumstances.A recent example of this type of event was the New York Giants ticker-tape parade inLower Manhattan in February 2012: an estimated 1 million Giants fans from across the city andregion attended the event, with an estimated one-third of them coming in from outside the cityas entire families took the day off from work and school to celebrate the Giants 2012 SuperBowl victory, according to city officials. If we were to assume that:1) One-third of Giants fans coming from outside the city do not work or attend school inManhattan,2) Another one-third of Giant fans were neither Manhattan residents nor Manhattanworkers,3) There was a normal Tuesday inflow of commuters and visitors to Manhattan and thatnone of these individuals attended the parade,then the daytime population of Manhattan on February 7, 2012 was approximately 4.35 million,much more than the 3.68 million that are usually in Manhattan on a regular Tuesday. Overall,there was an overnight inflow of 2.3 million. What’s more, the daytime population density figuresfor census tracts along the Canyon of Heroes are among the highest in the nation with 700,000to 1 million people per square mile, so Manhattan’s multimodal network of subways, buses,trains, ferries, and taxis was essential in accommodating huge numbers of people during one ofthe busiest morning commutes of the week. Events such as these serve as reminders thatalthough the daytime population figures summarized above are considered “upper estimates,”they are only upper estimates of a regular weekday, weeknight, or weekend in Manhattan, anddo not represent the absolute peak population and carrying capacity that Manhattan is capableof temporarily sustaining. The table below summarizes recent peak population events and theestimated daytime population of Manhattan using the same methodology listed above.7
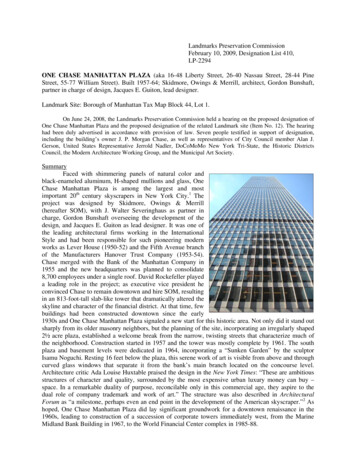
Recent Manhattan Peak Population EventsEventDateEstimatedAttendanceEstimated DaytimeManhattan Population2012 New York Giants paradeTue., February 7, 20121 million4.35 million2011 New Year’s Eve ball dropSat., December 31, 20111 million3.35 million2011 Macy’s Thanksgiving paradeThu.*, November 24, 20113.5 million5.01 million2009 New York Yankees paradeFri., November 6, 20091.5 million4.65 million*Event occurred on a holiday: treated as a Saturday instead.Manhattan as an Urban Activity DistrictManhattan’s complex and extensive transportation network makes it possible for thisisland to overcome its geographic obstacles and to bring more than 1.5 million people to workevery weekday. Population inflows in Manhattan far exceed those of other nearby counties, andas the chart below indicates, the volume of the daily inflow exceeds that of all four outerboroughs and the four additional inner-ring counties combined:8
Weekday Commuting Flowsby County/Borough, 2009-132,000ManhattanQueensBrooklynNassauBergen 1.63 million-614,000 249,000-529,000 232,000-268,000 197,000-190,000 186,000Westchester-160,000Hudson-163,000Bronx 155,000 129,000-291,000 129,000-114,000Staten Island-1000 26,000-5000500Number of CommutersPopulation Outflow10001500Population InflowSource: 2005-09 American Community Survey, US Census BureauManhattan’s net population increases by 1.49 million people during the weekday, whileNew York City’s outer boroughs lose hundreds of thousands of residents who are commutinginto the central business districts in Manhattan every morning. In contrast, the city’s inner ringsuburbs experience a more balanced inflow and outflow of commuters during the day. Thecharts below also illustrate the magnitude of these population inflows and outflows whencompared to other regions in the nation. Manhattan has a net population inflow more than threetimes greater than that of Washington, D.C., the county with second highest net inflow (Figure 1,Appendix). The three greatest net population outflows by county in the entire U.S. are all amongthe city’s outer boroughs, facilitated by an extensive mass transit network that serves millions ofpeople per day (Figure 2).92000
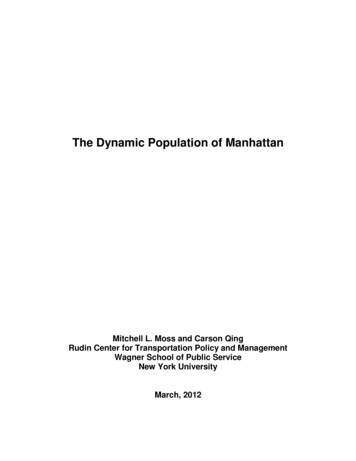
Top 10 Work Day Population Increases by County, 2009 1.49 millionManhattan (pop. 1.62 mil) 442,000Washington D.C. (pop. 588,000) 364,000Atlanta (Fulton, pop. 987,000) 327,000Dallas (pop. 2.38 mil) 261,000Houston (Harris, 3.91 mil)Minneapolis (Hennepin, 1.14 mil) 221,000Boston (Suffolk, pop. 731,000) 219,000Chicago (Cook, pop 5.26 mil) 212,000Seattle (King, pop. 1.86 mil) 164,000San Francisco (pop. 797,000) 161,00002004006008001000Thousands of People Per Day120014001600NOTE: Population figures on Y-axis represent residential population figures.Source: 2005-09 American Community Survey, US Census BureauTop 10 Work Day Population Decreases by County, 2009-366,000Queens, NY (pop. 2.28 mil)-297,000Brooklyn, NY (pop. 2.54 mil)-162,000Bronx, NY (pop. 1.38 mil)-132,000Riverside, CA (pop. 2.04 mil)-123,000Denton, TX (pop. 612,000)Prince Georges, MD (pop.835,000)-109,000Fort Bend, TX (pop. 508,000)-108,000Contra Costa, CA (pop. 1.02 mil)-96,000Suffolk, NY (pop. 1.51 mil)-93,000Will, IL (pop. 664,000)-91,000050100150200250Thousands of People Per DayNOTE: Population figures on Y-axis represent residential population figures.Source: 2005-09 American Community Survey, US Census Bureau10300350400
The ratio between day and night populations in Manhattan is also the highest in thenation at 1.92; its population nearly doubles after sunrise (Figure 3). The map below also showsthat all but four other counties in the New York metropolitan area lose population during the day.(The exceptions are Fairfield County in Connecticut and Essex, Morris, and Somerset countiesin New Jersey.)The characteristics of Manhattan’s population also change dramatically during the day,as more than half of the daytime population consists of commuters. This is not unusual, as othercities such as Washington, D.C. and Arlington, Virginia (home of the Pentagon, the largest officebuilding in the world) have a similar share of commuting workers among the population duringthe day (Figure 4). However, the map below shows that Manhattan is the only part of the New11
York City region that has such characteristics, as inflowing commuting workers consist of lessthan a quarter of the Census-defined daytime population in most other counties.Source: 2005-09 American Community Survey, US Census BureauHow Commuters Arrive in ManhattanManhattan is able to accommodate an inflow of 1.6 million commuters per day from theouter boroughs and suburbs because of the extensive transportation and mass transit networkthat includes bridges, tunnels, subways, trains, buses, and ferries. According to New YorkMetropolitan Transportation Council (NYMTC) estimates, Manhattan-bound subways carried389,000 passengers during the peak hour of the morning commute (8:00 AM) on an average fallwork day into the Manhattan central business district; roughly 6,480 commuters entered theManhattan CBD per minute by subway during the peak commuting hourii. The chart below12
shows Census journey to work data on how the 1.6 million commuting workers who do not livein Manhattan travel into the borough: 82% of Manhattan-bound commuters take public transit towork, and 50% of inflowing commuters use the subway as their primary means of travel fromthe city’s outer boroughs, or from Newark, Jersey City, and Hoboken via PATH. In comparison,commuting trips among Manhattan residents is more multimodal in nature, since the lengths ofcommutes are more manageable, and residents also have better access to the city’s extensivetaxi and limousine network. (About 58% of Manhattan residents travel to work regularly by masstransit, as they are more likely to walk or bike to work given their shorter commute lengths.)These figures demonstrate the vital role of commuter systems and mass transit – moving hugenumbers of people from the outer boroughs and counties into Manhattan each morning and outof Manhattan each evening.How 1.6 Million Commuting WorkersTravel into Manhattan Every e: 2005-09 American Community Survey, US Census Bureau*NOTE: Assumes that all Manhattan residents travel to jobs in Manhattan13
Although rush hour subway trips still account for slightly less than half of its total weekdayridership volume, recent data from the MTA indicates that ridership during off-peak hours,particularly during late nights, is growing faster rush during hour. On weekends, the greatestincrease in ridership was between 7 PM and 6 AM, suggesting that the mass transit system isserving far more than the traditional weekday journey to work.Increase in Subway Ridershipby Time of Day, 2001-10Percent Increase in Subway Source: Metropolitan Transportation Authority (2011)One of every six commuting workers drives to work in Manhattan; the bridge and tunnelconnections are of vital importance in serving the inflow of 1.6 million people per day; eachcrossing serves up to hundreds of thousands of vehicles daily. The George Washington Bridgeand the Lincoln Tunnel are among the busiest bridges and tunnels in the world; the chart belowcompares the average daily traffic flow of major New York City bridges and tunnels to those inother North American cities.14
Daily Traffic on Major Bridges & Tunnels, 2009George Washington Br (New York)San Francisco Bay BrLeonard Zakim Bridge (Boston)American Legion Bridge (DC Beltway)Verrazano Bridge (New York)Queensboro Bridge (New York)14th St Br (Washington DC)RFK Triboro Bridge (New York)Champlain Bridge (Montreal)I-35W Bridge (Minneapolis)Tappan Zee Bridge (Tarrytown, NY)Brooklyn Bridge (New York)Walt Whitman Bridge (Phila.)Lincoln Tunnel (New York)Golden Gate Bridge (San Francisco)Benjamin Franklin Bridge (Phila.)I-70/Poplar St. Bridge (St. Louis)Jacques Cartier Bridge ge Daily Number of VehiclesSources: New York State and City Departments of Transportation and Bridge AuthoritiesDuring the past decade, the daily flows of vehicular traffic have declined for most of themajor bridge and tunnel crossings into Manhattan, according to the New York City Departmentof Transportation. In fact, while Census data has indicated the number of Manhattan-boundcommuters from Northern New Jersey grew by 21% since 2002, average daily vehicular trafficflow for the Hudson River crossings actually declined over a period longer than five years for thefirst time since records were kept, starting in 1949. In contrast to the 5% decline in vehiculartraffic, NJ Transit ridership has increased by about 24% during this same period, according toAmerican Public Transportation Association ridership statistics. Additionally, PATH ridershipreached an all-time high of 76.6 million commuter trips in 2011, according to Port Authorityestimatesiii.15300,000
Purple line represents the best-fit line based on average daily traffic volumes in both directions for the three Port Authorityoperated Hudson River crossings by year.Source: New York City Department of Transportation 2009 Screenline Report (2010)Manhattan as a Transaction-Maximizing PlaceA city is a means of maximizing social transactions, and population density “stimulatestransactions between individual actors,” (Meier, 1968). The capacity of a city to generate a highvolume of transactions during short periods of time is an indicator of its power, influence, andeconomic vitalityiv. Amin and Thrift (2002) also identified the dense network of “light institutions”as important components of sustaining the volume of transactional activities in central citiesv.These light institutions include service providers, whether it be financial, professional,administrative, transportation, information, etc., that are easily accessible for firms and clients.Technology start-ups in Manhattan’s Flatiron District, for example, are within walking distance or16
a short subway trip from the financial institutions and advertising and marketing firms that areconcentrated in Midtown.Another institution that serves to organize and incubate transactional activities in centralcities is, according to Amin and Thrift (2002), the meeting place. This includes restaurants,hotels, convention centers, cultural institutions, and entertainment venues, and, like serviceproviders, the spatial distribution of these amenities across Manhattan is also characterized bydensity and accessibility. These are hubs where millions of commuting workers, local residents,and visitors interact with each other, during the day and at night, providing the city with anenergy generated from the exchange of ideas and knowledge through social interactions.Manhattan’s status as transaction-maximizing place is made possible by its remarkable carryingcapacity, its ability to sustain a daily inflow of millions of people who come to the city for avariety of different purposes. These underpinning theories provide the basis for this study of thevolume and characteristics of the dynamic population of Manhattan.Manhattan as a City of Diverse FlowsManhattan’s daytime population is incredibly diverse, with 40% as commuting workers,38% as local residents, and 20% as visitors, illustrating the mixture of primary uses that the cityprovides. However, the weeknight population consists of not only the residential population of1.58 million, but also an additional 550,000 people, who are primarily visitors to the city stayingin hotels or enjoying the city’s nightlife amenities. The nighttime population is also becomingincreasingly mobile during late-night hours, as subway ridership data from the MTA hasrevealed that late-night, off-peak travel has increased faster than that of any other time of dayover the past decade. In addition, weekend subway ridership has just reached its highest levelsince 1947vi.The Challenge for Future Measures of ActivityA handful of cities such as London, Tokyo, and Osaka have released detailed daytimepopulation data, but they are the exceptions to the norm: few cities take have released suchestimates to the public. As cities become centers of higher education and health care as well asoffice and business hubs, we must develop new ways to measure the activities that occur with17
them. Clearly, the cities of the 21st century will not resemble those of the 19th and 20th century,and it is essential to recognize the need for new methods to understand the vital functions andnumber of people who rely on cities, even if they neither live nor work there.MethodologyThe method of developing these daytime population estimates required the followingassumptions, definitions, considerations, and conditions:Commuters and Local Residents:1. Calculations of the upper estimate of daytime population assumed that all workerscommute to work during a typical work day.2. Local residents do not leave Manhattan during the day except those who commute tojobs elsewhere.3. The Bureau of Labor Statistics’ American Time Use Survey data revealed that 35% ofAmericans work at least one day on the weekend; this percentage was used to estimatethe number of commuting workers during a typical weekend day.4. 2005-09 American Community Survey estimates from the U.S. Census Bureau revealedthat 1.1% of Manhattan workers arrived at work between 12:00 am and 5:00 am. Thesewere classified as “night-shift” workers, and were used to estimate the number ofcommuting workers in the night population.5. The number of commuters and local residents per day of the week was developedbased on the percent of Americans who responded that they commuted to work by agiven of the day of the week (2008 Survey of Income and Program Participation).Visitors:The total number of visitors was the most challenging to estimate due to limited data andinformation on their characteristics. Currently, NYC & Company estimates that in 2010, therewere 40.8 million tourists to Manhattan. However, this excludes day-trip visitors living within a50-mile radius of Manhattan who do not stay overnight. Currently, there is no reliable or precisemeasure of the number of day-trip visitors per year to New York City.1. Upper estimates were based on the number of NYC & Company-defined visitors duringpeak season, and the number of day-trip visitors.18
2. According to NYC & Company definitions, all “tourists” are overnight visitors or day-tripvisitors who do not live within a 50-mile radius of Manhattan. NYC & Company alsoestimates that international visitors stay 7.3 days, on average, in New York City, and thatdomestic visitors stay 2.7 days on average, amounting to 148 million total person-days in2010 among Manhattan visitors. That number was divided by 365 to determine the totalnumber of NYC & Company-defined visitors per day in Manhattan, classified as “out-oftown visitors.”3. The number of day-trip visitors was estimated to be 374,223, based on an AudienceResearch & Analysis study of New York City’s 9 billion nightlife industry. Their studyrevealed that 77% of non-Manhattan resident nightlife attendees in 2004 were daytrippers from the outer boroughs and suburbs, and 23% were NYC & Company touristsfrom beyond the metropolitan region. Using this metric, the number of day-trip visitorswas assumed to be, at most, 3.1 times greater than the number of NYC & Companydefined visitors.4. The proportion of day-trip visitors and out-of-towners among all Manhattan visitors islikely to fluctuate during the year. Also, different attractions draw different types ofaudiences. The Broadway League estimates that only 30% of its theatre attendees wereday-trippers, while 70% were NYC & Company tourists. However, since this study aimsto provide an upper estimate of Manhattan’s daytime population, it will assume that up to77% of leisure visitors to Manhattan are day-trippers from within a 50-mile radius ofManhattan.5. The number of night-trip visitors was based on an estimate of the percent of nonManhattan resident nightlife attendees who live in the outer boroughs and suburbs. Forcalculations of the upper estimate, the study assumed that night-trip visitors do not stayovernight, and thus are not counted as a NYC & Company-defined visitor.6. The number of visitors in Manhattan was assumed to be evenly distributed by day of theweek, due to data limitations.College Students, Hospital Patients, etc.:This study also developed an up
2 According to the US Census definition of "daytime population," there are approximately 3.1 million people in Manhattan during the work day, compared to a residential population of 1.6 million people at night. The weekend daytime population of Manhattan is approximately 2.9 million weekday night time population is at most 2.05 million, suggesting that there