Transcription
Grace et al. BMC Bioinformatics(2019) TWAREOpen AccessManhattan : displaying genome-wideassociation summary statistics withmultiple annotation layersChristopher Grace1,2, Martin Farrall1,2, Hugh Watkins1,2 and Anuj Goel1,2*AbstractBackground: Over the last 10 years, there have been over 3300 genome-wide association studies (GWAS). Almostevery GWAS study provides a Manhattan plot either as a main figure or in the supplement. Several softwarepackages can generate a Manhattan plot, but they are all limited in the extent to which they can annotate genenames, allele frequencies, and variants having high impact on gene function or provide any other addedinformation or flexibility. Furthermore, in a conventional Manhattan plot, there is no way of distinguishing a locusidentified due to a single variant with very significant p-value from a locus with multiple variants which appear tobe in a haplotype block having very similar p-values.Results: Here we present a software tool written in R, which generates a transposed Manhattan plot along withadditional features like variant consequence and minor allele frequency to annotate the plot and addresses theselimitations. The software also gives flexibility on how and where the user wants to display the annotations. Thesoftware can be downloaded from CRAN repository and also from the GitHub project page.Conclusions: We present a major step up to the existing conventional Manhattan plot generation tools. We hopethis form of display along with the added annotations will bring more insight to the reader from this newManhattan plot.Keywords: Manhattan plot, GWAS, Meta-analysis, R, Software, CRANBackgroundA Manhattan plot, which plots the association statisticalsignificance as –log10(p-value) in the y-axis againstchromosomes in the x-axis, is a good way of displayingmillions of genetic variants in one figure. One can easilyspot regions of the genome that cross a particularsignificance threshold. Furthermore, it makes it easy toidentify regions that can be taken forward for replication.Several software packages (QQMAN [1], GWAMA [2],IGV [3], https://genome.sph.umich.edu/wiki/Code Sample: Generating Manhattan Plots in R, SNPEVG [4])come bundled with a plotting feature or a small R scriptwhich can generate a Manhattan plot. These scriptsgenerate the plot but because of the lack of any further* Correspondence: anuj.goel@well.ox.ac.uk1Division of Cardiovascular Medicine, Radcliffe Department of Medicine, JohnRadcliffe Hospital, University of Oxford, Oxford OX3 9DU, UK2Wellcome Centre for Human Genetics, University of Oxford, Oxford OX37BN, UKinformation in the plot (annotating the plot with genenames, identifying how significant are low frequency variants and high impact consequence variants in the GWAS),the Manhattan plot is losing its importance in more recentGWAS publications. However, with availability of largecohorts (eg. UK Biobank) and power to detect more locicrossing genome wide significant threshold (over 500 inthe recent Blood Pressure GWAS [5]), it is a tedious,time-consuming process to annotate gene names manually on a Manhattan plot. Another drawback with theconventional plot is the inability to identify the number ofvariants hiding behind “a” visible dot. In order toovercome the limitation to annotate ever-increasing locidiscovered, researchers have started transposing [6–11]the Manhattan plot to give more room to display the genenames on the plot. Manhattan software tool reads thegenome-wide summary statistic on millions of variantsand generates the transposed Manhattan plot with userdefined annotations like gene-names, allele frequencies, The Author(s). 2019 Open Access This article is distributed under the terms of the Creative Commons Attribution 4.0International License (http://creativecommons.org/licenses/by/4.0/), which permits unrestricted use, distribution, andreproduction in any medium, provided you give appropriate credit to the original author(s) and the source, provide a link tothe Creative Commons license, and indicate if changes were made. The Creative Commons Public Domain Dedication o/1.0/) applies to the data made available in this article, unless otherwise stated.
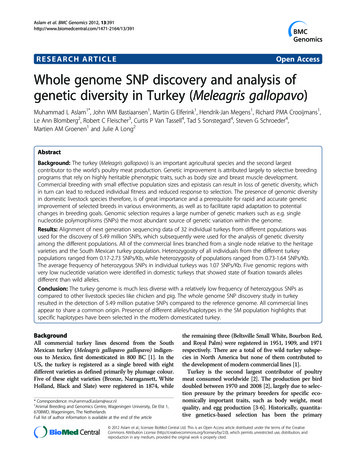
Grace et al. BMC Bioinformatics(2019) 20:610Page 2 of 5Table 1 Relevant columns in the configuration file for the softwareidxMin iptionCells with one variant are black.21FALSETRUElight pinkTRUECells with one variant with highconseq are light pink.31TRUEFALSEgreenFALSECells with one variant with MAFless than threshold are green.41TRUETRUEdark magentaTRUECells with one variant with MAFless than threshold and highconseq are dark magenta.52FALSEFALSEblueFALSECells with 2 or more variants are blue.62FALSETRUEpinkTRUECells with 2 or more variants withhigh conseq in at least one are pink.72TRUEFALSEredFALSECells with 2 or more variants with aMAF less than threshold in at leastone are red.82TRUETRUEcyanTRUECells with 2 or more variants with atleast one variant with MAF less thanthreshold and at least one variant withthe conseq flag are cyan.Each display cell shows two annotation features (MAF & consequence (conseq)). Report column instructs the code whether a bubble is drawn on the plot (Fig.2d). These are features of interest like low MAF or high consequence or both. Reporting of bubbles take place on cells which are above the FDR threshold (Fig.2a). Rest of the cells are alternating dark and light grey blocks represent the odd and even chromosomes respectively. Min.count contains the minimum numberof variants in each cell. First 4 rows show configuration for cells with one variant. The next 4 rows are for cells that contain 2 or more variantsvariant consequence and summary statistics of loci ofinterest.ImplementationThe software is written in R (version 3.4.0) and requiresggplot2, ggrepel, reshape2 and gridExtra packages (alongwith their dependencies). The software needs three files asinput. The first file contains the genome-wide summarystatistics. This file should contain the variant name,chromosome, position, p-values, minor allele frequency(MAF) and consequence. The code can cope with differentcolumn header names and accept compressed summarystatistics file. The second file contains the information onthe loci of interest that are to be annotated on the plot. Thisfile contains lead sentinel variant name, chromosome,position, effect allele frequency, odds ratio, p-value, novel/known and gene-name for the loci of interest. The third fileis a configuration file that instructs the software on the colours, bin sizes and annotation features required for display(Table 1). The display consists of two panels where the leftpanel is used for transposed Manhattan plot and the rightpanel to display information on the loci of interest. Thescript splits the genome (Fig. 1) into user-defined chunks(default 3 million base pairs (Mbp)) and association pvalues chunks (default –log10 p-value of 0.125) and createsan empty matrix. The script reads the summary statisticsand increments the counter for the respective bin wherethe variant lies in the matrix. Variants which have a pvalue 1e-20 (default) are assigned p-value 1e-20 and thebin count is incremented accordingly and limitedFig. 1 Displaying the dimensions of the matrix. The genome is split into chunks of 3 Mbp and the association statistics in chunks of 0.125 –log10(p). The number of variants in each cell of the matrix is counted and stored in memory. The colour of the cell is assigned according to theconfig file settings
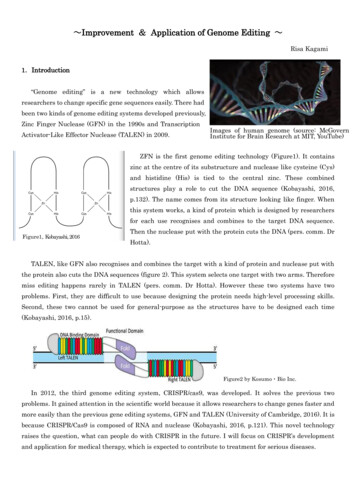
Grace et al. BMC BioinformaticsFig. 2 (See legend on next page.)(2019) 20:610Page 3 of 5
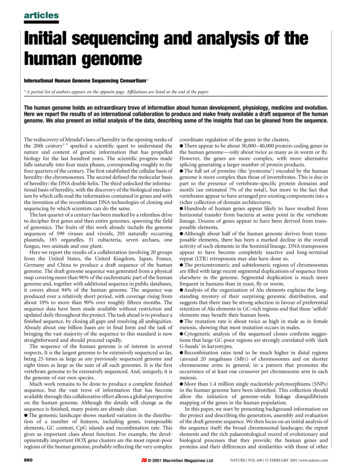
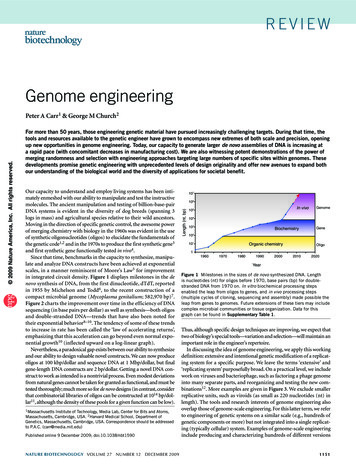
Grace et al. BMC Bioinformatics(2019) 20:610Page 4 of 5(See figure on previous page.)Fig. 2 Screenshots of the output from Manhattan software. a) Transposed Manhattan plot on the left and lead variant annotation on the right.Alternating dark and light grey blocks represent the odd and even chromosomes respectively along the y-axis for those variants have associationp-value greater than user-defined significance (5% False Discovery Rate). Blocks that contain variants with high impact and/or low MAF arehighlighted using a bubble (eg 8). b) Zoomed in screenshot showing peak loci names in bubbles. c) The key showing the index (1–8), variantcount (1, 2–200) in each block, annotation (MAF, impact, both), counter showing number of blocks in the plot for this index (eg. there are 2blocks having index 8 on chromosomes 6 & 8). d) Zoomed in screenshot of a signal where there is a blue block (index 8) that could contain 2–200 variants with at least one variant having low MAF and high impact or two variants, one having low MAF and the other having highimpact annotationinformation is lost. The bin count matrix is then used byggplot2 to display the heatmap using the colours as definedin the configuration file. All the parameters can be edited inthe configuration file and when calling the function in R according to user preference.ResultsThe software is customizable and can generate a Manhattan of about 20 million variants on a 32 bit desktop personal computer using under 3.4 GB RAM and similar inLinux (Centos 7). The software has been tested to displayannotation of 130 loci in a tabular format (Fig. 2a) withodds ratio, effect allele frequency, p-value & gene-name. Ifthe number of loci to display goes beyond 130, then werecommend using just the gene (or variant) names andthe software will display the names in a force directedmanner (Fig. 2b). The colours and the number of variantsin each bin are customizable (Table 1, Figs. 2c, 3). Thisgives the reader an insight into the locus whether it isdriven by a single variant (Fig. 2a, NOS3 locus), variantswith low MAF ( 5%) or variants having a “high” impactfunctional annotation. (Example: Chromosome 6 has ablue block displayed as “8” which denotes that there aremultiple (2–200) variants with at least one variant havinglow MAF and high impact or two variants one having lowMAF and the other having high impact annotation asshown in Fig. 2d). The user have the option to save theoutput as a PDF or a high-resolution TIFF file.ConclusionsHere we present the Manhattan software which is amajor step up from existing tools and addresses thehighlighted limitations. Furthermore, the code iscustomizable and being open source increases the potential for future feature enhancements by the community.We recognize that there are existing scripts that generate a Manhattan plot but none can perform the tasks wehave implemented in this software. However, only ahandful of them annotate the plot with minimal level ofdetail (Additional file 1: Supplementary Note, Table S1).Most existing scripts generate a graph in a landscapeorientation, which is not enough with ever-increasingFig. 3 The key. Using the default settings, the Manhattan plot generates a key for the plot. For keys #5–8, there are 2–400 variants per cell inthe matrix (using different configuration file from Fig. 2). The software calculates the maximum count based on the overall matrix. For key #5,there are 6264 cells in the plot. Key #6 tells us that the cell contains 1 or more high impact variant(s) and there are 4 such cells in the plot. Key#7 gives us information on those cells where there are one or more variant(s) with MAF 5% and there are 1226 such cells. Key #8 tells us that in2–400 variants, there is one variant with MAF 5% and is also high impact. If the cell contains 2 variants, one with MAF 5% and one that ishigh impact, then the cell will also get key #8
Grace et al. BMC Bioinformatics(2019) 20:610number of discovered GWAS loci. A limitation with ourmethod is that it takes one full A4 page of the journal todisplay but with more researchers reading publicationsonline, this figure is highly web readable and useful forposter presentations. This software adds a lot of information to the existing Manhattan plot and we hope thatthe readers will be able to derive more information bylooking at the Manhattan plot.Supplementary informationSupplementary information accompanies this paper at al file 1: Supplementary Note. Table S1.Comparison of thefunctionalities between existing Manhattan software tools and ManhattanAbbreviationsGWAS: Genome wide association study; MAF: Minor allele frequency;Mbp: Million base pairsAcknowledgementsNot applicable.Availability and requirementsProject name: manhplot.Project home page: https://github.com/cgrace1978/manhplotOperating system(s): Platform independent.Programming language: R ( 3.4.0).Other requirements: R dependencies (ggplot2, reshape2, ggrepel, gridExtra).Any restrictions to use by non-academics: None.License: GPL ( 2).Author’s contributionsCG wrote the software in R. AG wrote the Perl Utility. MF & HW providedvaluable input for feature enhancements. AG, MF & HW wrote themanuscript. All authors read and approved the final manuscript.FundingThis work was supported by BHF, European Commission (LSHM-CT- 2007037273, HEALTH-F2–2013-601456), the Wellcome Trust (201543/B/16/Z),Wellcome Trust core award (090532/Z/09/Z, 203141/Z/16/Z), BHF Centre ofResearch Excellence and TriPartite Immunometabolism Consortium [TrIC]NovoNordisk Foundation (NNF15CC0018486). Computation used the OxfordBiomedical Research Computing (BMRC) facility, a joint development betweenthe Wellcome Centre for Human Genetics and the Big Data Institute supportedby Health Data Research UK and the NIHR Oxford Biomedical Research Centre.Financial support was provided by the Wellcome Trust Core Award GrantNumber 203141/Z/16/Z. The views expressed are those of the author(s) andnot necessarily those of the NHS, the NIHR or the Department of Health.Funding bodies played no role in the design of the study and collection,analysis, and interpretation of data and in writing the manuscript.Availability of data and materialsPackage (manhplot) available via CRAN repository. The software and datasetsused during the current study are also available in the GitHub Ethics approval and consent to participateNot applicable.Consent for publicationNot applicable.Competing interestsNone.Page 5 of 5Received: 11 June 2019 Accepted: 8 November 2019References1. Turner SD. Qqman: an R package for visualizing GWAS results using Q-Qand Manhattan plots. J Open Source Softw. 2018;3(25):731–2.2. Magi R, Morris AP. GWAMA: software for genome-wide association metaanalysis. BMC bioinformatics. 2010;11:288.3. Thorvaldsdottir H, Robinson JT, Mesirov JP. Integrative genomics viewer(IGV): high-performance genomics data visualization and exploration. BriefBioinform. 2013;14(2):178–92.4. Wang S, Dvorkin D, Da Y. SNPEVG: a graphical tool for GWAS graphing withmouse clicks. BMC bioinformatics. 2012;13:319.5. Evangelou E, Warren HR, Mosen-Ansorena D, Mifsud B, Pazoki R, Gao H,et al. Genetic analysis of over one million people identifies 535 novel locifor blood pressure. bioRxiv. 2017.6. International Multiple Sclerosis Genetics Consortium, Wellcome Trust CaseControl Consortium, Sawcer S, Hellenthal G, Pirinen M, Spencer CC, et al.Genetic risk and a primary role for cell-mediated immune mechanisms inmultiple sclerosis. Nature. 2011;476(7359):214–9.7. Martin JE, Broen JC, Carmona FD, Teruel M, Simeon CP, Vonk MC, et al.Identification of CSK as a systemic sclerosis genetic risk factor throughgenome wide association study follow-up. Hum Mol Genet. 2012;21(12):2825–35.8. Andlauer TF, Buck D, Antony G, Bayas A, Bechmann L, Berthele A, et al.Novel multiple sclerosis susceptibility loci implicated in epigeneticregulation. Sci Adv. 2016;2(6):e1501678.9. van der Harst P, van Setten J, Verweij N, Vogler G, Franke L, Maurano MT,et al. 52 genetic loci influencing myocardial mass. J Am Coll Cardiol. 2016;68(13):1435–48.10. Nelson CP, Goel A, Butterworth AS, Kanoni S, Webb TR, Marouli E, et al.Association analyses based on false discovery rate implicate new loci forcoronary artery disease. Nat Genet. 2017;49(9):1385–91.11. Cortes A, Dendrou CA, Fugger L, McVean G. Systematic classification ofshared components of genetic risk for common human diseases.BioRxiv. 2018.Publisher’s NoteSpringer Nature remains neutral with regard to jurisdictional claims inpublished maps and institutional affiliations.
Most existing scripts generate a graph in a landscape orientation, which is not enough with ever-increasing (See figure on previous page.) Fig. 2 Screenshots of the output from Manhattan software. a) Transposed Manhattan plot on the left and lead variant annotation on the right.