Transcription
Benchmark Hadoop and Mars:MapReduce on cluster versus on GPUHeshan Li, Shaopeng WangThe Johns Hopkins University3400 N. Charles StreetBaltimore, Maryland 21218{heshanli, shaopeng}@cs.jhu.edu1OverviewMapReduce[5] is an emerging programming model that utilizes distributedprocessing elements (PE) on large datasets. With this model, programmers can write highly parallelized code without explicitly dealing with taskscheduling and code parallelism in distributed systems.In this paper, we comparatively evaluate the performance of MapReducemodel on Hadoop[2] and on Mars[3]. Hadoop is a software framework forMapReduce on large clusters, whereas Mars builds the framework on graphics processors using CUDA[4]. We design and implement two practical programs, Document Similarity Score and Matrix Multiplication, to benchmarkthese two frameworks. Based on the experiment results, we conclude thatMars is up to two orders of magnitude faster than Hadoop, whereas Hadoopis more flexible in dependency to dataset size and shape.The rest of the paper is organized as follows. Section 2 describes theparallel design of the two benchmarks, Document Similarity Score and Matrix Multiplication, as well as their target architecture. Section 3 presentsour evaluation implementation and result. Finally, we conclude our work insection 4.2Parallel DesignIn this section, we discuss the parallel design and implementation mechanisms for the benchmark problems, and the target architectures to whichthey apply.1
2.1Problem DefinitionThe benchmark problems we implemented are described as below.2.1.1Similarity ScoreComputing Document Similarity Score is a common task in web search andweb document clustering. This problem takes a set of documents as input. Each document is preprocessed and represented as a feature vector doc.Given two document feature vectors d 1 and d 2 , the similarity score (SS) ofthese two documents is defined asSS d 1 · d 2d 1 · d 2(1)The SS of each pair of document features in the input set will be calculatedusing equation (1). The output is produced as a sorted list of SS over allpairs.2.1.2Matrix MultiplicationMatrix multiplication is widely applicable to a lot of research areas such ascomputer vision, image processing and artificial intelligence. In this finalproject, what we are focusing on is to analyze the relationship betweendocuments, which is part of the information retrieval area. As we mentionedin section 2.1.1, the feature of the document could be described as a Ndimensional vector. The matrix could be regarded as the set of vectors,which means the features of a group of documents could be described as amatrix.So the matrix computing will be very useful when it is needed to analyzethe relationship between one group of vectors to the others. For example,suppose we have two web documents A and B with n queries in documentsA and m queries in B. So these two documents could be described as follows: a11 a22 · · · an1b11 b21 · · · bm2 . , B . ,.A . . . a1m a2m · · ·bn1 bn2 · · ·anmbnmwhere column i in A is the ith query of A, and row i in B is the ith queryof B. The similarity of documents A and B should include the similarity of2
each query between A and B. Refer to equation 1SS a · b, a · bwhere a and b are the vectors that we want to compare. So for A and B, weneed to compare each query of them, which could be achieved as: b11 b21 · · · bm2a11 a22 · · · an1 . . · .A · B . . .a1m a2m · · · bn1 bn2 · · ·anm······.a1 bna2 bn.am b1 am b2 · · ·am bna1 b1a2 b1.a1 b2a2 b2.bnm , (A · B)ij means the vector product between the ith query and the jth query.This approach will be better than using for loop to calculate n times.2.2Identifying ConcurrencyThe data of both Similarity Score and Matrix Multiplication can be decomposed into units on which can be processed relatively independently.In the Similarity Score problem, the documents are preprocessed andrepresented as vectors. Each pair of them can be viewed as a data unit.Thus we can split the whole set of vector pairs into appropriate number ofsubsets and compute the similarity score within each subset in parallel.For Matrix Multiplication, we split the two matrices into blocks. If theblocks are small enough (could be put into the cache of CPUs), each pair ofmatrices could be calculated on a single node in the cluster very fast. Whenthe web document is too large (for example, a web document which containsmillions queries and the feature of each queries is a 128-dimensional vector),decomposing the matrix will be necessary since the memory of the singlenode could not hold such large data. Each node in the cluster will computethe matrix block pair in parallel, after that the results will be combined asa whole large matrix.2.3Algorithmic StructureThe algorithmic structure we used here is Geometric Decomposition pattern.3
2.3.1Similarity ScoreThe input dataset, which is physically represented as a big text file, is slicinghorizontally into chunks. Each chunk corresponds to a subset of vector pairsthat we split in Identifying Concurrency section.2.3.2Matrix MultiplicationAs we discussed in the last section, the matrices could be decomposed intoblocks. So for each time, each sub-matrix pairs will be multiplied by thesingle node and the result will be added to the running matrix sum. The Geometric Decomposition pattern is based on decomposing the data structureinto chunks (square blocks here) that can be operated on concurrently[7].2.4Supporting StructuresWe are programming on MapReduce model, which makes the source codestructure as Master/Worker by nature. In addition, Matrix Multiplicationuses Distributed Array data structure. As we mentioned before, we partitioned the matrix between multiple UEs among the clusters, the thing ishow could we do this making the resulting program both readable and efficient. We use distributed array in this task. The advantage of distributedarray is as follows[7]: Load balance. Because a parallel computation is not finished until allUEs complete their work, the computational load among the UEs mustbe distributed so each UE takes nearly the same time to compute. Effective memory management. Modern microprocessors are muchfaster than the computer’s memory. Clarity of abstraction. Programs involving distributed arrays are easier to write, debug, and maintain if it is clear how the arrays aredivided among UEs and mapped to local arrays.Remember that our approach is to partition the matrix into blocks andthen assign those blocks onto the nodes of the cluster. Suppose we want to4
partition matrix A, a11 . . aj1 aj 11 . .an1 the distribution of matrix A could be as follows: )···a1ka1k 1 · · ·a1m . j. ···ajkajK 1 · · ·ajm · · · aj 1k aj 1k 1 · · · aj 1m ) . n j.···ankank 1 · · ·anm{z} {z}km kFrom the above distributed matrix, we could see that matrix A are partitioned into four blocks, the dimensions of the four sub-matirx is (k, j),(m k, j), (k, n j), (m k, n j). For the matrix multiplication, supposewe have matrix A and matrix B which are partitioned as A11 A21B11 B12A ;B A21 A22B21 B22The matrix multiplication will be equal to the combination of the sub-matrixmultiplication that is as follows: A11 · B11 A12 · B21 A11 · B12 A12 · B22A·B A21 · B11 A22 · B21 A21 · B12 A22 · B222.5Implementation MechanismsIn MapReduce programming model, our algorithms are implemented usingtwo functions, Map and Reduce. The Map function takes an input key/valuepair and outputs a set of intermediate key/value pairs. All intermediatevalues are partitioned into groups according to the keys. The Reduce function accepts the intermediate key/value pairs and produces a sorted list ofkey/value pairs:M ap : (k1 , v1 ) list(k2 , v2 )Reduce : (k2 , list(v2 )) list(k3 , v3 )2.5.1Similarity ScoreThe scheme of Similarity Score MapReduce program is define as follows:Map function:InputSchema : K {}, V {docIdi , veci , docIdj , vecj }5
Outputschema : K {SimilarityScore}, V {docIdi , docIdj }In this program, no reduce stage is required. The number of reducer isset to 1 because we need a sorted list of the overall results.2.5.2Matrix MultiplicationThe input to Matrix Multiplication program consists of a set of pairs in theform of M atrixIndex and M atrixV alue of the matrix, where M atrixIndexmeans the index of the input matrix, and the M atrixV alues means thecorresponding value to that M atrixIndex. In our problem ,if we want tocalculate the multiplication of matrix A and B, the M atrixIndex wouldbe the element index from A or B, and the M atrixV alues would be theelement value corresponding to that index. For example, suppose ai,j is oneof the elements in matrix A, so the MatrixIndex would be (i, j) and theMatrixValues would be ai,j .For the Map function, the schema is defined as:InputSchema : K {}, V {M atrixIndex, M atrixV alue}Outputschema : K {M apperOutputKey}, V {M apperOutputV alue}The key/value pair M apperOutputKey and M apperOutputV alue are twokinds of data type that we extends from W ritabelComparable and W ritableclass in Hadoop library. The format of M apperOutputKey is as follows:M apperOutputKey (BlockRowIndex, BlockColumnIndex, IsF romA)whereM atrixRowIndex,BlockRowSizeM atrixColumnIndexBlockColumnInde ,BlockColumnSizeIsF romA T rue{if f romA}orF alse{otherwise}BlockRowIndex The format of M apperOutputV alue is:M apperOutputV alue (BlockRowN um, BlockColumnN um, value)where the BlockRowN um and BlockColumnN um indicate the position ofthe block in the matrix, and the value means the value of the element. Sothe mappers partition the matrices into blocks and emit the element’s block6
index as the key and the block position in the matrix and the element’svalue as the value to the reducer.For the Reduce function, the schema is as follows:Inputschema : K {M apperOutputKey}, V {M apperOutputV alue}Outputschema : K {M atrixIndex}, V {M atrixV alue}The reducer multiplies the A and B block pairs and sums up the results.2.6Target ArchitectureFor Hadoop, we choose Amazon Elastic MapReduce cloud computing service. It utilizes a hosted Hadoop framework running on the web-scale infrastructure of Amazon Elastic Compute Cloud (Amazon EC2) and Amazon Simple Storage Service (Amazon S3)[1]. It has been widely used inbusinesses and researches, which is feasible to demonstrate the Hadoopframework. As in the cloud, the computing units are virtual machine (VM)based. Each VM serves as a PE in the cluster. Each PE runs one or moremap/reduce tasks.Mars is implemented using NVIDIA CUDA, thus we demonstrate Marson a piece of graphic card that supports CUDA computing architecture. Thedata domain, including the input data, the intermediate result and the finalresult are stored in GPU and are mapped into a grid on CUDA executionmodel. The grid is decomposed into thread blocks. Each map/reduce taskruns the kernel with its own data in a thread block.3EvaluationIn this section, we present the performance for Hadoop and Mars on thebenchmarks we describe above.3.1Experimental SetupHadoop experiment was performed on two High-CPU Medium Instance,with each instance having 1.7 GB of memory, 5 EC2 Compute Units (2virtual cores with 2.5 EC2 Compute Units each), 350 GB of instance storageand 32-bit platform. One EC2 Compute Unit (ECU) provides the equivalentCPU capacity of a 1.0-1.2 GHz 2007 Opteron or 2007 Xeon processor.The Mars experiment was running on a Macintosh with a GeForce 9600MGT GPU and a 2.66 GHz Intel Core 2 Duo processor running Mac OS X7
10.6.5. The GPU consists of 4 multi-processors, each of which has 8 coresrunning at 1.25 GHz, and the device memory of the GPU is 256 MB. Theversion of the installed CUDA is 3.2.3.2Experiment Data Selection and Evaluation MethodologyTo evaluate the performance, we select different size of dataset size for eachprogram: small size, medium size and large size, as shown in Table 1. Thedocument feature dimension for Similarity Score is 128.Table 1: Data Size DefinitionApplicationSmallMediaSimilarity Score256 128 512 128Matrix Multiplication 256 256 512 512Table 2: Data FileApplicationSmallSimilarity Score89 MMatrix Multiplication 5 MSizeMedia357 M10 MLarge1024 1281024 1024Lagrge1.4 G40 MWe generate random data using the program we developed. Before westarted running the Mars and Hadoop benchmarks, we found that Mars hasa limitation on the dataset size selection. When the data is too large tofit into the GPU’s memory (for example a 2048 2048 matrix multiply byitself, or a 2048 128 document set), it will run out of memory and returnerror. This is due to the current imperfection of the Mars framework. Sowe select these datasets to make sure each one could be loaded into thememory and the program can run successfully (Although the input dataof Matrix Multiplication program is relatively small, but it generates manyintermediate results while running the map function).3.3ResultsWe present the results and analyze the performance of the two benchmarksin three parts.8
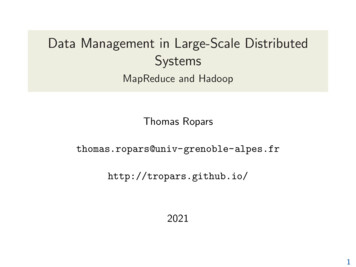
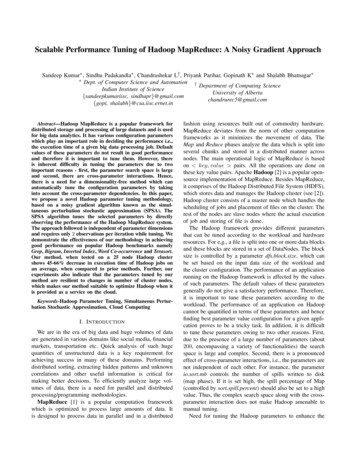
Figure 1: The performance speedup of Mars over Hadoop3.3.1Overall Performance Speedup of Mars Over HadoopFigure 1 shows the overall performance speedup of Mars over Hadoop withthe data set size varies. Overall, Mars is around 100-200x faster than Hadoopwhen the input data is in medium size. This is predictable because GPUhas a much higher I/O bandwidth and more UEs than the cluster. Howeverfor computation-intensive applications such as Matrix Multiplication, thespeedup of Mars is not as good as it was when data size is large.We can see that from figure 1, the speedup of Mars is fairly high when thedata size is small, then the speedup goes down when the data size becomelarge. In contrast to Mars’ performance, Hadoop’s performance will becomebetter when the data size changing from small to large. This is due to tworeasons. First, GPU has limited memories while memory is not an issuein cluster with our data size. In fact, when we tried to raise the data sizeto two times bigger than the large one, we found that Mars will crash forrunning out of memory, but Hadoop still works. Moreover, startup cost ismuch higher in cluster compared to GPU, especially in the experiment ofsmall dataset size.9
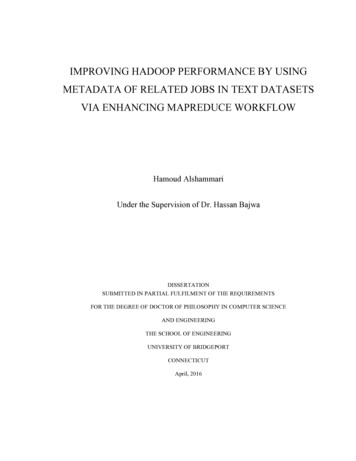
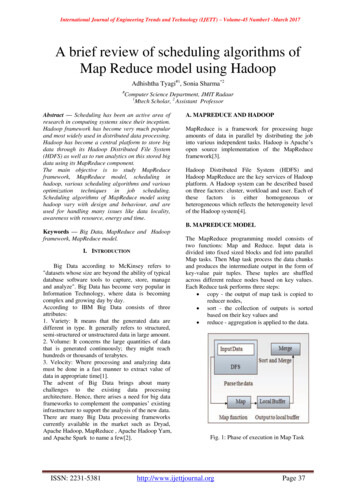
(a) Small(b) Medium(c) LargeFigure 2: The time breakdown of Mars on SS3.3.2Time Breakdown of MarsFigure 2 shows the time breakdown of Similarity Score and Matrix Multiplication on Mars. The total execution time of the programs can be dividedinto four parts: the file I/O time, the mapper execution time, the sortingtime and the reducer execution time[6]. Here the mapper execution time includes the time copying the input data to the device memory and the reducerexecution time includes the time writing the result to the main memory.From Figure 2, we can see that the sorting time is dominant in Similarity Score and mapping time is dominant in Matrix Multiplication. Thisis decided by the nature of their algorithm. Recall that the mapper of SScalculates the score by simply multiplying two vectors and then emits allthe intermediate data to one partitioner where all the data are to be sorted.GPU is very good at doing multiplication but not sorting. In contrast, themap function of MM has to split the input data into chunks, which involvestime consuming calculation such as division and mode.We can also see that the I/O time in GPU is so fast that it is negligible10
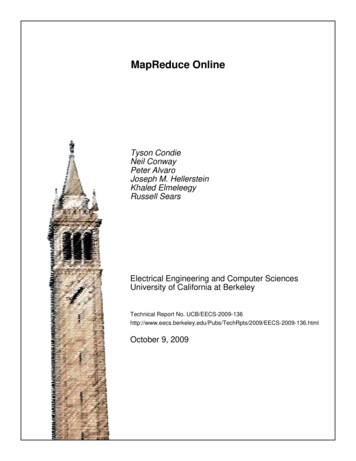
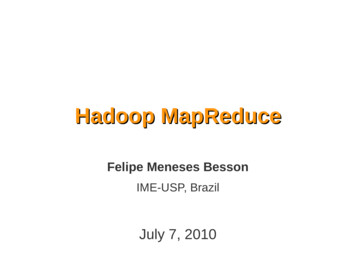
in the overall execution time. But in cluster, files are read from and writtento hard disks, of which bandwidth is two orders of magnitude slower thanGPU’s.3.3.3Hadoop Speedup of Local Machine over ClusterFigure 3:Next we present the performance speedup of Hadoop on Local Machineover Cluster. Hadoop on Local Machine means the Hadoop MapReduceprogram is running in a non-distributed mode. As we discussed in thesection 3.1, we used 10 EC2 Compute Units in total, for each is equivalentto a 1.0-1.2GHz 2007 Opteron or 2007 Xeon processor. Our local machinehas a 2.66GHz Intel Core 2 Duo processor. It is no doubt that the hardwareof Amazon Instance are superior than the local machine. The reason wedo this experiment is to compare the performance between the distributedmode and the non-distributed mode, where we found something interestinghere.In figure 3, we can see that the local machine performs about 5x fasterthan Amazon Instance when the dataset is small. With the large dataset,the speedup of the local machine shrinks to about 1.7, however, the localsingle node machine still out performs a cluster with 10 node.From the results we have, it is clear that the bottleneck of performancein distributed cluster is I/O and startup cost. In clusters, computing nodesnot only heavily rely on disk I/O but also on the network to exchange theintermediate results. Both of them are far more slower than the memoryI/O in local machine, not to mention the GPU I/Os. Only when datasetsize becomes large enough to allow the mapper stage and reducer stage11
execution time dominate the total execution time, the cluster can show itssupercomputing capability.44.1DiscussionSummaryThis paper evaluated the performance of Mars and Hadoop by providingtwo benchmarks: Similarity Score and Matrix Multiplication. And threedifferent size of dataset has been generated in the experiment. We discussedeach of the benchmark from identifying concurrency, algorithmic structure,supporting structure to implementation mechanisms. In the experiments,we compared the performance of two MapReduce program implemented indifferent frameworks: Hadoop and Mars. The benchmark result shows thatMars out performs Hadoop greatly in this overall experiment. However,Hadoop is much flexible in terms of dataset size selection. Moreover, theperformance gap between Hadoop and Mars becomes smaller when datasetsize increases. In the mean time, Mars’ performance could be improvedsignificantly when the sorting performance can be optimized. At last, wecompared Hadoop’s performance between single node machine and the distributed cluster, from which we learn that the bottleneck of cluster is itsI/O bandwidth and startup overhead.4.2Future WorkWe are interested in extending the experiments on Mars. First, in this paper, our benchmarks run on a graphic card which memory is very limited.We would like to to run the benchmarks on Nvidia Tesla or Nvidia Quadrographic cards to see the different performances when we add more multiprocessors and much more device memories. Further more, we are interestedin applying Mars framework to distributed system, where we can take advantage of the huge storage and improve the overall computing ability aswell. A more interesting probe is to develop programs that can be run on aSLI-video card system, which consists of two or four graphic cards with allof them share the memory of the host.4.3Lessons LearnedFrom our results, we are not surprised that Mars has such a good performance since it enjoys the highly parallelized architecture and huge band-12
width provided by GPUs and CUDA. What was surprising is that the performance of Hadoop on Amazon Web Service is so weak compared to thenon-distributed version that runs on a local computer. While parallelizeprogramming might bring us faster programs running on local machines aswe saw in our experiments, its real power unveils in the supercomputingcloud where program demands highly data-intensive computing.References[1] s.amazon.com/[2] Hadoop. http://hadoop.apache.org/.[3] Mars: A MapReduce Framework on Graphics Processors. http://www.cse.ust.hk/gpuqp/Mars.html.[4] NVIDIA CUDA.html.http://www.nvidia.com/object/cuda home new.[5] Jeffrey Dean and Sanjay Ghemawat. Mapreduce: simplified data processing on large clusters. Commun. ACM, 51:107–113, January 2008.[6] Bingsheng He, Wenbin Fang, Qiong Luo, Naga K. Govindaraju, andTuyong Wang. Mars: a mapreduce framework on graphics processors. InProceedings of the 17th international conference on Parallel architecturesand compilation techniques, PACT ’08, pages 260–269, New York, NY,USA, 2008. ACM.[7] Timothy Mattson, Beverly Sanders, and Berna Massingill. Patterns forparallel programming. Addison-Wesley Professional, first edition, 2004.13
Hadoop is a software framework for MapReduce on large clusters, whereas Mars builds the framework on graph-ics processors using CUDA[4]. We design and implement two practical pro- . 2.6 Target Architecture For Hadoop, we choose Amazon Elastic MapReduce cloud computing ser-vice. It utilizes a hosted Hadoop framework running on the web-scale in-