Transcription
Rasmussen College, Inc.IntroductionRasmussen Colleges, Incorporated (“Rasmussen”) has experienced significant enrollment growthyet has little to show for it, as the company has some of the worst student retention rates of any companyexamined by the committee. At the same time that 63 percent of students are leaving withoutcompleting a degree, taxpayers are investing approximately 185 million a year in the company.Company OverviewRasmussen is a privately held, for-profit college that was founded by Walter Rasmussen in 1900.Originally named the Rasmussen Practical School of Business, the first campus was located inStillwater, MN. Rasmussen is now headquartered in Minnetonka, MN.Rasmussen has 22 campuses, along with an online division, and offers degree and Certificateprograms in health sciences, business, education, justice studies, nursing, and technology and design. 2592Rasmussen internal documents estimate that approximately 55 percent of students are enrolled online.2593Thirty-four percent of Rasmussen students are enrolled in allied health programs, 30 percent in business,17 percent in justice studies, 11 percent in technology and design, 5 percent in education, and 3 percentin nursing.2594Like more than half of the regionally accredited brands the committee examined, Rasmussen isregionally accredited by the Higher Learning Commission of the North Central Association of Collegesand Schools (HLC).The current president of Rasmussen College is Kristi A. Waite, the granddaughter of founderWalter Rasmussen, who was appointed in 1997. However, while retaining a smaller ownership interest,her family no longer controls the company.2595 Rasmussen is an example of how private equityinvolvement has influenced a formerly family-owned school.In 2003, Rasmussen was acquired by a company named Collegis after Collegis sold off theirhigher education IT business.2596 A private equity firm, the Frontenac Company, made the initialinvestment to acquire Collegis from its founder and was invested in Rasmussen until 2008.2597 CurrentCEO Michael Locke previously served as senior vice president for Collegis.While Frontenac has sold off its remaining interest, it continues to have a large influence on thecompany. Robert E. King serves as the chairman of Rasmussen and is the former CEO of The NewtrendGroup and Deltak, both prior Frontenac investments, and has partnered with Frontenac in fiveinvestments over the last 35 years.2598 Robert King “entities” own more than a quarter of Rasmussen.25992592For list of campuses see http://www.rasmussen.edu/locations/ (accessed May 12, 2012).Rasmussen Internal Presentation, Rasmussen Overview (RAS000016400, at RAS000016417).2594Rasmussen Internal Presentation, 2012, Rasmussen College Vision 2012 (RAS00021447, at RAS000021454).2595Rasmussen Internal Presentation, Rasmussen Overview (RAS00016400). Note that all ownership information are basedon internal Rasmussen documents and have potentially changed since documents were produced.2596Rasmussen Internal Presentation, Rasmussen Overview (RAS00016400, at investments.aspx?cid 9&selectionId aspx?cid 9&selectionId 12593632
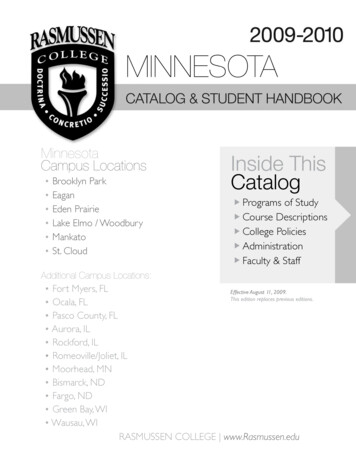
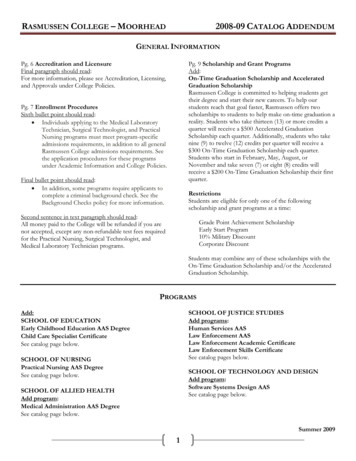
King also served as a member of the DeVry University board for 16 years. James E. Cowie ofFrontenac continues to serve on Rasmussen’s board of directors.2600Frontenac is not the only private equity influence on Rasmussen. Former board member andchairman of the private equity firm Madison Dearborn Partners, John Canning Jr., and related “entities”own a substantial portion of Rasmussen.2601Enrollment at Rasmussen Colleges, Inc., 10,0008,0006,2586,0004,2314,0002,0001,8822,134Fall 2001Fall 20022,6372,9683,288Fall 2003Fall 2004Fall 2005‐Fall 2006Fall 2007Fall 2008Fall 2009Fall 2010The company has grown significantly over the last decade with enrollment increasing more than500 percent since the company’s 2003 purchase, growing from 2,637 students to 17,090 students in2010.2602 The percentage of students attending online has also increased fairly rapidly since 2003.2599Rasmussen Internal Presentation, Rasmussen Overview (RAS000016400, at RAS00016445). (On file with ments.aspx?cid 9&selectionId 1.2601Rasmussen Internal Presentation, Rasmussen Overview (RAS000016400, at RAS00016445). (On file with committee.)26002602The most current enrollment data from the Department of Education measures enrollment in fall 2010. In 2011 and 2012,news accounts and SEC filings indicated that many for-profit education companies experienced a drop in new studentenrollment. This has also led to a drop in revenue and profit at some companies. See Appendix 7.633
The growthgin ennrollment hass led to growwth in revenuue. In just 3 years, revennue at Rasmmussen2603ggrew rapidlyy, more than tripling fromm 46.4 million in 2006 to 147.3 mmillion in 20009.An innternal comppany presenttation states thet companyy’s goal as ““to be the preemier providder ofoonline educaational experriences delivering Associate, Bacheloor’s, and Grraduate degreee programss throughits network ofo online andd local commmunity camppuses with 5500 [millionn] in revenuee in 2014.” 26604The company’scstrategy for achievingathiis goal incluudes the folloowing:2605 Groow mature caampuses 20 percent pwitth new studeent markets ((HS) and neew programs. Opeen 2-3 new campusescper year. Exppand Rasmusssen online 757 percent per year. Mannage Expensse Growth too be less thann revenue grrowth by a mminimum of 5 percent.FFederal ReevenueNearlly all for-proofit education companiess derive the mmajority of rrevenues froom Federal ffinancial2606aaid programss.Betweeen 2001 and 2010, the shhare of title IIV Federal ffinancial aid funds flowing to2603Revenue figgures for publiicly traded commpanies are fromm Securities annd Exchange CCommission annnual 10-K filinngs.RRevenue figurees for privately held companiees are taken froom the companny financial staatements produuced to the commmittee.SSee Appendix 18.12604Rasmussenn Internal Preseentation, Rasmuussen Overvieww (RAS0000166400, at RAS000016402).2605Id. at RAS0000164072606“Federal finnancial aid funnds” as used in this report meaans funds mad e available throough Title IV oof the Higher EEducationAAct, including subsidizedsandd unsubsidized Stafford loanss, Pell grants, PPLUS loans andd multiple otheer small loan annd grantpprograms. Seee 20 U.S.C. §10070 et seq.634
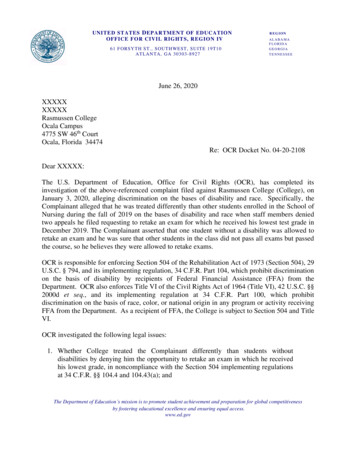
for-profit colleges increased from 12.2 to 24.8 percent and from 5.4 to 32.2 billion.2607 Together, the30 companies the committee examined derived 79 percent of revenues from title IV Federal financial aidprograms in 2010, up from 69 percent in 2006.2608In 2010, Rasmussen reported 78.8 percent of revenue from title IV Federal financial aidprograms.2609 However, this amount does not include revenue received from Departments of Defenseand Veterans Affairs education programs.2610 Department of Defense Tuition Assistance and post-9/11GI bill funds accounted for approximately 1.8 percent of Rasmussen’s revenue, or 4.1million.2611 With these funds included, 80.6 percent of Rasmussen’s total revenue was comprised ofFederal education funds.26122607Senate HELP Committee staff analysis of U.S. Department of Education, Federal Student Aid Data Center, Title IVProgram Volume Reports by School, matic.html, 2000-1 and 2009-10.Figures for 2000-1 calculated using data provided to the committee by the U.S. Department of Education.2608Senate HELP Committee staff analysis of Proprietary School 90/10 numerator and denominator figures for each OPEIDprovided to the U.S. Department of Education pursuant to section 487(d)(4) of the Higher Education Act of 1965. Data forfiscal year 2006 provided to the committee by each company; data for fiscal year 2010 provided by the Department ofEducation on October 14, 2011. See Appendix 9.2609Senate HELP Committee staff analysis of fiscal 2010 Proprietary School 90/10 numerator and denominator figures foreach OPEID provided to the U.S. Department of Education pursuant to section 487(d)(4) of the Higher Education Act of1965. Data provided by the Department of Education on October 14, 2011. See Appendix 9.2610The Ensuring Continued Access to Student Loan Act (ECASLA) increased Stafford loan amounts by up to 2,000 perstudent. The bill also allowed for-profit education companies to exclude the increased amounts of loan eligibility from thecalculation of Federal revenues (the 90/10 calculation) during fiscal years 2009 and 2010. However, ECASLA calculationsfor Rasmussen could not be extrapolated from the data the company provided to the committee.2611Post-9/11 GI bill disbursements for August 1, 2009-July 31, 2010 provided to the committee from the Department ofVeterans Affairs on November 5, 2010; post-9/11 GI bill disbursements for August 1, 2009-June 15, 2011 provided to thecommittee from the Senate Committee on Veterans’ Affairs via the Department of Veterans Affairs on July 18, 2011;Department of Defense Tuition Assistance Disbursements and MyCAA disbursements for fiscal years 2009-11 provided (bybranch) by the Department of Defense on December 19, 2011. Committee staff calculated the average monthly amount ofbenefits collected from VA and DOD for each company, and estimated the amount of benefits received during the company’s2010 fiscal year. See Appendix 11 and 12.2612“Federal education funds” as used in this report means Federal financial aid funds combined with estimated federal fundsreceived from Department of Defense and Department of Veterans Affairs military education benefit programs.635
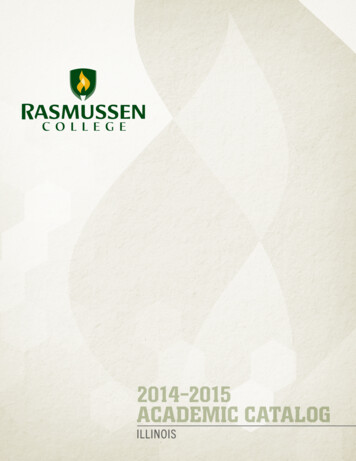
Rasmussen Colleges, Inc. Federal Money Share, 2010Federal EducationFunds: 181 Million19.4%80.6%Federal Education FundsNon‐Federal FundsThe Pell grant program, the most substantial Federal program to assist economicallydisadvantaged students with college costs, is a significant source of revenue for for-profit colleges.Over the past 10 years, the amount of Pell grant funds collected by for-profit colleges as a wholeincreased from 1.4 billion to 8.8 billion; the share of total Pell disbursements that for-profit collegescollected increased from 14 to 25 percent.2613 Part of the reason for this increase is that Congress hasrepeatedly increased the amount of Pell grant dollars available to a student over the past 4 years, and, forthe 2009-10 and 2010-11 academic years, allowed students attending year-round to receive two Pellawards in 1 year. Poor economic conditions have also played a role in increasing the number of Pelleligible students enrolling in for-profit colleges.2613Senate HELP Committee staff analysis of U.S. Department of Education, Federal Student Aid Data Center, Title IV PellGrant Program Volume Reports by School, 2001-2 and /programmatic.html.636
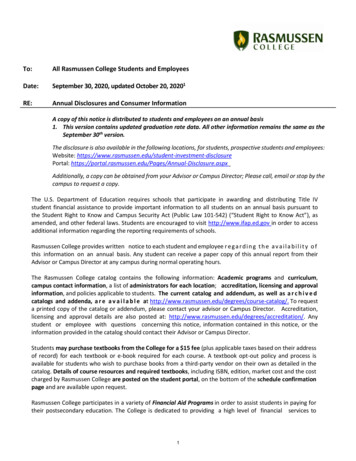
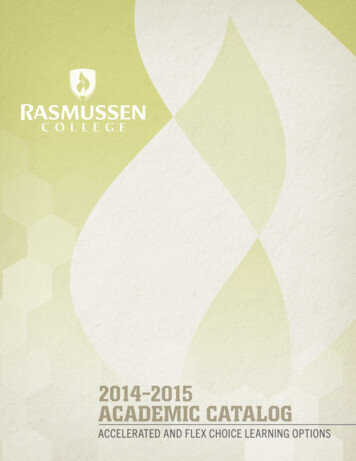
Pell Grant Funds Collected by Rasmussen Colleges, Inc.,Award Years 2007‐1060 48Dollars in Millions504030 2120 1310 802007200820092010Rasmussen increased the amount of Pell grant funds it collected by 480 percent in just 3 years,from 8.3 million in 2007 to 48 million in 2010.2614SpendingWhile the Federal student aid programs are intended to support educational opportunities forstudents, for-profit education companies direct much of the revenue derived from these programs tomarketing and recruiting new students and to profit. On average, among the 15 publicly tradededucation companies, 86 percent of revenue came from Federal taxpayers in fiscal year 2009.2615 Duringthe same period the companies spent 23 percent of revenue on marketing and recruiting ( 3.7 billion),and 19.7 percent on profit ( 3.2 billion).2616 These 15 companies spent a total of 6.9 billion onmarketing, recruiting and profit in fiscal year 2009.2614Pell disbursements are reported according to the Department of Education’s student aid “award year,” which runs fromJuly 1 through June 30 each year. Senate HELP Committee staff analysis of U.S. Department of Education, Federal StudentAid Data Center, Title IV Pell Grant Program Volume Reports by School, 2006-7 through /programmatic.html. See Appendix 13.2615Senate HELP Committee staff analysis of fiscal year 2009 Proprietary School 90/10 numerator and denominator figuresplus all additional Federal revenues received in fiscal year 2009 provided to the committee by each company pursuant to thecommittee document request of August 5, 2010.2616Senate HELP Committee staff analysis of fiscal year 2009 financial statements and information provided to thecommittee by each company pursuant to the committee document request of August 5, 2010. Profit is based on operatingincome. Marketing and recruiting includes all spending on marketing, advertising, admissions and enrollment personnel asreported to the committee. See Appendix 19. “Other” includes: instruction, faculty salaries, executive compensation, studentservices, maintenance, administration, facilities and other expenditures.637
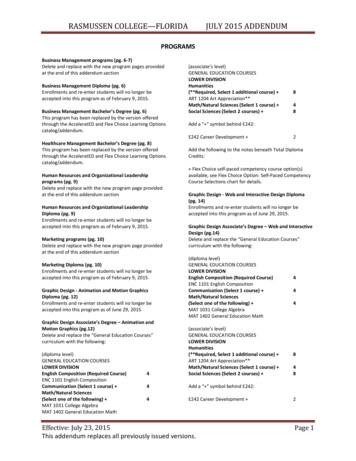
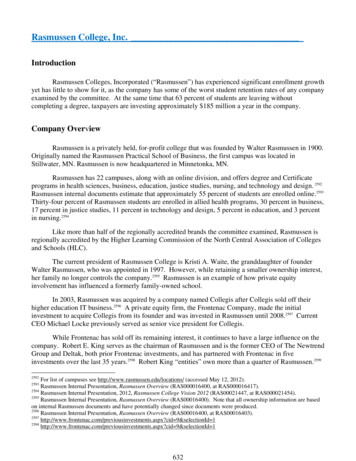
In 2009, Rasmussen allocated 18.1 percent of its revenue, or 26.6 million, to marketing andrecruiting and 26 percent, or 38.3 million, to profit.2617Spending at Rasmussen Colleges, Inc. as a Share of Revenue, 2009Marketing: 27 MillionMarketing, 18.1%Profit: 38MillionOther, 55.9%Profit, 26.0%Rasmussen’s profit has grown rapidly, from 4 million in 2006 to 38 million in 2009.261826172618Id. On average, the 30 for-profit schools examined spent 22.7 percent of revenue on marketing and 19.4 percent on profit.Senate HELP Committee staff analysis. See Appendix 18.638
Rasmussen Colleges, Inc. Profit (Operating Income), 2006‐94540 3835Dollars in Millions302520 1815 12105 402006200720082009Executive CompensationAs a private-held company, Rasmussen is not obligated to release executive compensationfigures.Tuition and Other Academic ChargesCompared to public colleges offering the same programs, the price of tuition is higher atRasmussen. An Associate degree in Business Management with Administration at Rasmussen’sMinnesota campus costs 39,432.2619 The same degree from Normandale Community College costs 7,264.2620 A Bachelor’s degree in Business Management from Rasmussen College costs 68,668.2621The University of Minnesota costs 56,240 for a Bachelor’s in Business.26222619See Appendix 14; see also, Rasmussen College, School of Business, ure/minnesota/ (accessed July 12, 2012).2620See Appendix 14; see also, Normandale Community College, Normandale Community College,http://www.normandale.edu/ (accessed July 12, 2012).2621See Appendix 14; see also, Rasmussen College, School of Business, ure/minnesota/ (accessed July 12, 2012).2622See Appendix 14; see also, University of Minnesota, University of l (accessed July 12, 2012).639
45,000 40,000Cost of an Associate Degree in Business at Rasmussen College and andAssociate of Applied Science in Business at Normandale CommunityCollege 39,432 35,000 30,000 25,000 20,000 15,000 10,000 7,264 5,000 0Rasmussen CollegeNormandale Community CollegeThe higher tuition that Rasmussen charges is reflected in the amount of money that Rasmussencollects for each veteran that it enrolls. From 2009-11, Rasmussen trained 681 veterans and received 8.6 million in post-9/11 GI bill benefits, averaging 12,628 per veteran. In contrast, public collegescollected an average of 4,642 per veteran trained in the same period.2623From 2008 to 2009, Rasmussen transitioned all campuses from a per-course to a per-creditpricing structure, except Minnesota, which was already operating with a per credit structure.2624 The newpricing structure led to average tuition increases of between 7 percent and 23 percent.2625RecruitingEnrollment growth is critical to the business success of for-profit education companies. In orderto meet revenue and profit expectations, for-profit colleges recruit as many students as possible to signup for their programs.Internal company documents make clear that Rasmussen hires outside firms for lead generation.In these lead generation agreements, Rasmussen contracts with a group to provide some or all of thefollowing information about a potential student: first and last name, mailing address, home, cell andwork telephone number, email address, highest degree of education achieved, year achieved the highest2623See Appendix 11. Post-9/11 GI bill disbursements for August 1, 2009-June 15, 2011 provided to the committee from theSenate Committee on Veterans’ Affairs via the Department of Veterans Affairs on July 18, 2011.2624Rasmussen Internal Pricing, April 2009, 2010 Pricing (RAS00003172, at RAS00003173).2625Id.640
degree of education, the best time to call, desired area of study, degree of interest, and planned startdate.2626 These contracts range in number of lead and cost paid per lead. For example, one 2006 contractnoted a price structure of 100 leads per month at a rate of 18 per Qualified Lead for Ground schoolsand 15.00 per Qualified Lead for Online schools.2627 These prices appear to have risen in recent years.A 2008 insertion order was for 700 leads at 45/lead ( 31,500) for Rasmussen Online.2628 One 2010order was for a contract price of 100 leads per month at 40/lead for Rasmussen Online.2629 An Aprilthrough December 2009 Insertion Order from one company noted that production of 50 leads would bebilled at 37/lead for use at two of Rasmussen’s campus ( 1,850), a total of 275 leads at 39/lead foranother 11 campuses ( 10,725), 50 leads at 46/lead for one Florida campus ( 2,300), 25 leads at 46/lead for another Florida campus ( 1,150), and an additional 500 leads at 46/lead ( 23,000) for asum total of 39,025.2630 Lead prices in insertion orders submitted to the HELP Committee indicateRasmussen pays up to 75/lead.2631Rasmussen like many other for-profit education companies includes a binding arbitration clausein its standard enrollment agreement. 2632 This clause severely limits the ability of students to have theircomplaints heard in court, especially in cases in which students with similar complaints seek redress as agroup.OutcomesWhile aggressive recruiting and high cost programs might be less problematic if students werereceiving promised educational outcomes, committee staff analysis showed that tremendous numbers ofstudents are leaving for-profit colleges without a degree. Because 98 percent of students who enroll in a2-year degree program at a for-profit college, and 96 percent who enroll in a 4-year degree program,take out loans, hundreds of thousands of students are leaving for-profit colleges with debt but nodiploma or degree each year.2633Two metrics are key to assessing student outcomes: (1) retention rates based on informationprovided to the committee, and (2) student loan “cohort default rates.” An analysis of these metricsindicates that many people who enroll at Rasmussen are not achieving their educational and careergoals.Retention RatesInformation Rasmussen provided to the committee indicates that of the 9,623 students whoenrolled at Rasmussen in 2008-9, 63.2 percent, or 6,085 students, withdrew by mid-2010. 2634 These2626Rasmussen, July 2007, Signed Internet Media, Inc. Lead Sales Agreement (RAS00003249, at RAS00003255);Rasmussen, Terms Addendum to Agreement between Deltak edu, Inc. And Affiliate Crew, Inc. (RAS00003266,atRAS00003267); Rasmussen, Lead Generation Insertion Order (RAS00003309, at RAS00003309-10).2627Rasmussen, Terms Addendum to Agreement between Deltak edu, Inc. And Affiliate Crew, Inc. (RAS00003266, atRAS00003272).2628Rasmussen, January 2008, Completed ClassesUSA: Client Insertion Order (RAS00003344).2629Rasmussen, Completed Lead Generation Insertion Order (RAS00003309).2630Rasmussen, March 2009, Completed All Star Directories Insertion Order (RAS00003280).2631Rasmussen, May 2010, Education Dynamics Prospecting Services Advertising Agreement (RAS00003443).2632Rasmussen, Rasmussen College Enrollment Agreement (RAS00004438).2633Patricia Steele and Sandy Baum, “How Much Are College Students Borrowing?,” College Board Policy Brief, August2009 es/09b 552 PolicyBrief WEB 090730.pdf2634Rates track students who enrolled between July 1, 2008 and June 30, 2009. For-profit education companies use differentinternal definitions of whether students are “active” or “withdrawn.” The date a student is considered “withdrawn” varies641
withdrawn students were enrolled a median of 5 months.2635 Rasmussen’s retention rates are among thelowest of the companies examined. Associate degree students at Rasmussen, who make up more thanthree-quarters of its student population, withdrew at a rate of 63 percent, meaning nearly half of studentswho enrolled in 2008-9, 4,887 students, were gone by mid-2010.2636 The withdrawal rate forRasmussen’s Bachelor’s program, 64.2 percent, is also significantly higher than the average sector-wideBachelor’s withdrawal rate of 54.3 percent. Rasmussen’s Associate and Bachelor’s program withdrawalrates both rank amongst the 10 worst in the sector.2637Status of Students Enrolled in Rasmussen in 2008‐9, as of 2010Degree LevelEnrollmentPercentPercent StillPercentNumberCompletedEnrolledWithdrawn WithdrawnAssociate Degree7,7587.8%29.2%63.0%4,887Bachelor’s Degree1,8652.9%32.9%64.2%1,198All 4Student Loan DefaultsThe large number of students leaving Rasmussen without a degree does not correlate with therelatively low rate of student loan defaults by students who attended Rasmussen. The Department ofEducation tracks and reports the number of students who default on student loans (meaning that thestudent does not make payments for at least 360 days) within 3 years of entering repayment, whichusually begins 6 months after leaving college.2638Slightly more than 1 in 5 students who attended a for-profit college (22 percent) defaulted on astudent loan, according to the most recent data.2639 In contrast, 1 student in 11 at public and non-profitschools defaulted within the same period.2640 On the whole, students who attended for-profit schoolsdefault at nearly three times the rate of students who attended other types of institutions.2641 Theconsequence of this higher rate is that almost half of all student loan defaults nationwide are held bystudents who attended for-profit colleges.2642from 10 to 90 days from date of last attendance. Two companies provided amended data to properly account for students thathad transferred within programs. Committee staff note that the data request instructed companies to provide a unique studentidentifier for each student, thus allowing accurate accounting of students who re-entered or transferred programs within theschool. The dataset is current as of mid-2010, students who withdrew within the cohort period and re-entered afterward arenot counted. Some students counted as withdrawals may have transferred to other institutions.2635Additionally, an internal Rasmussen document estimates that 59 percent of starts persist to the third quarter. RasmussenInternal Presentation, Maximizing Our Return on Admissions (RAS0006445, at RAS0006447).2636Enrollment is calculated using fall enrollment for all unit identifications controlled by the company for each year from theDepartment of Education’s Integrated Postsecondary Data System (hereinafter IPEDS). See Appendix 7.2637It is not possible to compare student retention or withdrawal rates at public or non-profit institutions because this datawas provided to the committee directly by the companies. While the Department of Education tracks student retention andoutcomes for all colleges, because students who have previously attended college are excluded from the data set, it fails toprovide an accurate picture of student outcomes or an accurate means of comparing for-profit and non-profit and publiccolleges. See Appendix 15.2638Direct Loan default rates, 34 CFR 668.183(c).2639Senate HELP Committee staff analysis of U.S. Department of Education Trial Cohort Default Rates fiscal year cohort.html. Default rates calculated by cumulating number of students enteredinto repayment and default by sector.2640Id.2641Id.2642Id.642
The default rate across all 30 companies examined increased each fiscal year between 2005 and2008, from 17.1 percent to 22.6 percent.2643 This change represents a 32.6 percent increase over 4years.2644 Rasmussen was one of only four schools whose 3-year default rate dropped from 2005 to2008. Rasmussen’s default rate was 14.7 percent for students entering repayment in 2005 and 11.6percent for students entering repayment in 2008.30%Rasmussen Colleges, Inc. Trial 3‐Year Default Rates, 1.6%9.2%5%0%200520062007Rasmussen Colleges, Inc. Default Rate2008Average Default Rate, All CollegesThe default rate for some Rasmussen programs is markedly higher. These include: NetworkSupport (45 percent), Child Care Specialists (26 percent default rate), Pharmacy Technician (26percent), and Criminal Justice (22 percent).2645It is likely that the reported default rates significantly undercount the number of students whoultimately face default, because of companies’ efforts to place students in deferments and forbearances.From 2005 to March 2008, Rasmussen contracted with General Revenue Corporation (GRC), asubsidiary of Sallie Mae, to operate its default management.2646 GRC operates call centers withhundreds of employees trained to “cure” student defaults. When a student is in forbearance their loanbalances continue to grow as the result of accumulating interest but default is averted both for thestudent and the company. However, for many students forbearance and deferment serve only to delaydefault beyond the 3-year measurement period the Department of Education uses to track defaults.2643Senate HELP Committee staff analysis of U.S. Department of Education Trial Cohort Default Rates fiscal year cohort.html. Default rates calculated by cumulating number of students enteredinto repayment and default for all OPEID numbers controlled by the company in each fiscal year. See Appendix 16.2644Id.2645Rasmussen, January 2010, Default Rates, A three year look (RAS00004360).2646Rasmussen, January 2010, Default Rates, A three year look (RAS00004360).643
According to internal company emails GRC did a poor job when they were first hired by Rassmussenand cut its fees in half for its service.2647After March 2008 Rasmussen decided to centralize default management.2648 This centralizationof default management included engaging with private investigators for skip tracing and signaturegathering.2649 Skip tracing is the process of locating a borrower’s whereabouts whose contactinformation is not known. The private investigators performed skip tracing on every borrower at a rateof 25 per student, and were tasked with attaining two signatures per student at a rate of 50 per studentwithin Minnesota and 75 per student in other States.2650 The company asserts that it no longer utilizesprivate investigators.Instruction and AcademicsThe quality of any college’s academics is difficult to quantify. However, the amount that aschool spends on instruction per student compared to other spending and what students say about theirexperience are two useful measures. By looking at the instructional cost that all sectors of highereducation report to the Department of Education, it is possible to compare spending on actualinstruction.Rasmussen spent 4,801 per student on instruction in 2009, compared to 6,261 on marketingand 9,017 on profit.2651 The amount that privately held companies the committee examined spend oninstruction ranges from 1,118 to 6,389 per student per year.2652 In contrast, public and non-profitschools generally spend a higher amount per student on instruction, while community colleges spend acomparable amount but charge far lower tuition than for-profit colleges. Other Minnesota-basedcolleges spent, on a per student basis, 13,247 at the University of Minnesota, 4,208 at NormandaleCommunity College, and 11,361 at the University of St Thomas.2653In a June 2010 presentation informing Rasmussen management of the upcoming HELPCommittee’s hearings on for-profit schools, Department of Education rulemaking, and increased mediaattention on for-profit schools, the presenter highlighted the need for increasing spending on its publicrelations message. The presentation states:Rapid expansion of institutional research office, government relations and publicadvocacy efforts. We will redeploy resources from other key areas. Nothing more2647Rasmussen Internal Email, February 2008, re: RE: CCA Cohort Default Rate (RAS00024382).Rasmussen Internal Email, January 2010, Default Rates, A three year look (RAS00004360).2649Id.2650Rasmussen Internal Presentation, Default Management Department (RAS00004301, at RAS00004314).2651Marketing figures provided by company or Securities and Exchange filings, instruction figure from IPEDS. IPEDs datafor instruction spending based on instructional cost provided by the company to the Department of Education. According toIPEDS, instruction cost is composed of “general academic instruction, occupational and vocational instruction, specialsession instruction, community education, preparatory and adult basic education, and remedial and tutorial instructionconducted by the teaching faculty for the institution’s students.” Denominator is IPEDS “full-time equivalent” enrollment.See Appendix 21.2652Id. Drake College of Business (low end) and Ch
Rasmussen is a privately held, for-profit college that was founded by Walter Rasmussen in 1900. Originally named the Rasmussen Practical School of Business, the first campus was located in Stillwater, MN. Rasmussen is now headquartered in Minnetonka, MN. Rasmussen has 22 campuses, along with an online division, and offers degree and Certificate