Transcription
Evans et al. BMC Medicine(2021) EARCH ARTICLEOpen AccessCharacteristics and mortality rates amongpatients requiring intermediate care: anational cohort study using linkeddatabasesCatherine J. Evans1,2* , Laura Potts3, Ursula Dalrymple3, Andrew Pring3, Julia Verne3, Irene J. Higginson1 ,Wei Gao1 and on behalf of SPACEAbstractBackground: Adults increasingly live and die with chronic progressive conditions into advanced age. Many livewith multimorbidity and an uncertain illness trajectory with points of marked decline, loss of function and increasedrisk of end of life. Intermediate care units support mainly older adults in transition between hospital and home toregain function and anticipate and plan for end of life. This study examined the patient characteristics and thefactors associated with mortality over 1 year post-admission to an intermediate care unit to inform priorities forcare.Methods: A national cohort study of adults admitted to intermediate care units in England using linked individuallevel Hospital Episode Statistics and death registration data. The main outcome was mortality within 1 year fromadmission. The cohort was examined as two groups with significant differences in mortality between maindiagnosis of a non-cancer condition and cancer. Data analysis used Kaplan-Meier curves to explore mortalitydifferences between the groups and a time-dependant Cox proportional hazards model to determine mortality riskfactors.Results: The cohort comprised 76,704 adults with median age 81 years (IQR 70–88) admitted to 220 intermediatecare units over 1 year in 2016. Overall, 28.0% died within 1 year post-admission. Mortality varied by the maindiagnosis of cancer (total n 3680, 70.8% died) and non-cancer condition (total n 73,024, 25.8% died). Illnessrelated factors had the highest adjusted hazard ratios [aHRs]. At 0–28 days post-admission, risks were highest fornon-cancer respiratory conditions (pneumonia (aHR 6.17 [95%CI 4.90–7.76]), chronic obstructive pulmonary disease(aHR 5.01 [95% CI 3.78–6.62]), dementia (aHR 5.07 [95% CI 3.80–6.77]) and liver disease (aHR 9.75 [95% CI 6.50–14.6])compared with musculoskeletal disorders. In cancer, lung cancer showed largest risk (aHR 1.20 [95%CI 1.04–1.39])compared with cancer ‘other’. Risks increased with high multimorbidity for non-cancer (aHR 2.57 [95% CI 2.36–2.79])(Continued on next page)* Correspondence: Catherine.evans@kcl.ac.uk1King’s College London, Cicely Saunders Institute of Palliative Care, Policyand Rehabilitation, Bessemer Road, London SE5 9PJ, England2Sussex Community NHS Foundation Trust HQ, Brighton General Hospital,Elm Grove, Brighton BN2 3EW, EnglandFull list of author information is available at the end of the article The Author(s). 2021 Open Access This article is licensed under a Creative Commons Attribution 4.0 International License,which permits use, sharing, adaptation, distribution and reproduction in any medium or format, as long as you giveappropriate credit to the original author(s) and the source, provide a link to the Creative Commons licence, and indicate ifchanges were made. The images or other third party material in this article are included in the article's Creative Commonslicence, unless indicated otherwise in a credit line to the material. If material is not included in the article's Creative Commonslicence and your intended use is not permitted by statutory regulation or exceeds the permitted use, you will need to obtainpermission directly from the copyright holder. To view a copy of this licence, visit http://creativecommons.org/licenses/by/4.0/.The Creative Commons Public Domain Dedication waiver ) applies to thedata made available in this article, unless otherwise stated in a credit line to the data.
Evans et al. BMC Medicine(2021) 19:48Page 2 of 13(Continued from previous page)and cancer (aHR 2.59 [95% CI 2.13–3.15]) (reference: lowest).Conclusions: One in four patients died within 1 year. Indicators for palliative care assessment are respiratoryconditions, dementia, liver disease, cancer and rising multimorbidity. The traditional emphasis on rehabilitation andrecovery in intermediate care units has changed with an ageing population and the need for greater integration ofpalliative care.Keywords: Intermediate care facilities, Health services for the aged, Subacute care, Geriatrics, Palliative care,Mortality, Cohort studiesBackgroundAdults increasingly live and die with chronic progressive conditions into advanced age. The LancetCommission in 2017 identified living with chronic illness that compromises physical, social or emotionalfunction as a construct of serious health-related suffering relieved by palliative care where quality of lifeis the main goal of care [1]. Globally, the greatestincrease in serious health-related suffering is projected for people aged 70 years and over [2]. Livinginto advanced age is often accompanied by multimorbidity and frailty and an uncertain illness trajectory of gradual decline over many years into end oflife [3–5]. This trajectory is punctuated by points ofmarked decline from an often seemingly minorevent, like an infection and risk of poor outcomesincluding hospitalisation and death [4]. Unplannedhospitalisations are common and rise with nearnessof end of life [6, 7]. This trajectory is well described,but less understood are the priorities for high-qualitycare for people to live as well as possible withadvancing age and chronic conditions [5].Inpatient intermediate care units, such as a communityhospital or post-acute facility, are an important part ofthe continuum of care to manage the care needs forpeople with chronic progressive conditions. They careincreasingly for a mainly older population to providetime-limited transitional care between different levels ofcare and settings, for example, acute hospital and home.Care focuses on supporting recovery and functionfollowing points of decline with emphasis on comprehensive geriatric assessment, enablement and rehabilitation [8, 9]. These units are generally small ( 30 beds)[10] and provide subacute services tailored to the needsof the local population with varying access to specialist services such as a geriatrician, alongside the core staff [8, 9].Patients and family carers describe these facilities positivelyplacing particular value on location close to home thatenables holistic and personalised care facilitated by multidisciplinary team working and support for difficult psychological transitions, for example, loss of independence withdisease progression [10]. Systematic review evidencedemonstrates that compared with acute hospital care,patients and family carers in intermediate care units reportbetter experiences and care is cost-effective to supportpost-acute recovery and rehabilitation [8, 11]. However, lessconsidered is risk of end of life and the need for care orientated towards quality of life and comprehensive palliativecare assessment.Orientating services to changing population needs andidentifying priorities to ensure high-quality care is bestinformed by understanding care needs at a populationlevel. However, there is a dearth of population-based evidence on the characteristics of adults admitted to intermediate care units and nearness of death and theassociated factors. Our review of evidence before thisstudy on mortality over 1 year post-admission to anintermediate care unit (community hospital, post-acutecare or skilled nursing facility) identified twelve studies[12–23] reporting approximately 661,751 participants(Additional file D: Tables D1-D2). No studies consideredthe total population at the national level or indicatorsfor care where quality of life is the main goal. Rather,the studies reported discrete populations by a specificdisease(s), intervention or region to identify factors associated with mortality, for example, physical function andquality of care. This study aimed to examine the patientcohort characteristics and factors associated with mortality over 1 year post-admission to an intermediate careunit in England. The findings intended to inform policyand clinical priorities to deliver high-quality care forpeople in transition between hospital and home andrequiring intermediate care.MethodsStudy design, data sources and participantsA national retrospective cohort study using linked databases. These included National Health Service (NHS)Hospital Episode Statistics (HES) linked at theindividual-level to the Office for National Statistics(ONS) death registration data. Intermediate care unitswere defined in the HES data as a community hospitalwith inpatient beds in England. Data were extracted forall adults admitted to an intermediate care unit, 01/01/
Evans et al. BMC Medicine(2021) 19:482016 to 31/12/2016 as the most complete datasets. NHSDigital supplied the HES data and ONS death registration records data linked by an individual anonymisedidentifier to enable deterministic linkage [24]. HES datadetails information about all patients admitted to NHShospitals in England [25]. It captures illnesses andrelated conditions, with each electronic record containing up to 20 diagnosis fields coded according to International Classification of Diseases, 10th edition (ICD-10)[26]. The population cohort included adults ( 18 years)admitted for 1 nights to an eligible intermediate careunit between 01/01/2016 and 31/12/2016, with 12-monthfollow-up until end of 2017. Individuals were excludedusing outpatient (e.g. day case) or maternity facilities.Reporting follows the STROBE guideline [27] and the RECORD [28] extension for routine data (Additional file A:Table A1).ProceduresThe vital status (alive or dead) of the cohort was identified from the linked mortality data for date of death overthe 12 months from the first admission (the indexadmission) to an intermediate care unit. Patients wherea linked death record was not identified were assumedto have survived. HES data on hospital admission wereaggregated into a patient “spell” in a single hospital. Eachspell encompassed all episodes of care reported in theidentified intermediate care unit to confirm the admission and discharge dates. Discharge included to usualresidence, transfer to another medical facility or death.All intermediate care units in England in the HES datawere reviewed to identify those with inpatient facilitiesand reported admissions of 1 night in 2016. But identifying the facilities was convoluted. These facilities arenot automatically differentiated in the HES database.Initially, facilities were identified from the names andpostcodes from the Community Hospital Association(CHA), UK database [29] and each postcode checkedwith the respective facility website. Each confirmed postcode was mapped to the NHS site code in the NHSTrust Site database [30] and each site code then checkedin the NHS successor archive database [31] to removefacilities that closed in 2016.Main outcome and covariatesThe main outcome was mortality within 1 year from theindex admission. The last year of life is considered a keyindicator for likely benefit from palliative care [32]. Thecovariates examined as associated with end of lifeincluded demographic, illness and environmental factors.Demographic covariates included age (grouped for clinical relevance), sex and ethnicity. Illness factors were themain diagnosis derived from the first recorded diagnosiscode on the index admission. Codes were recorded inPage 3 of 13ICD-10 and grouped using respective chapter codes(Additional File C: Tables C4-C5). Comorbidities werecalculated from the Charlson comorbidity index for eachperson using the R ‘comorbidity’ package (version0.5.3.9) [33, 34]. All recorded diagnoses were collatedfrom the index admission and hospital episodes over1 year before the index admission [35]. Environmentcovariates included the admission setting (e.g. postacute), admission type categorised as elective when thedecision to treat was prescribed before the admission, ornon-elective, and level of deprivation by usual place ofresidence using index of multiple deprivation indices[36] at Lower Super Output Area (LSOA).Statistical analysisPatient socio-demographics and clinical characteristicswere described with descriptive statistics. Kaplan-Meiercurves were used to visualise survival probabilities byrespective explanatory variables. The multivariate survival analysis used a time-dependant Cox proportionalhazards (PH) model to determine factors associated withmortality. All descriptive socio-demographic and clinicalvariables (see Table 1) were examined for inclusion inthe survival model. The model included only completecases for the identified covariates.The modelling procedure for the multivariate analysiswas as follows. First, data were split into two cohorts, ofmain diagnosis non-cancer condition or cancer at theindex admission. Sensitivity analysis showed that thesurvival profile for a main diagnosis of a non-cancercondition was significantly different from cancer. Individuals with a main diagnosis of a non-cancer conditionmay have had a history of cancer, but this was notreported as the reason for admission. Two separatemodels were fitted to accommodate the difference inmortality between the non-cancer and cancer groups.Initially, a stepwise variable selection procedure obtainedthe best Cox PH model for each cohort, using bidirectional selection with p value entry criterion 0.1 andretention criterion of 0.05 (Additional file B). Themodels were selected that had the maximum concordance statistic (a measure of goodness of fit) and contained the fewest covariates, retaining those with clinicalimportance (e.g. admission type). The Schoenfeld residuals of each covariate were tested for proportionalhazards. However, the non-proportional hazards violatedthe assumptions of the Cox PH approach. To addressthis, time-dependant coefficients were used for covariates that had a non-stationary effect on mortality overtime (e.g. main diagnosis) [37]. This meant thatcoefficients for covariates that violated the proportionalhazards assumption could vary as a step function overtime [37]. Time intervals of 28 days in the cancer modeland 28 days and 180 days in the non-cancer model were
Evans et al. BMC Medicine(2021) 19:48Page 4 of 13Table 1 Demographics of the study populationNon-cancerCancerAllTotal number of patients73,024368076,704Mortality 365 days from admission18,840 (25.8%)2605 (70.8%)21,477 (28.0%)Days until death from admission0–28 nights3615 (19.2%)1433 (55.0%)5048 (23.5%)29–180 nights9587 (50.8%)964 (37.0%)10,551 (49.2%)181–365 nights5657 (30.0%)209 (8.0%)5866 (27.3%)Age (years)Mean (SD)76.8 (15.9)73.9 (12.8)76.7 (15.8)Median (IQR)81 (71–88)76 (67–83)81 (70–88)18–393226 (4.4%)60 (1.6%)3286 (4.3%)40–649103 (12.5%)685 (18.6%)9788 (12.8%)65–7410,927 (15.0%)976 (26.5%)11,903 (15.5%)75–8421,848 (29.9%)1194 (32.5%)23,042 (30.0%)85–9424,657 (33.8%)713 (19.4%)25,370 (33.1%)95 3263 (4.5%)52 (1.4%)3315 (4.3%)Age (years)SexFemale43,228 (59.2%)1932 (52.5%)45,100 (58.8%)Male29,793 (40.8%)1748 (47.5%)31,601 (41.2%)69,892 (95.7%)3574 (97.1%)73,466 (95.8%)EthnicityWhiteBlack and ethnic minority1930 (2.6%)41 (1.1%)1971 (2.6%)Unknown1202 (1.7%)65 (1.8%)1267 (1.7%)Median (IQR)1 (0–3)8 (3–9)2 (0–3)Range0–182–170–18Charlson comorbidity indexCharlson comorbidity index020,155 (27.6%)0 (0.0%)20,155 (26.3%)1–228,386 (38.9%)713 (19.4%)29,099 (37.9%)3–415,275 (20.9%)667 (18.1%)15,942 (20.8%) 59208 (12.6%)2300 (62.5%)11,508 (15.0%)Elective16,535 (22.7%)1257 (34.2%)17,828 (23.3%)Non-elective56,307 (77.3%)2418 (65.8%)58,689 (76.7%)Hospital (ED or general hospital)33,553 (46.0%)1360 (37.0%)34,913 (45.5%)Home (personal dwelling/care home)36,585 (50.1%)2286 (62.1%)38,871 (50.7%)Other617 (0.8%)15 (0.4%)632 (0.8%)Unknown2269 (3.1%)19 (0.5%)2288 (3.0%)Median (IQR)17 (5–34)8 (5–34)17 (5–34)Range0–10730–1900–10730–25 nights46,916 (64.6%)2961 (80.6%)49,877 (65.4%)26 nights25,733 (35.4%)712 (19.4%)26,445 (34.7%)Admission typeAdmitted fromLength of stay in an intermediate care unitLength of stay in an intermediate care unitData are n (%) and represent status at index admission to the intermediate care unit. Charlson Index includes all malignancy, including lymphoma and leukaemia,except malignant neoplasm of skin [35]. Abbreviations: SD standard deviation, IQR interquartile range, ED emergency department. Definition: home andcommunity setting, e.g. own home, care home (with or without nursing) but not residential accommodation where medical care is provided, e.g.inpatient hospice
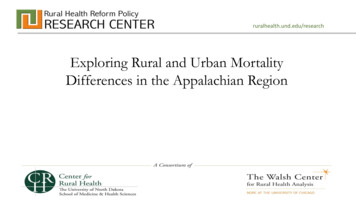
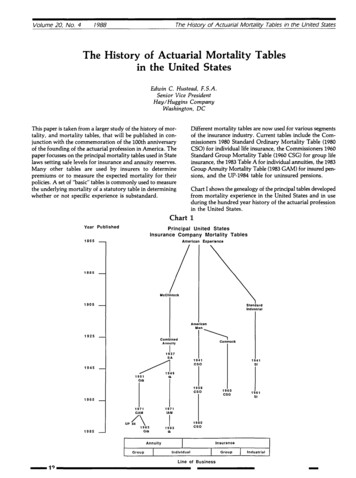
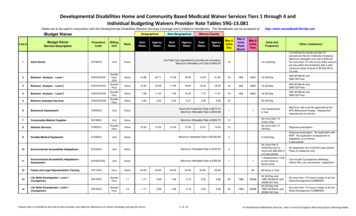
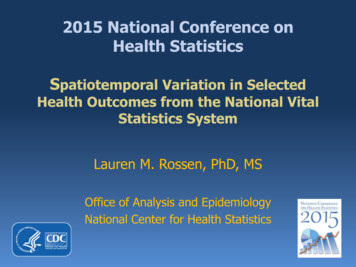
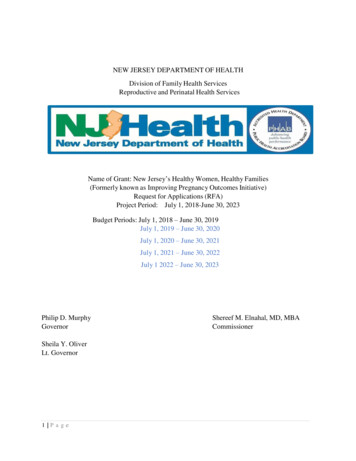
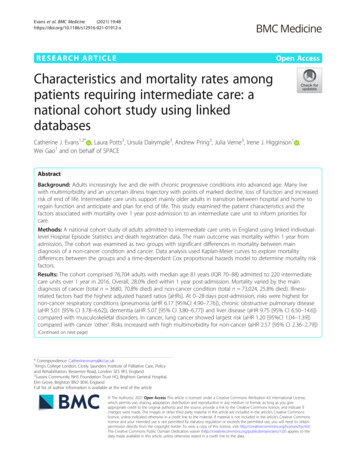
Evans et al. BMC Medicine(2021) 19:48identified by depicting the original hazard estimateagainst the time-varying estimate of a given covariate.The final model fit was assessed by visually comparingobserved to expected hazard plots and observing concordance statistics. All analyses were completed in R(version 3.6.1). All statistical tests were 2-sided at a levelof p 0.05.Research ethics statementThe study used anonymous national datasets. ONSIndividual Approvals for full data access were held byLP, UD and AP. CJE and WG accessed the aggregated data. Ethical approval was not required.ResultsStudy populationFrom 01/01/2016 to 31/12/2016, 76,704 individual adultswere admitted to 220 intermediate care units in England(Fig. 1). The facilities were in both urban and rural localities. Most facilities had a single ward (71%) providinggeneral medical care (Additional file C: Tables C2-C3).We identified 266 intermediate care units but excluded46 (17.3%) with no admissions recorded, because of, forexample, closure of inpatient beds.Table 1 shows the characteristics of the cohort. Mostpatients were older with a median age at admission of81 years (IQR 70–88, range 18–107), ethnically white(95.8%) and female (58.8%). The population formed twooverarching groups identified by the main admissiondiagnosis of cancer (n 3680, 4.8%) or non-cancer condition (n 73,024, 95.2%) with significant difference inmortality (70.8% vs. 25.8% respectively). The main cancer site were digestive organs (23.6%) (Additional file C:Tables C1, C4-C5). The non-cancer conditions werehighly heterogeneous with prominent conditions of injuries (17.0%) and ‘unknown and unspecified causes ofmorbidity’ (12.7%) (Additional file C: Table C1, C4-C5).Multimorbidity was common (73.7%) and highest in thecancer group (62.5% highest score of 5). Admissionwere non-elective (total n 58,689, 76.7%) from hospital(45.5%) or usual residence (50.7%).Main outcomeMortality over 1 year varied by diagnosis (cancer 2605,70.8%), and non-cancer (18,840, 25.8% cases died) (seeFig. 2a). Deaths in the cancer group largely occurred 0to 28 days post-admission (1433, 55.0%), and in the noncancer group 29 to 180 days post-admission (9587,50.8%) (Fig. 2a, Table 1). In the non-cancer group,chronic heart disease, respiratory diseases (pneumoniaand chronic obstructive pulmonary disease [COPD]),dementia and liver disease had lowest survival probability over time (see Fig. 2b). Increasing comorbiditiesshowed declining survival probability in both the cancerPage 5 of 13and non-cancer groups (see Fig. 2c). In both groups, theindex admission was mainly non-elective (non-cancer56,307, 77.3%; cancer 2418, 65.8% cases), with similarproportions admitted post-acute (non-cancer 33,553,46.0%; cancer 1360, 37.0%) or usual residence (non-cancer 36,585, 50.1%; cancer 2286, 62.1%). Survivalincreased with decreasing age in both groups (Additionalfile C: Fig.C1, Kaplan-Meir curve by age categories).The multivariate analysis used two models of noncancer (72839) and cancer (3675), total 76,514 completecases. Tables 2 and 3 show the respective model and thefactors associated with mortality. The models includedsix covariates comprising age, sex, comorbidities(Charlson index score), main diagnosis, admission typeand admission setting. To meet the hazards assumptionof variation by time, step functions were employed at 28days and 29–365 days in the cancer model, and 0–28days, 29–180 and 181–365 days in the non-cancermodel.In the non-cancer model, typically all covariatesremained significant overtime compared to the respective reference covariate (Table 2). The model showed agood fit with high concordance at 0.725. Femalesshowed a consistently lower hazard ratio relative tomales men (0 to 28 days aHR 0.80 [95% CI, 0.75–0.85]),and elective compared to non-elective admissions (0 to28 days aHR 0.81 [95% CI 0.73–0.90]). Admissions fromhospital showed the highest risk of mortality at 0 to 28days (aHR 1.26 [95% CI 1.18–1.35]) compared with fromusual residence (e.g. home). Hazard ratios increased withincreasing comorbidities (Charlson Index) and age andremained consistent overtime. Conversely, the hazardratios for main diagnosis on index admission weregenerally highest in the 0 to 28 days post-admission, anddecreased overtime. Prominent conditions relative toMSK disorders comprised pneumonia (aHR 6.17 [95%CI 4.90–7.76]), chronic heart disease (adjusted HR 6.14[95% CI 4.83–7.81]), dementia (aHR 5.07 [95% CI 3.80–6.77]), COPD (aHR 5.01 [95% CI 3.78–6.62]), renal andgenitourinary (aHR 3.05 [95% CI 2.41–3.87]) andcerebrovascular disease (aHR 3.02 [95% CI 2.35–3.88]).The six covariates in the cancer model showed greatervariation overtime and slightly lower model concordanceof 0.686 compared to the non-cancer model (Table 3).The cancer model showed that patients admitted postacute had a lower hazard ratio compared with thosetransferring from usual residence (0 to 28 days aHR 0.85[95% CI 0.77–0.95] and 29 to 365 days aHR 0.86 [95%CI 0.76–0.98]). Of those admitted from home, 58.9%had a Charlson index of 3 compared to 40.3% admittedfrom hospital. Patients with increasing comorbidities(Charlson index 5) showed the largest ratio (aHR 2.59[95% CI 2.13–3.15] 0–28 days) relative to the lowestindex (1–2). Hazard ratios varied by cancer type with
Evans et al. BMC Medicine(2021) 19:48Page 6 of 13Fig. 1 Study cohort profilelung cancer showing highest ratio (aHR 1.20 [95% CI1.04–1.39] 0 to 28 days) relative to ‘other’ cancer conditions. Mortality increased with rising age, but a patternof higher hazard ratios was less apparent compared withthe non-cancer model.DiscussionMain findingsThis study reports a novel analysis of the characteristicsof a national cohort of adults admitted to intermediatecare units and outcome of death over 1 year. The findings show that this is a mainly older population withchronic progressive disease and multimorbidity. Overone in four were in the last year of life. The wide variation in end of life indicates the need for care and treatment to support both recovery and plan for andanticipate end of life. The findings on the associationswith end of life identify triggers for palliative care including the main diagnosis (respiratory conditions, dementia, liver disease and cancer), high multimorbidity( 5 Charlson index score), advanced age and nonelective admission. This is a population with high careneeds including management of multiple progressiveconditions, supporting recovering and anticipating andplanning for end of life. The findings challenge perceptions of intermediate care settings, with relatively lowtechnology, as managing seemingly simplistic care needs.New models of care are indicated with better integrationbetween intermediate care facilities, geriatric care andpalliative care, and a skilled workforce to manage multiple care needs across the continuum of care and intoend of life.We compared our findings on associations with end oflife with 12 studies included in our systematic review on
Evans et al. BMC Medicine(2021) 19:48Page 7 of 13Fig. 2 Kaplan-Meier survival curves and 95% confidence intervals by a main admission reason relating to cancer and non-cancer, b maindiagnosis and c Charlson comorbidity index by cancer and non-cancer
Evans et al. BMC Medicine(2021) 19:48Page 8 of 13Table 2 Non-cancer model and factors associated with mortality within 1 year post-admission (complete cases n 72,839)Covariate [*denotesreference group]0 to 365 days Hazard up to 28 daysaHazard 29 to 180 daysbHazard 181 to 365 dayscn/N (%)n/N (%)Adjusted hazard n/N (%)ratio (95% CI)Adjusted hazard n/N (%)ratio (95% CI)Adjusted hazardratio (95% CI)18–64683/12,288(6%)191/12,288(2%)0.38 (0.32, 0.44) 313/12,097(3%)0.17 (0.15, 0.19) 179/11,784(2%)0.14 (0.12, 0.16)65–741885/10,894(17%)407/10,894(4%)0.58 (0.52, 0.65) 906/10,487(9%)0.41 (0.38, 0.44) 572/9581(6%)0.41 (0.38, 0.45)75–845731/21,796(26%)1101/21,796 0.7 (0.65, 0.75)(5%)2852/20,695(14%)0.6 (0.57, 0.62)1778/17,843(10%)0.62 (0.59, 0.66)85–94*10,514/27,861(38%)1911/27,861 1(7%)5 0%)1789/29,759 4/43,080(23%)821/43,080(4%)0.8 (0.75, 0.85)5095/41,259(12%)0.76 (0.73, 0.80) 3118/36,164(9%)0.76 (0.72, 0.80)02172/20,088(11%)341/20,088(2%)0.59 (0.52, 0.67) 1050/19,747(5%)0.58 (0.54, 0.63) 781/18,697(4%)0.66 (0.60, 0.71)1–2*6702/28,320(24%)1158/28,320 1(4%)113–45290/15,249(35%)990/15,249(6%)1.39 (1.28, 1.52) 2737/14,259(19%)1.41 (1.34, 1.48) 1563/11,522(14%)1.36 (1.28, 1.45)5 449/9182(51%)1121/9182(12%)2.57 (2.36, 2.79) 2386/8061(30%)2.31 (2.19, 2.44) 1142/5675(20%)2.06 (1.92, 2.22)Non-elective*16,646/56,270(30%)3169/56,270 1(6%)11Elective2167/16,569(13%)441/16,569(3%)Age (years)SexCharlson comorbidity index3398/27,162(13%)2146/23,764(9%)Admission type8490/53,101(16%)0.81 (0.73, 0.90) 1081/16,128(7%)4987/44,611(11%)0.72 (0.67, 0.77) 645/15,047(4%)0.67 (0.62, 0.73)12351/30,788(8%)13036/26,450(11%)1.07 (1.02, 1.13)Setting admitted fromHome* (personal dwelling/ 8005/36,442care home)(22%)1421/36,442 2/33,529 1.26 (1.18, 1.35) 4987/31,437(6%)(16%)0.97 (0.93, 1.01)Other and unknown693/2868(24%)97/2868(3%)0.74 (0.60, 0.91) 351/2771(13%)0.83 (0.75, 0.93) 245/2420(10%)1.02 (0.89, 1.16)1309/8683(4%)1Main diagnosis on admission (ICD-10 code)Musculoskeletal disorders*(M)855/9229 (9%) 96/9229(1%)1450/9133(5%)Injury (S, T)2770/13,002(21%)299/13,002(2%)1.38 (1.09, 1.74) 1495/12,703(12%)1.4 (1.26, 1.56)976/11,208(9%)1.35 (1.18, 1.53)Renal and genitourinarydisease (N)1478/4820(31%)257/4820(5%)3.05 (2.41, 3.87) 783/4563(17%)2 (1.78, 2.25)438/3780(12%)1.86 (1.60, 2.16)Cerebrovascular disease(I60–68)769/3067(25%)191/3067(6%)3.02 (2.35, 3.88) 375/2876(13%)1.36 (1.19, 1.57) 203/2501(8%)1.12 (0.94, 1.35)Digestive diseases (K)613/2828(22%)133/2828(5%)3.47 (2.67, 4.51) 306/2695(11%)1.77 (1.53, 2.05) 174/2389(7%)1.57 (1.31, 1.90)Pneumonia (J)1223/2821(43%)341/2821(12%)6.17 (4.90, 7.76) 553/2480(22%)2.31 (2.03, 2.62) 329/1927(17%)2.34 (2.00, 2.74)Chronic heart disease (I)823/1819(45%)242/1819(13%)6.14 (4.83, 7.81) 399/1577(25%)2.41 (2.10, 2.76) 182/1178(15%)1.89 (1.57, 2.28)
Evans et al. BMC Medicine(2021) 19:48Page 9 of 13Table 2 Non-cancer model and factors associated with mortality within 1 year post-admission (complete cases n 72,839)(Continued)Covariate [*denotesreference group]0 to 365 days Hazard up to 28 daysaHazard 29 to 180 daysbHazard 181 to 365 dayscn/N (%)n/N (%)Adjusted hazard n/N (%)ratio (95% CI)Adjusted hazard n/N (%)ratio (95% CI)Adjusted hazardratio (95% CI)Infections (A, B)485/1411(34%)96/1411(7%)3.69 (2.78, 4.91) 274/1315(21%)2.41 (2.07, 2.81) 115/1041(11%)1.67 (1.34, 2.07)COPD (J40–44)496/1125(44%)105/1125(9%)5.01 (3.78, 6.62) 252/1020(25%)2.86 (2.45, 3.34) 139/768(18%)2.76 (2.26, 3.39)92/1046(9%)5.07 (3.80, 6.77) 187/954(20%)2.17 (1.82, 2.57) 117/767(15%)2.23 (1.80, 2.76)1.32 (1.01, 1.73)Dementia (F00–03, G30–31) 396/1046(38%)Acute heart disease (I)304/955 (32%) 62/955 (6%)3.38 (2.45, 4.66) 175/893(20%)2.13 (1.78, 2.54) 67/718 (9%)Blood diseases (D)223/574 (39%) 45/574 (8%)4.47 (3.13, 6.38) 118/529(22%)2.66 (2.17, 3.26) 60/411 (15%) 2.49 (1.89, 3.29)Liver disease (B17–B18,C22, K70–75)88/178 (49%)32/178(18%)9.75 (6.50, 14.6) 40/146 (27%) 4.06 (2.93, 5.62) 16/106 (15%) 3.23 (1.95, 5.36)Mental/behaviouraldisorders (F)240/2418(10%)28/2418(1%)1.37 (0.89, 2.09)Other8050/27,546(29%)1591/27,546 3.6 (2.92, 4.43)(6%)124/2390(5%)1.42 (1.16, 1.73) 88/2266 (4%) 1.51 (1.19, 1.92)4040/25,955(16%)2.01 (1.82, 2.22) 2419/21,915(11%)1.88 (1.67, 2.12)Data in bold indicates significant findings. Data are n (%) and represent status at index admission to the intermediate care unit. Adjusted hazard ratio (95% CI).Main diagnosis on admission (ICD-10 chapter code), full codes Additional File Tables C1 and C4. aHazard of death in the first 28 days of admission. bHazard ofdeath within 29 to 180 days of admission, which excludes patients that died before 28 days. cHazard of death within 181 to 365 days of admission, which excludespatients that died before 180 days. Abbreviations: ICD-10 International Classification of Diseases 2010, COPD chronic obstructive pulmonary diseaseevidence before the study (Additional file D: Table D1).We extracted the relative risk estimates for the factorsassociated with mortality reported in 11 studies with estimates from our study presented alongside (Additionalfile D: Table D2). The synthesis of the relative risk datainforms factors associated with increasing risk of end oflife encompassing demographic, illness and environmental factors. Our study was unique to identify the maindiagnosis as a key factor for risk of end of life. These‘triggers’ against a background of multimorbidity andfrailty can precipitate marked functional decline and riskof adverse outcome of, for example, death [4]. However,the review findings demonstrate how environmental factors of quality of care and level of skilled care provisionimpacted on mortality. Lower regulatory rating of qualityof care was associated with higher hazard ratios compared with top quality rating of care (1 star quality rating1.15 aHR [1.11–1.20] ref. 5 star quality rating) [21].Similarly, improved survival was associated with a higherstaff
diagnosis of a non-cancer condition and cancer. Data analysis used Kaplan-Meier curves to explore mortality differences between the groups and a time-dependant Cox proportional hazards model to determine mortality risk factors. Results: The cohort comprised 76,704 adults with median age 81years (IQR 70-88) admitted to 220 intermediate