Transcription
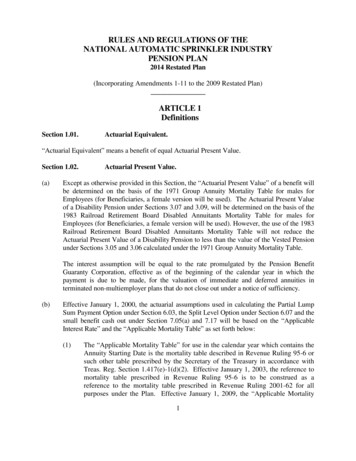
Volume 20, No. 41988The History of Actuarial Mortality Tables in the United StatesThe History of Actuarial Mortality Tablesin the United StatesEdwin C. Hustead, F.S.A.Senior Vice PresidentHay/Huggins CompanyWashington, DCThis paper is taken from a larger study of the history of mortality, and mortality tables, that will be published in conjunction with the commemoration of the 100th anniversaryof the founding of the actuarial profession in America. Thepaper focusses on the principal mortality tables used in Statelaws setting safe levels for insurance and annuity reserves.Many other tables are used by insurers to determinepremiums or to measure the expected mortality for theirpolicies. A set of ’ oasic" tables is commonly used to measurethe underlying mortality of a statutory table in determiningwhether or not specific experience is substandard.Different mortality tables are now used for various segmentsof the insurance industry. Current tables include the Commissioners 1980 Standard Ordinary Mortality Table (1980CSO) for individual life insurance, the Commissioners 1960Standard Group Mortality Table (1960 CSG) for group lifeinsurance, the 1983 Table A for individual annuities, the 1983Group Annuity Mortality Table (1983 GAM) for insured pensions, and the UP-1984 table for uninsured pensions.Chart I shows the genealogy of the principal tables developedfrom mortality experience in the United States and in useduring the hundred year history of the actuarial professionin the United States.Chart 1Year Publishedprincipal United StatesInsurance Company Mortality Tables1865American icanMen1925 --CombinedAnnuityCammack1937SA1941CSO1941SI1945 -19511958CSO1960CSG19651971GAM1971IAM1980CSO198 1985 -AnnuityGroupIJIndividualInsuranceGroup I IndustrialILine of Business1961Sl
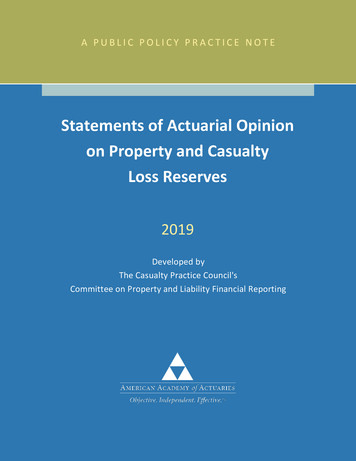
Journal of Insurance MedicineThe earliest tables were used for all forms of insurance.However major segments of the industry soon realized thatgeneral mortality tables were not adequate for their specificlines of business. The first split was between insurance andannuity tables with McClintock’s Annuitants’ Table published in 1899. Another split occurred with the first industrialinsurance table in 1906. A third early split, not shown onthe chart, was a table for Fraternal Society policies in 1898.Both the insurance and annuity families of tables later splitto produce separate tables for individual and group business.The first group insurance tables were Cammack’s tablespublished in 1927. Group annuity tables became a separateline beginning in 1951 and then split again in 1979 betweentables for insured and uninsured pensions.Margins in Mortality TablesMortality tables for a specific line of insurance or annuitiesare usually developed by analyzing experience on policiesfrom that line. A common requirement of statutory mortality tables is that they contain a margin for safety. Marginsmask the actual experience and are applied differently forinsurance and annuities. Therefore, it is important for theuser of the table to understand how and why the marginswere applied.Volume 20, No. 41988Insurance TablesWhen the Actuarial Society of America was founded in 1889,British tables were still used extensively by actuaries in theUnited States. The grandfather of insurance mortality tablesdeveloped in the United States is the American Experiencetable which well deserves its position at the head of ChartI. There had been other mortality tables developed in theUnited States -- the first was produced by ProfessorWigglesworth in 1789 -- but the American Experience is thefirst table based on insurance experience and widely usedby the industry.The American Experience Table holds several unique positions in the history of mortality tables. It was the first widelyused table based on life insurance mortality experience inthe United States. In its early years, it was the mortality basisfor all lines of insurance and annuities. Perhaps mostChart 2Benefits to 1.000 PolicyholdersExpected Deaths 50Actual Deaths 45Insurance ( 100.000 benefit eachlA safety margin works in opposite directions for insuranceand annuities. If, for example, fewer policyholders die thanpredicted by the table used to set premiums, the insuranceplan will have a gain but the annuity plan will have a loss.Chart II illustrates why different approaches are taken toprovide a safety margin for annuities and life insurance. Ifthe mortality table predicts that 50 out of 1,000 policyholderswill die during a year, but only 45 of 1,000 die, an insuranceline will show a ten percent gain. However, an annuity linewill show a loss since there are more policyholders alive and,therefore receiving annuities, than expected.One result of the difference in safety margins is that thesecular improvement in mortality that has occurred in thelast century has very different implications for insurance andannuity lines of business. Margins for insurance policies willdevelop or increase as mortality improves. On the otherhand, even if there is a margin for safety in an annuity table,that margin will gradually disappear as mortality improves.The effect of the improvement in mortality has led to different approaches by actuaries who develop mortality tablesfor insurance and annuities. Insurance tables are usuallytaken directly from recent experience with a margin addedto permit the table to safely cover random fluctuations inmortality. Annuity tables are updated more frequently andthe tables are accompanied by recommended projection factors to anticipate future improvements in mortality. Thesesteps are in addition to the application of a safety marginby reducing the mortality rates.Expected Benefit 5,000,000Actual Benefit Gain4,500,000 500,000Annuity ( 10.000 annual oayment each)Expected Benefit 9,500,000Actual Benefit Loss9,550,000 50,000remarkably, the American Experience table was used as theprimary statutory table for individual insurance policiesfrom its introduction in 1868 until it was replaced as thestatutory table by the 1941 CSO table beginning in 1948.Since policies issued under the American Experience basiscontinued to be valued on that basis after 1948, theAmerican Experience table was actually used for more thana century.Despite the unique position of the" American ExperienceTable, less is known about its construction than about anyother table on Chart I. The table was the work of one man,Sheppard Homans, based on mortality experience of theMutual Life Insurance Company of New York. Most of whatis known about the table comes from comments by Homansas an extended toast after the first dinner of the ActuarialSociety of America at the Astor Hotel in New York on April25, 1889.
Volume 20, No. 41 !788The History of Actuarial Mortal/t}/ Tables in the United StatesJames S. Elston, in his 1932 study of the Sources andCharacteristics of the Principal Mortality Tables, stated thatthe table was based on the experience of the Mutual from1843 to 1860 and that Homans probably added a safetymargin since he did state that he removed the effect ofmedical selection. Homans did not use the name "AmericanExperience" but the name later became attached to the tablethrough general use.The next table for general insurance, produced in 1918, wasthe American Men table based on experience of 59 life insurance companies between 1900 and 1914. The male tableproduced by removing the first five policy years of experience (the period when medical "selection" would reducemortality) was widely used as the AMIs table.The American Men table never became as widely used asthe old faithful American Experience table and the latter remained enshrined in most State laws. As the AmericanExperience table became more out-of-date, and more conservative with improvements in mortality, there was increasing public criticism of the insurance industry’s use of thattable. One view was that the use of such an old table leadto "unconscionable profits" by the industry.The State Insurance Commissioners, while not agreeing withthe public criticism, did believe that there should be a newstatutory table and asked the actuarial profession to developa such a table. The result was the Commissioners 1941 Standard Ordinary Mortality (1941 CSO) table which was thefirst in a series of "CSO" tables.The 1941 CSO table was based on the experience of sixteenprinciple life insurance companies in the United States andCanada from their policies between 1931 and 1940. The tablewas graduated and loaded to provide a table with smoothrates that had a margin for safety. The 1941 CSO table wasaccompanied by a "basic" table with the margins removedso that insurers could measure their own experience againstthe actual experience of the sixteen companies.The next in the series was the Commissioners 1958 Standard Ordinary Mortality Table (1958 CSO-. The 1958 CSO,and the accompanying basic table, were derived from insurance company experience between 1950 and 1954 byadding margins and graduation.The 1958 CSO was followed by the 1980 CSO, and basictable, based on 1970 through 1975 insurance company experience. This table has been used as the valuation standardsince 1981. Unlike the 1958 table, the 1980 table includedpolicies issued on a nonmedical basis since it was becomingless and less common to use medical underwriting.The first tables developed for specific use for group insurancewere the Cammack Mortality Tables based on the experienceof six companies for 1913 to 1926. One table provided ratesbased on general experience and the other on the experienceof "clerical" employees. The latter was used extensively asthe Cammack Clerical table. The current group table is the1960 CSG which was constructed from insurance companyexperience between 1950 and 1958.Annuity TablesA distinct family of mortality tables has been used for annuities since 1899. The first annuity table, McClintock’stable, was based on experience of fifteen American companies on their annuity policies before 1892. The next tablein general use was the American Annuitant table derivedfrom experience of twenty American companies through1918.The next in the series was the 1937 Standard Annuity table.The 1937 Standard Annuity table was not, however, basedon a new study of mortality. The table was largely basedon a two-year set back of the American Annuitants tableat the older ages.In 1949, two predecessor organizations merged to from theSociety of Actuaries. Volume I of the Transactions of thenew Society included a paper by Wilmer Jenkins and EdwardLew presenting the 1949 Standard Annuity table (a-1949).The a-1949 table was the first to be presented as a "basis"table that actuaries should build on by projecting experienceto a year that would represent the average mortality ofannuitants.The next individual annuity table was the 1955 AmericanAnnuity table. The table was derived from experience underindividual annuity contracts between 1948 and 1953. Thiswas followed by the 1971 Individual Annuity Mortality (71IAM) Table. The current table in this series is the 1983 TableA based on 1971 to 1976 annuity experience.Since much of the annuity business in the United States isfor group annuities issued for pension plans, there was anearly interest in separate group annuity tables.The first such table was the Combined Annuity table createdby blending Cammack’s Clerical Mortality table at theyounger ages with the American Annuitant’s Table at theolder ages. However, the Combined and 1937 Standard Annuity tables were used for both group and individual business.Distinct series of group and individual annuity tables beganin the early 1950s. The a-1949 table for individual policieswas quickly followed by the Group Annuity Table for 1951(Ga-1951) for group annuity mortality. Both the 1971 and1983 individual tables had a group counterpart in the 1971Group Annuity Mortality Table (1971 GAM) and the 1983GAM.The group annuity tables split into two branches in 1979with the publication of the first table based on uninsuredpensioner experience. The first in what may become a seriesof tables is the UP-1984 table produced from experience oflarge uninsured pension plans. The U stands for Unisex sincethe tablef does not split male and female mortality and theP stands for Pension. The table was published in 1975 butprojected to 1984.
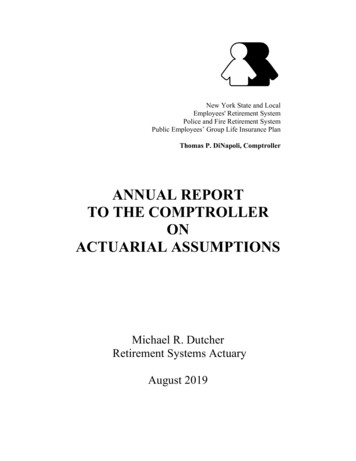
Journal of Insurance MedicineVolume 20, No. 4Industrial InsuranceOther families of tables have been developed to measure andvalue the mortality for specific lines of business. One typeof table that was once very important is for industrial insurance. Industrial insurance experienced higher mortalitythan standard life insurance because there was no medicalselection and the policies were written for people with lowerincomes than the incomes of the typical standard life insurance policyholder.The first Standard Industrial Mortality Table was based onthe experience of the Metropolitan Life Insurance Companybetween 1896 and 1905. The table was adopted as the standard for New York State in 1907. Successor tables were the1941 Standard Industrial table and the 1961 Standard Industrial Table, both based on Metropolitan experience.Comparison of MortalityChart III compares the remaining life expectancy at age 20as measured by the United States Census to the lifeI 88expectancy measured by some of the principal mortalitytables. Life expectancy at age 20 is used since insurance tablesare constructed to show the mortality of adults. Where thereare separate tables, the male experience is shown since thathas been the primary focus of life insurance mortality tables.The U.S. Census data are for White Males since that is themost comparable historical series.The decennial census results show the secular increase inmortality in this century. The average white male reachingage 20 in 1900 could have expected to survive 42.2 years.By 1980, his remaining life expectancy had increased to 52.5years. The chart shows continual improvement in mortality between the decennial censuses. A year-to-year comparison would show continual improvement in almost allyears but there was a significant drop in life expectancy in1918 as a result of the influenza epidemic. The full set oflife expectancies by year can be found on page 13 of Actuarial Study No. 102 of the Social Security Administrationby Alice Wade.Chart 3Expectation of Life After 20 for Males6O IAM55 Stan Anni. i CSOJfO 50 Lex rnb 454O’1900I1920’I1940’I1960’I1980U.S. PopulationYearLife InsuranceAnnuities15m
Volume 20, No. 41988The History of Actuarial Mortality Tables in the United StatesBoth insurance and annuity tables reflect the improvementin mortality. The statutory insurance tables produce lifeexpectancies that are about equal to those of the U.S. censuswhile the annuity tables show significantly higher life expectancies. The differences between the three types ofmortality table are largely explained by the use of marginsin the insurance and annuity tables. Insurance companymortality is lower than that of the general population sounloaded tables would show a longer life expectancy.However, the increase in the mortality rates to provide amargin brings these tables close to the average mortality.On the other hand, the mortality of annuitants is better thanthat of the general population but the difference is exaggerated by the reduction in the mortality rates used to provide a margin in these tables.The Future of MortalityUnderwriters of insurance and annuities will continue to produce new tables as long as mortality continues to improve.Mortality has improved almost continuously for the last 200years and most observers expect mortality to improve in thenear future. There are, however, differing views as to howlong the improvement will continue.Shigekazu Hishinuma studied all of the old mortality experience he could find for a paper presented to the Instituteof Actuaries of Japan. He decided that there had been littleimprovement in life expectancy from the Bronze Age untilthe advances in health care and hygiene beginning in the 18thcentury. The life expectancy at age 20 ranged between 20and 30 years from the Bronze age to the Middle Ages. Bythe late 18th century, the life expectancy at 20 had increasedto 35 years and by 1900 it had improved to 42 years. Thus,after a long period with little or no improvement, life expectancy after age 20 increased five years in the 18th century, seven years in the 19th century, and ten years in thefirst 80 years of this century.Hishinuma noted that the highest expectation of life in theearly 1970s was 72 years for males and 78 years for femalesin Sweden. He projected improvements in mortality due tovarious diseases and estimated that the longest life expectancy would be 77.4 years for males and 81.7 years forfemales. He assumed that there would be an end to significant improvements in mortality by the time these expectancies were reached.Wade observed that the life expectancy in the United Stateswas 71.5 years for males and 78.5 years for females in 1987.She also examined mortality by disease to predict a maximum life expectancy under the Social Security actuaries’most "’pessimistic" assumptions of 83.6 years for males and90.1 years for females in the year 2080. From the point ofview of the Social Security system, improvements in mortality are pessimistic assumptions. The Social Security actuaries’ moderate assumptions predict a life span of 78.2years for males and 84.9 for females. Unlike Hishinuma,however, Social Security actuaries assume that mortality willcontinue to improve after that time.BibliographyMuch of the information in this paper is based on or derived from an important series of studies by the Tillinghast Company. The latest study, Principal Mortality Tables Old and New, was published in 1987 by Tillinghast,A Towers Perrin Company, in Atlanta. The Tillinghast study contains complete tables of mortality and life expectancy, and a brief description, of mostof the tables referred to in this paper. Information on the older tables waslargely drawn from Sources and Characteristics of the Principal MortalityTables, by James S. Elston -- Second Edition, published 1932 in New Yorkby The Actuarial Society of America. Other sources used in the paper are:Homans, Sheppard, speech before the Actuarial Society of America, Transactions of the Actuarial Society of America (TASA) Vol I (1889-90), page 33Jenkins, Wilmer A. and Lew, Edward A., New Mortality Table for Annuities,TSA I (1949), page 369 ffKineke, Frank D. -- A New Annuity Mortality Table -- TASA XXXIX (1938)pg. 8Peterson, Ray M. -- Group Annuity Mortality -- TSA IV (1952), pg 246 Cammack, E. E., Mortality Tables Constructed Upon the Experience underGroup Policies, TASA XXVII (1927) pg. 247 ffThompson, John, The Commissioners 1941 Standard Ordinary MortalityTable, TASA XLII (1941), page 314Craig, J.D. - Discussion of E. E. Cammack’s 1927 paper, TASA XXIX (1928),page 247 Wade, Alice -- Social Security Area Population Projections 1988 ActuarialStudy No. 102, Social Security Administration, 1988SSA Pub No. 11-11549Fellers, William W. and Jackson, Paul H., Noninsured Pensioner Mortality,Proceedings of the Conference of Actuaries in Public Practice, XXV, 456Wattenberg, Ben J., The Statistical History of the United States -- FromColonial Times to the Present, Basic Books, Inc, New York, 1976Hishinuma, Shigekazu -- Historical Review of the Longevity of the HumanBeings -- Unpublished paper presented to the Institute of Actuaries of JapanReport of the Special Committee to Recommend New Mortality Tables forValuation, TSA XXXIII (1981), page 617 ff
the tables are accompanied by recommended projection fac-tors to anticipate future improvements in mortality. These steps are in addition to the application of a safety margin by reducing the mortality rates. Insurance Tables When the Actuarial Society of America was founded in 1889, British tables were still used extensively by actuaries in .