Transcription
Part 4: MEASURING CONTAMINANT CONCENTRATIONS IN SOILThe Soil Screening Guidance includes a sampling strategy for implementing the soil screening process.Section 4.1 presents the sampling approach for surface soils. This approach provides a simpledecision rule based on comparing the maximum contaminant concentrations of composite sampleswith surface soil screening levels (the Max test) to determine whether further investigation is neededfor a particular exposure area (EA). In addition, this section presents a more complex strategy (theChen test) that allows the user to design a site-specific quantitative sampling strategy by varyingdecision error limits and soil contaminant variability to optimize the number of samples andcomposites. Section 4.2 provides a subsurface soil sampling strategy for developing SSLs and applyingthe screening procedure for the volatilization and migration to ground water exposure pathways.Section 4.3 describes the technical details behind the development of the SSL sampling strategy,including analyses and response to public and peer-review comments received on the December 1994draft guidance.The sampling strategy for the soil screening process is designed to achieve the following objectives: Estimate mean concentrations of contaminants of concern forcomparison with SSLs Fill in the data gaps in the conceptual site model necessary to developSSLs.The soils of interest for the first objective differ according to the exposure pathway being addressed.For the direct ingestion, dermal, and fugitive dust pathways, EPA is concerned about surface soils.The sampling goal is to determine average contaminant concentrations of surface soils in exposureareas of concern. For inhalation of volatiles, migration to ground water and, in some cases, plantuptake, subsurface soils are the primary concern. For these pathways, the average contaminantconcentration through each source is the parameter of interest.The second objective (filling in the data gaps) applies primarily to the inhalation and migration toground water pathways. For these pathways, the source area and depth as well as average soilproperties within the source are needed to calculate the pathway-specific SSLs. Therefore, thesampling strategy needs to address collection of these site-specific data.Because of the difference in objectives, the sampling strategies for the ingestion pathway and for theinhalation and migration to ground water pathways are addressed separately. If both surface andsubsurface soils are a concern, then surface soils should be sampled first because the results of surfacesoil analyses may help delineate source areas to target for subsurface sampling.At some sites, a third sampling objective may be appropriate. As discussed in the Soil ScreeningGuidance, SSLs may not be useful at sites where background contaminant levels are above the SSLs.Where sampling information suggests that background contaminant concentrations may be aconcern, background sampling may be necessary. Methods for Evaluating the Attainment of CleanupStandards - Volume 3: Reference-Based Standards for Soil and Solid Media (U.S. EPA, 1994e)provides further information on sampling soils to determine background conditions at a site.81
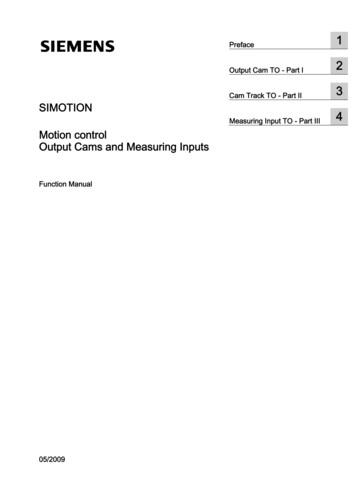
In order to accurately represent contaminant distributions at a site, EPA used the Data QualityObjectives (DQO) process (Figure 4) to develop a sampling strategy that will satisfy Superfundprogram objectives. The DQO process is a systematic data collection planning process developed byEPA to ensure that the right type, quality, and quantity of data are collected to support EPA decisionmaking. As shown in Sections 4.1.1 through 4.1.6, most of the key outputs of the DQO processalready have been developed as part of the Soil Screening Guidance. The DQO activities addressed inthis section are described in detail in the Data Quality Objectives for Superfund: Interim FinalGuidance (U.S. EPA, 1993b) and the Guidance for the Data Quality Objectives Process (U.S. EPA,1994c). Refer to these documents for more information on how to complete each DQO activity orhow to develop other, site-specific sampling strategies.4.1State the ProblemIdentify the DecisionIdentify Inputs to the DecisionDefine the Study BoundariesDevelop a Decision RuleSpecify Limits on DecisionErrorsOptimize the Design for ObtainingDataSampling Surface SoilsA sampling strategy for surface soils is presented in this section,organized by the steps of the DQO process. The first five stepsof this process, from defining the problem through developingthe basic decision rule, are summarized in Table 21, and aredescribed in detail in the first five subsections. The details ofthe two remaining steps of the DQO process, specifying limitson decision errors and optimizing the design, have beendeveloped separately for two alternative hypothesis testingprocedures (the Max test and the Chen method) and arepresented in four (4.1.6, 4.1.7, 4.1.9, and 4.1.10) subsections.In addition, a data quality assessment (DQA) follows the DQOprocess step for optimizing the design. The DQA ensures thatsite-specific error limits are achieved. Sections 4.1.8 and 4.1.11describe the DQA for the Max and Chen tests, respectively.The technical details behind the development of the surface soilsampling design strategy are explained in Section 4.3.4.1.1 State the Problem. In screening, the problem isto identify the contaminants and exposure areas (EAs) that donot pose significant risk to human health so that futureinvestigations can be focused on the areas and contaminants ofconcern at a site.The main site-specific activities involved in this first step ofthe DQO process include identifying the data collectionplanning team (including technical experts and keystakeholders) and specifying the available resources. The list of technical experts and stakeholdersshould contain all key personnel who are involved with applying the Soil Screening Guidance at thesite. Other activities in this step include developing the conceptual site model (CSM), identifyingexposure scenarios, and preparing a summary description of the surface soil contamination problem.The User’s Guide (U.S. EPA, 1996) describes these activities in with more detail.Figure 4. The Data QualityObjectives process.4.1.2Identify the Decision. The decision is to determine whether the mean surface soilconcentrations exceed surface soil screening levels for specific contaminants within EAs. If so, theEA must be investigated further. If not, no further action is necessary under CERCLA for the specificcontaminants in the surface soils of those EAs.82
Table 21. Sampling Soil Screening DQOs for Surface SoilsDQO Process StepsSoil Screening Inputs/OutputsState the ProblemIdentify scoping teamDevelop conceptual site model (CSM)Define exposure scenariosSpecify available resourcesWrite brief summary of contaminationproblemSite manager and technical experts (e.g., toxicologists, risk assessors,statisticians, soil scientists)CSM development (described in Step 1 of the User’s Guide, U.S. EPA, 1996)Direct ingestion and inhalation of fugitive particulates in a residential setting;dermal contact and plant uptake for certain contaminantsSampling and analysis budget, scheduling constraints, and availablepersonnelSummary of the surface soil contamination problem to be investigated at thesiteIdentify the DecisionIdentify decisionIdentify alternative actionsDo mean soil concentrations for particular contaminants (e.g., contaminants ofpotential concern) exceed appropriate screening levels?Eliminate area from further study under CERCLAorPlan and conduct further investigationIdentify Inputs to the DecisionIdentify inputsDefine basis for screeningIdentify analytical methodsIngestion and particulate inhalation SSLs for specified contaminantsMeasurements of surface soil contaminant concentrationSoil Screening GuidanceFeasible analytical methods (both field and laboratory) consistent withprogram-level requirementsDefine the Study BoundariesDefine geographic areas of fieldinvestigationDefine population of interestDivide site into strataDefine scale of decision makingDefine temporal boundaries of studyIdentify practical constraintsThe entire NPL site (which may include areas beyond facility boundaries),except for any areas with clear evidence that no contamination has occurredSurface soils (usually the top 2 centimeters, but may be deeper whereactivities could redistribute subsurface soils to the surface)Strata may be defined so that contaminant concentrations are likely to berelatively homogeneous within each stratum based on the CSM and fieldmeasurementsExposure areas (EAs) no larger than 0.5 acre each (based on residential landuse)Temporal constraints on scheduling field visitsPotential impediments to sample collection, such as access, health, andsafety issuesDevelop a Decision RuleSpecify parameter of interestSpecify screening levelSpecify "if., then." decision rule“True mean” (µ) individual contaminant concentration in each EA. (since thedetermination of the “true mean” would require the collection and analysis ofmany samples, the “Max Test” uses another sample statistic, the maximumcomposite concentration).Screening levels calculated using available parameters and site data (orgeneric SSLs if site data are unavailable).If the “true mean” EA concentration exceeds the screening level, theninvestigate the EA further. If the “true mean” is less than the screeninglevel, then no further investigation of the EA is required under CERCLA.83
4.1.3IdentifyInputstotheDecision. This step of the DQO process requiresidentifying the inputs to the decision process, including the basis for further investigation and theapplicable analytical methods. The inputs for deciding whether to investigate further are theingestion, dermal, and fugitive dust inhalation SSLs calculated for the site contaminants as describedin Part 2 of this document, and the surface soil concentration measurements for those samecontaminants. Therefore, the remaining task is to identify Contract Laboratory Program (CLP)methods and/or field methods for which the quantitation limits (QLs) are less than the SSLs. EPArecommends the use of field methods, such as soil gas surveys, immunoassays, or X-ray fluorescence,where applicable and appropriate as long as quantitation limits are below the SSLs. At least 10percent of field samples should be split and sent to a CLP laboratory for confirmatory analysis (U.S.EPA, 1993d).Define the Study Boundaries. This step of the DQO process defines the samplepopulation of interest, subdivides the site into appropriate exposure areas, and specifies temporal orpractical constraints on the data collection. The description of the population of interest mustinclude the surface soil depth.4.1.4SamplingDepth. When measuring soil contamination levels at the surface for the ingestionand inhalation pathways, the top 2 centimeters is usually considered surface soil, as defined by UrbanSoil Lead Abatement Project (U.S. EPA 1993f). However, additional sampling beyond this depthmay be appropriate for surface soils under a future residential use scenario in areas where major soildisturbances can reasonably be expected as a result of landscaping, gardening, or constructionactivities. In this situation, contaminants that were at depth can be moved to the surface. Thus, it isimportant to be cognizant of local residential construction practices when determining the depth ofsurface soil sampling and to weigh the likelihood of that area being developed.the Site. This step involves dividing the site into areas or strata depending onthe likelihood of contamination and identifying areas with similar contaminant patterns. Thesedivisions can be based on process knowledge, operational units, historical records, and/or priorsampling. Partitioning the site into such areas and strata can lead to a more efficient sampling designfor the entire site.SubdividingFor example, the site manager may have documentation that large areas of the site are unlikely tohave been used for waste disposal activities. These areas would be expected to exhibit relatively lowvariability and the sampling design could involve a relatively small number of samples. The greatestintensity of sampling effort would be expected to focus on areas of the site where there is greateruncertainty or greater variability associated with contamination patterns. When relatively largevariability in contaminant concentrations is expected, more samples are required to determine withconfidence whether the EA should be screened out or investigated further.Initially, the site may be partitioned into three types of areas:1.2.3.Areas that are not likely to be contaminatedAreas that are known to be highly contaminatedAreas that are suspected to be contaminated and cannot be ruled out.Areas that are not likely to be contaminated generally will not require further investigation if thisassumption is based on historical site use information or other site data that are reasonably completeand accurate. (However, the site manager may also want take a few samples to confirm thisassumption). These may be parts of the site that are within the legal boundaries of the property but84
were completely undisturbed by hazardous-waste-generating activities. All other areas needinvestigation.Areas that are known to be highly contaminated (i.e., sources) are targeted for subsurface sampling.The information collected on source area and depth is used to calculate site-specific SSLs for theinhalation and migration to ground water pathways (see Section 4.2 for more information).Areas that are suspected to be contaminated (and cannot be ruled out for screening) are the primarysubjects of the surface soil investigation. If a geostatistician is available, a geostatistical model may beused to characterize these areas (e.g., kriging model). However, guidance for this type of design isbeyond the scope of the current guidance (see Chapter 10 of U.S. EPA, 1989a).DefiningExposureAreas. After the site has been partitioned into relatively homogeneousareas, each region that is targeted for surface soil sampling is then subdivided into EAs. An EA isdefined as that geographical area in which an individual may be exposed to contamination over time.Because the SSLs were developed for a residential scenario, EPA assumes the EA is a suburbanresidential lot corresponding to 0.5 acre. For soil screening purposes, each EA should be 0.5 acre orless. To the extent possible, EAs should be constructed as square or rectangular areas that can besubdivided into squares to facilitate compositing and grid sampling. If the site is currently residential,then the EA should be the actual residential lot size. The exposure areas should not be laid out in sucha way that they unnecessarily combine areas of high and low levels of contamination. Theorientation and exact location of the EA, relative to the distribution of the contaminant in the soil,can lead to instances where sampling of the EA may lead to results above the mean, and otherinstances, to results below the mean. Try to avoid straddling contaminant “distribution units” withinthe 0.5 acre EA.The sampling strategy for surface soils allows investigators to determine mean soil contaminantconcentration across an EA of interest. An arithmetic mean concentration for an EA best representsthe exposure to site contaminants over a long period of time. For risk assessment purposes, anindividual is assumed to move randomly across an EA over time, spending equivalent amounts oftime in each location. Since reliable information about specific patterns of nonrandom activity forfuture use scenarios is not available, random exposure appears to be the most reasonable assumptionfor a residential exposure scenario. Therefore, spatially averaged surface soil concentrations are usedto estimate mean exposure concentrations.Because all the EAs within a given stratum should exhibit similar contaminant concentrations, onesite-specific sampling design can be developed for all EAs within that stratum. As discussed above,some strata may have relatively low variability and other strata may have relatively high variability.Consequently, a different sampling design may be necessary for each stratum, based upon thestratum-specific estimate of the contaminant variability.4.1.5Develop a Decision Rule. Ideally, the decision rule for surface soils is:If the mean contaminant concentration within an EA exceeds the screening level,then investigate that EA further.This "screening level" is the actual numerical value used to compare against the site contaminationdata. It may be identical to the SSL, or it may be a multiple of the SSL (e.g., 2 SSL) for a hypothesistest designed to achieve specified decision error rates in a specified region above and below the SSL.In addition, another sample statistic (e.g., the maximum concentration) may be used as an estimateof the mean for comparison with the "screening level."85
4.1.6Specify Limits on Decision Errors for the Max Test. Sampling data will beused to support a decision about whether an EA requires further investigation. Because of variabilityin contaminant concentrations within an EA, practical constraints on sample sizes, and sampling ormeasurement error, the data collected may be inaccurate or nonrepresentative and may mislead thedecision maker into making an incorrect decision. A decision error occurs when sampling datamislead the decision maker into choosing a course of action that is different from or less desirablethan the course of action that would have been chosen with perfect information (i.e., with noconstraints on sample size and no measurement error).EPA recognizes that data obtained from sampling and analysis are never perfectly representative andaccurate, and that the costs of trying to achieve near-perfect results can outweigh the benefits.Consequently, EPA acknowledges that uncertainty in data must be tolerated to some degree. TheDQO process controls the degree to which uncertainty in data affects the outcomes of decisions thatare based on those data. This step of the DQO process allows the decision maker to set limits on theprobabilities of making an incorrect decision.The DQO process utilizes hypothesis tests to control decision errors. When performing a hypothesistest, a presumed or baseline condition, referred to as the "null hypothesis" (H o), is established. Thisbaseline condition is presumed to be true unless the data conclusively demonstrate otherwise, which iscalled "rejecting the null hypothesis" in favor of an alternative hypothesis. For the Soil ScreeningGuidance, the baseline condition, or Ho, is that the site needs further investigation.When the hypothesis test is performed, two possible decision errors may occur:1.Decide not to investigate an EA further (i.e., "walk away") when the correct decision(with complete and perfect information) would be to "investigate further"2.Decide to investigate further when the correct decision would be to "walk away."Since the site is on the NPL, site areas are presumed to need further investigation. Therefore, thedata must provide clear evidence that it would be acceptable to "walk away." This presumptionprovides the basis for classifying the two types of decision errors. The "incorrectly walk away"decision error is designated as the Type I decision error because one has incorrectly rejected thebaseline condition (null hypothesis). Correspondingly, the "unnecessarily investigate further"decision error is designated as the Type II decision error.To complete the specification of limits on decision errors, Type I and Type II decision errorprobability limits must be defined in relation to the SSL. First a "gray region" is specified with respectto the mean contaminant concentration within an EA. The gray region represents the range ofcontaminant levels near the SSL, where uncertainty in the data (i.e., the variability) can make thedecision "too close to call." In other words, when the average of the data values is very close to theSSL, it would be too expensive to generate a data set of sufficient size and precision to resolve whatthe correct determination should be. (i.e., Does the average concentration fall "above" or "below"the SSL?)The Soil Screening Guidance establishes a default range for the width and location of the "grayregion": from one-half the SSL (0.5 SSL) to two times the SSL (2 SSL). By specifying the upper edgeof the gray region as twice the SSL, it is possible that exposure areas with mean values slightly higherthan the SSL may be screened from further study. However, EPA believes that the exposure scenario86
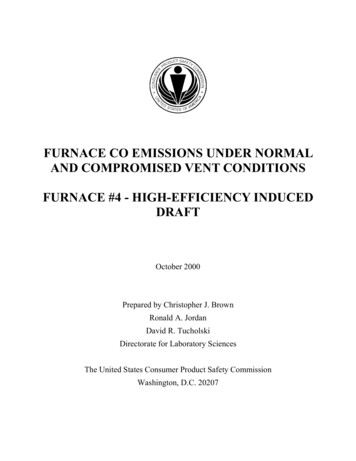
and assumptions used to derive SSLs are sufficiently conservative to be protective in such cases.On the lower side of the gray region, the consequences of decision errors at one-half the SSL areprimarily financial. If the lower edge of the gray region were to be moved closer to the SSL, thenmore exposure areas that were truly below the SSL would be screened out, but more money would bespent on sampling to make this determination. If the lower edge of the gray region were to be movedcloser to zero, then less money could be spent on sampling, but fewer EAs that were truly below theSSLs would be screened out, leading to unnecessary investigation of EAs. The Superfund programchose the gray region to be one-half to two times the SSL after investigating several different ranges.This range for the gray region represents a balance between the costs of collecting and analyzing soilsamples and making incorrect decisions. While it is desirable to estimate exactly the exposure areamean, the number of samples required are much more than project managers are generally willing tocollect in a "screening" effort. Although some exposure areas will have contaminant concentrationsthat are between the SSL and twice the SSL and will be screened out, human health will still beprotected given the conservative assumptions used to derive the SSLs.The Soil Screening Guidance establishes the following goals for Type I and Type II decision errorrates: Prob ("walk away" when the true EA mean is 2 SSL) 0.05Prob ("investigate further" when the true EA mean is 0.5 SSL) 0.20.This means that there should be no more than a 5 percent chance that the site manager will "walkaway" from an EA where the true mean concentration is 2 SSL or more. In addition, there should beno more than a 20 percent chance that the site manager will unnecessarily investigate an EA whenthe mean is 0.5 SSL or less.These decision error limits are general goals for the soil screening process. Consistent with the DQOprocess, these goals may be adjusted on a site-specific basis by considering the available resources(i.e., time and budget), the importance of screening surface soil relative to other potential exposurepathways, consequences of potential decision errors, and consistency with other relevant EPAguidance and programs.Table 22 summarizes this step of the DQO process for the Max test, specifying limits on the decisionerror rates, and the final step of the DQO process for the Max test, optimizing the design. Figure 5illustrates the gray region for the decision error goals: a Type I decision error rate of 0.05 (5percent) at 2 SSL and a Type II decision error rate of 0.20 (20 percent) at 0.5 SSL.Optimize the Design for the Max Test. This section provides instructions fordeveloping an optimum sampling strategy for screening surface soils. It discusses compositing, theselection of sampling points for composited and uncomposited surface soil sampling, and therecommended procedures for determining the sample sizes necessary to achieve specified limits ondecision errors using the Max test.4.1.787
Table 22. Sampling Soil Screening DQOs for Surface Soils under theMax TestDQO Process StepsSoil Screening Inputs/OutputsSpecify Limits on Decision Errors*Define baseline condition (nullhypothesis)The EA needs further investigationDefine the gray region**From 0.5 SSL to 2 SSLDefine Type I and Type II decision errorsType I error: Do not investigate further ("walk away from") an EA whose truemean exceeds the screening level of 2 SSLType II error: Investigate further when an EA's true mean falls below thescreening level of 0.5 SSLIdentify consequencesType I error: potential public health consequencesType II error: unnecessary expenditure of resources to investigate furtherAssign acceptable probabilities of Type Iand Type II decision errorsGoals:Type I: 0.05 (5%) probability of not investigating further when “true mean” ofthe EA is 2 SSLType II: 0.20 (20%) probability of investigating further when “true mean” ofthe EA is 0.5 SSLDefine QA/QC goalsCLP precision and bias requirements10% CLP analyses for field methodsOptimize the DesignDetermine how to best estimate “truemean” Samples composited across the EA estimate the EA mean (x ). Use maximumcomposite concentration as a conservative estimate of the true EA mean.Determine expected variability of EAsurface soil contaminant concentrationsA conservatively large expected coefficient of variation (CV) from prior datafor the site, field measurements, or data from other comparable sites andexpert judgment. A minimum default CV of 2.5 should be used wheninformation is insufficient to estimate the CV.Design sampling strategy by evaluatingcosts and performance of alternativesLowest cost sampling design option (i.e., compositing scheme and number ofcomposites) that will achieve acceptable decision error ratesDevelop planning documents for the fieldinvestigationSampling and Analysis Plan (SAP)Quality Assurance Project Plan (QAPjP)*Since the DQO process controls the degree to which uncertainty in data affects the outcome of decisions that arebased on that data, specifying limits on decision errors will allow the decision maker to control the probability of makingan incorrect decision when using the DQOs.**The gray region represents the area where the consequences of decision errors are minor (and uncertainty in samplingdata makes decisions too close to call).88
1.01.00.950.90.80.70.60.50.4Gray Region0.3(Relatively LargeDecision Error Ratesare ConsideredTolerable.)0.20.10.9Tolerable Type IDecision ErrorRates0.80.70.6Probability ofDeciding that0.5the MeanExceeds the0.4Screening Level0.3TolerableType IIDecisionErrorRates0.20.1002 H SSL0.5 H SSL SSLTrue Mean Contaminant ConcentrationFigure 5. Design performance goal diagram.Note that the size, shape, and orientation of sampling volume (i.e., “support”) for heterogenousmedia have a significant effect on reported measurement values. For instance, particle size has avarying affect on the transport and fate of contaminants in the environment and on the potentialreceptors. Because comparison of data from methods that are based on different supports can bedifficult, defining the sampling support is important in the early stages of site characterization. Thismay be accomplished through the DQO process with existing knowledge of the site, contamination,and identification of the exposure pathways that need to be characterized. Refer to Preparation ofSoil Sampling Protocols: Sampling Techniques and Strategies (U.S. EPA, 1992f) for moreinformation about soil sampling support.The SAP developed for surface soils should specify sampling and analytical procedures as well as thedevelopment of QA/QC procedures. To identify the appropriate analytical procedures, the screeninglevels must be known. If data are not available to calculate site-specific SSLs, then the generic SSLs inAppendix A should be used.Compositing . Because the objective of surface soil screening is to ensure that the meancontaminant concentration does not exceed the screening level, the physical "averaging" that occursduring compositing is consistent with the intended use of the data. Compositing allows a largernumber of locations to be sampled while controlling analytical costs because several discrete samplesare physically mixed (homogenized) and one or more subsamples are drawn from the mixture andsubmitted for analysis. If the individual samples in each composite are taken across the EA, eachcomposite represents an estimate of the EA mean.A practical constraint to compositing in some situations is the heterogeneity of the soil matrix. The89
efficiency and effectiveness of the mixing process may be hindered when soil particle sizes varywidely or when the soil matrix contains foreign objects, organic matter, viscous fluids, or stickymaterial. Soil samples should not be composited if matrix interference among contaminants is likely(e.g., when the presence of one contaminant biases analytical results for another).Before individual specimens are composited for chemical analysis, the site manager should considerhomogenizing and splitting each specimen. By compositing one portion of each specimen with theother specimens and storing one portion for potential future analysis, the spatial integrity of eachspecimen is maintained. If the concentration of a contaminant in a composite sample is high, thesplits of the individual specimens from which it was composed can be analyzed discretely todetermine which individual specimen(s) have high concentrations of the contaminant. This willpermit the site manager to determine which portion within an EA is contaminated without making arepeat visit to the site.SamplePattern. The Max test should only be applied using composite samples that arerepresentative of the entire EA. However, the Chen test (see Section 4.1.9) can be applied withindividual, uncomposited samples. There are several options for developing a sampling pattern forcompositing that produce samples that should be representative. If individual, uncomposited sampleswill be analyzed for contaminant concentrations, the N sample points can be selected using either (1)simple random sampling (SRS), (2
Specify Limits on Decision Errors Optimize the Design for Obtaining Data Figure 4. The Data Quality Objectives process. 4.1 Sampling Surface Soils A sampling strategy for surface soils is presented in this section, organized by the steps of the DQO process. The first five steps of this process, from defining the problem through developing