Transcription
Sex Disparities in COVID-19 Mortality Vary Across US RacialGroupsTamara Rushovich, M.P.H.1,2 , Marion Boulicault, MPhil3,4, Jarvis T. Chen, Sc.D.2,Ann Caroline Danielsen, MSc., M.P.H.2, Amelia Tarrant5, Sarah S. Richardson, Ph.D.5,6,and Heather Shattuck-Heidorn, Ph.D.71Population Health Sciences Department, Harvard Graduate School of Arts and Sciences, Cambridge, MA, USA; 2Department of Social andBehavioral Sciences, Harvard T.H. Chan School of Public Health, Boston, MA, USA; 3Department of Linguistics and Philosophy, MassachusettsInstitute of Technology, Cambridge, MA, USA; 4Department of Philosophy, University of Adelaide, Adelaide, Australia; 5Studies of Women, Gender,and Sexuality, Harvard University, Cambridge, MA, USA; 6Department of the History of Science, Harvard University, Cambridge, MA, USA; 7Womenand Gender Studies, University of Southern Maine, Portland, Maine, USA.BACKGROUND: Inequities in COVID-19 outcomes in theUSA have been clearly documented for sex and race: menare dying at higher rates than women, and Black individuals are dying at higher rates than white individuals.Unexplored, however, is how sex and race interact inCOVID-19 outcomes.OBJECTIVE: Use available data to characterize COVID19 mortality rates within and between race and sex stratain two US states, with the aim of understanding howapparent sex disparities in COVID-19 deaths vary acrossrace.DESIGN AND PARTICIPANTS: This observational studyuses COVID-19 mortality data through September 21,2020, from Georgia (GA) and Michigan (MI).MAIN MEASURES: We calculate age-specific rates foreach sex-race-age stratum, and age-standardized ratesfor each race-sex stratum. We investigate the sex disparitywithin race groups and the race disparity within sexgroups using age-standardized rate ratios, and ratedifferences.KEY RESULTS: Within race groups, men have a higherCOVID-19 mortality rate than women. Black men havethe highest rate of all race-sex groups (in MI: 254.6,deaths per 100,000, 95% CI: 241.1–268.2, in GA:128.5,95% CI: 121.0-135.9). In MI, the COVID-19 mortality ratefor Black women (147.1, 95% CI: 138.7–155.4) is higherthan the rate for white men (39.1, 95% CI: 37.3–40.9),white women (29.7, 95% CI: 28.3–31.0), and Asian/Pacific Islander men and women. COVID-19 mortalityrates in GA followed the same pattern. In MI, the male:female mortality rate ratio among Black individuals is 1.7(1.5–2.0) while the rate ratio among White individuals isonly 1.3 (1.2–1.5).CONCLUSION: While overall, men have higher COVID-19mortality rates than women, our findings show that thissex disparity does not hold across racial groups. Thisdemonstrates the limitations of unidimensional reportingand analyses and highlights the ways that race and gender intersect to shape COVID-19 outcomes.Prior Presentations No prior presentations givenReceived October 1,2020Accepted March 4, 2021KEY WORDS: COVID-19; health inequities; intersectionality; sex/gender;race/ethnicity.J Gen Intern MedDOI: 10.1007/s11606-021-06699-4 Society of General Internal Medicine 2021INTRODUCTIONAn apparent sex difference in COVID-19 outcomes hasemerged; in many places men are more likely to die thanwomen, though this magnitude varies substantially acrosslocales.1 Racial disparities in COVID-19 outcomes have alsoemerged in the USA.2, 3 Yet, the relationships between sex,race, and COVID-19 outcomes in the USA have been unexplored. Lack of analysis of these relationships is a criticalresearch gap for reasons both applied and theoretical. Ecosocial theory4, as well as Black feminist theory and the relatedframework of intersectionality,5 has long established thatintersecting systems of power and oppression structure riskin diverse ways across and within categorical groups.6 Unidimensional analysis creates a universal “man” who is more atrisk of death from COVID-19 than the corresponding “woman.” In reality, health risks are structured in complex ways thatreflect systemic and broader societal inequities. In this study,we use data from Georgia (GA) and Michigan (MI)—the onlytwo states reporting age-, race- and sex-disaggregatedCOVID-19 mortality data—to analyze interactions betweenrace and sex, with the aim of understanding how apparent sexdisparities in COVID-19 deaths vary across race.MATERIALS AND METHODSWe used publicly available datasets of COVID-19 deaths(accessed on September 21, 2020) from the Georgia Department of Public Health7 and the Michigan Department ofHealth and Human Services.8 State-level data were used because COVID-19 mortality data are not available disaggregated by age, race, and sex at the federal level in the USA. The
JGIM: Sex and Race Interactions in COVID-19 Outcomes2018 bridged-race population estimates (2018 vintage) wereobtained from the Centers for Disease Control and Preventionand used as population denominators in all rate calculations.9Rates are reported per 100,000 people.To account for differences in age distributions across raceand sex groups, we calculated both age-specific and agestandardized COVID-19 mortality rates. Age-specific mortality rates by race and sex were calculated by dividing thenumber of deaths in each age-race-sex stratum by the totalpopulation of that stratum residing in each state.10 Confidenceintervals were calculated using standard methods.11 Directlyage-standardized rates produced using cited methods, including using the 2000 US population as the standard, are particularly useful as they can be compared to reported national andstate age-standardized rates.12To understand how the sex disparity differs across racegroups, the age-standardized mortality rate ratio and rate differences were calculated non-parametrically and compared forMI and for GA. These age-standardized mortality rate ratiosand rate differences were calculated between sex categorieswithin race groups and between race groups within sex categories. Additionally, age-standardized mortality rate ratioswere calculated using a common reference group for differentsex-race comparisons13. Standard errors and confidence intervals for rate ratios and rate differences were calculated usingstandard methods for mortality data.14Categorization of the race, sex, and age variables waslimited by how the data were reported. The following agecategories were used: 0–39 years, 40–49 years, 50–59 years,60–69 years, 70–79 years, and 80 years and older. Ethnicity(e.g., Latinx or Hispanic) was not provided in the data foreither state. The Michigan dataset suppressed cells when thenumber of deaths in a single age-sex-race category was between one and five. Race was categorized as Black, white, orAsian/Pacific Islander (Asian/PI). American Indian and Alaskan Native were not included in the analysis due to smallnumbers. Sex was categorized as male or female. Race, age,or sex categorized as “other” or “unknown” were excludedfrom the analysis. These data and analyses are exempt fromInstitutional Review Board approval review as only publiclyavailable de-identified data were used.Table 1 COVID-19 Mortality by Race, Age, and Sex in Georgia,USAWomenMenCountRate* (95%CI)CountRate* (95%CI)White0–39 years40–49 years21241.3 (0.8, 2.0)5.7 (3.7, 8.5)294450–59 years8315760–69 years20270–79 years41080 years andoverAgestandardizedrateCrude rate91818.8 (15.0,23.3)51.8 (44.9,59.5)156.6 (141.8,172.6)642.9 (602.0,685.8)38.2 (36.3,40.0)1.7 (1.2, 2.5)10.4 (7.5,13.9)35.8 (30.4,41.9)86.8 (77.4,97.1)235.5 (215.8,256.5)792.2 (735.3,852.3)53.2 (50.7,55.7)16581658African American or Black0–39 years5140–49 years8250–59 years13860–69 years30970–79 years31980 years andover466AgestandardizedrateCrude rate13651365309525719178350.9 (48.4,53.4)178355.6 (53.1,58.2)4.8 (3.6, 6.3)32.7 (26.0,40.6)58.2 (48.9,68.8)172.4 (153.7,192.8)364.0 (325.1,406.2)1077.2(981.6,1179.5)84.1 (79.6,88.7)47684.6 (3.4, 6.1)33.4 (25.9,42.3)87.3 (74.7,101.5)270.9 (244.0,299.9)675.7 (611.8,744.4)1544.3(1377.4,1725.8)128.5 (121.0,135.9)171370409311137673.3 (69.5,77.3)137684.0 (79.6,88.6)Asian and Pacific Islander0–39 years040–49 years1––5650–59 years4–1160–69 years111570–79 years1280 years andoverAgestandardizedrateCrude rate1951.7 (25.8,92.5)115.1 (59.4,201.0)455.7 (274.4,711.7)27.6 (19.3,35.9)–16.0 (5.9,34.8)41.0 (20.5,73.4)87.5 (49.0,144.4)294.8 (192.6,431.9)552.8 (327.6,873.7)51.1 (39.3,63.0)474718.6 (13.6,24.7)2618818133.9 (26.9,42.2)*Rate per 100,000–Rates for counts less than or equal to five may be statistically unstableand are not reportedRESULTSMen had consistently higher COVID-19 mortality rates thanwomen within age and race strata (Tables 1 and 2). Forexample, in GA, among individuals aged 70–79 the rateamong white men and white women respectively was 235.5per 100,000 (95% CI: 215.8–256.5) and 156.6 (141.8–172.6);among Black men and Black women was 675.7 (611.8–744.4)and 364.0 (325.1–406.2); and among Asian/PI men andAsian/PI women was 294.8 (192.6–431.9) and 115.1 (59.4–201.0) (Table 1).The direct age-standardized mortality rates for race and sexgroups in GA were 53.2 (95% CI: 50.7–55.7) for white men,38.2 (36.3–40.0) for white women, 128.5 (121.0–135.9) forBlack men, 84.1 (79.6–88.7) for Black women, 51.1 (39.3–63.0) for Asian/PI men, and 27.6 (19.3–35.9) for Asian/PIwomen (Table 1). The MI data showed a similar pattern: 39.1(37.3–40.9) for white men, 29.7 (28.3–31.0) for white women,254.6 (241.1–268.2) for Black men, 147.1 (138.7–155.4) for
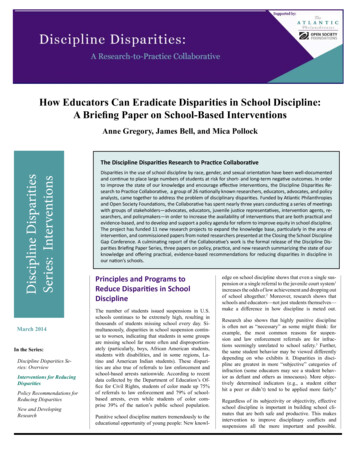
JGIM: Sex and Race Interactions in COVID-19 OutcomesTable 2 COVID-19 Mortality by Race, Age, and Sex in Michigan,USAWomenMenCountRate* (95%CI)CountRate* (95%CI)White0–39 years40–49 years50–59 years172367223813360–69 years19670–79 years41280 years andoverAgestandardizedrateCrude rate11650.9 (0.5, 1.4)4.9 (3.1, 7.3)11.5 (8.9,14.6)35.3 (30.6,40.7)120.5 (109.1,132.7)523.8 (494.2,554.8)29.7 (28.3,31.0)1.1 (0.7, 1.7)8.0 (5.6, 10.9)23.2 (19.5,27.5)61.1 (54.6,68.2)176.3 (161.6,192.0)595.8 (556.1,637.7)39.1 (37.3,40.9)188088046.3 (44.3,48.5)African American or Black0–39 years81.8 (0.8, 3.6)40–49 years5254.0 (40.4,70.9)50–59 years114122.0 (100.6,146.5)60–69 years243294.4 (258.6,333.9)70–79 years334763.9 (684.2,850.4)80 years andover455AgestandardizedrateCrude rate1206Asian and Pacific0–39 years40–49 years50–59 years60–69 years1206Islander00****70–79 years1180 years andoverAgestandardizedrateCrude rate2334343205288351876187647.1 (45.0,49.3)40809.0 (6.5, 12.3)97.3 (77.1,121.0)253.1 (219.4,290.5)571.8 07.4)254.6 (241.1,268.2)2023654411732.3(1576.7,1899.0)147.1 (138.7,155.4)322154.0 (145.4,162.9)1450203.4 (193.1,214.2)––––******14134.8 (67.3,241.2)676.5 (428.8,1015.0)30.5 (20.2,40.8)15–––120.2 (65.7,201.6)236.4 (132.3,389.9)602.6 (344.5,978.6)42.8 (29.9,55.7)18.3 (12.7,25.6)451450164524.9 (18.1,33.3)*Rate per 100,000**Data suppressed due to a cell size between 1 and 5–Rates for counts less than or equal to five may be statistically unstableand are not reportedBlack women, 42.8 (29.9–55.7) for Asian/PI men, and 30.5(20.2–40.8) for Asian/PI women (Fig. 1).The age-standardized COVID-19 mortality rate ratio formen compared to women among Black individuals is 1.7(95% CI: 1.5–2.0) and only 1.32 (1.2–1.5) among whiteindividuals in MI. In GA, the corresponding ratio is 1.5(1.3–1.7) among Black individuals and 1.4 (1.2–1.6) amongwhite individuals. On the additive scale, the rate difference formen compared to women among Black individuals is 107.6(81.2–133.7) and only 9.5 (5.8–13.2) among white individualsin MI. (Table 3). The Black compared to white rate ratioamong men is 6.5 (5.8–7.3) and among women is 5.0 (4.4–5.6) in MI. The equivalent ratio in MI is 2.4 (2.1–2.7) amongmen and 2.2 (2.0–2.5) among women (Table 3).In Michigan, the age standardized COVID-19 mortality rateamong Black women was 5.0 (4.4, 5.6) times the rate amongwhite women, while the rate among white men was only 1.3(1.2, 1.4) times the rate among white women. Additionally, therate among Black women was 4.8 (2.7, 8.4) times the rateamong Asian/PI women while the rate among Asian/PI menwas only 1.4 (0.7, 2.9) times the rate among Asian/PI women.The pattern in Georgia was the same, but the magnitude of theratios was lower (Table 4).DISCUSSIONOur results show that in GA and MI, Black men experience thehighest COVID-19 mortality rates, higher than white men(128.5 compared to 53.2 deaths per 100,000 in GA, 254.6compared to 39.1 in MI), Black women (128.5 compared to84.1 in GA, 254.6 compared to 147.1 in MI), and whitewomen (128.5 compared to 38.2 in GA, 254.6 compared to29.7 in MI). While the data show that men are at higher risk ofCOVID-19 death compared with women across racial/ethnicgroups, and that Black men and women have markedly higherrisk of COVID-19 death compared with White and Asian/PImen and women within gender groups, an intersectional analysis reveals more complex patterns. Thus, our results showthat Black women have a higher mortality rate than both whiteand Asian/PI men as well as white and Asian/PI women.Additionally, the sex disparities in COVID-19 mortality ratesvary dramatically between Black, white, and Asian/PI populations in GA and MI. In MI the COVID-19 mortality rate forBlack men is 170% times the rate for Black women, which issignificantly higher than the equivalent ratio among Whiteindividuals: the rate is only 130% higher for white men compared to white women. In GA, while not significantly different, the rate is 150% higher for Black men compared to Blackwomen, and 140% higher for white men compared to whitewomen. In both states, the gap between the rates for Blackwomen compared to white women is higher than the gapbetween the rates for white men compared to white women.These patterns suggest that it is overly reductive to treat the sexdisparity as a biological feature that is constant across racialgroups. Rather, efforts to explain these disparities must focuson how differential risk of exposure and differential susceptibility to COVID-19 complications are jointly patterned by thegendered and racialized nature of work, housing and livingconditions, comorbidities, and access to care.The magnitude of COVID-19 mortality rates differs in MIand GA. The differences likely reflect a combination of factors, such as timing of the COVID-19 surge, demographics,COVID-19 policies, and other societal factors. Exploring thefactors driving these differences is beyond the scope of thispaper.
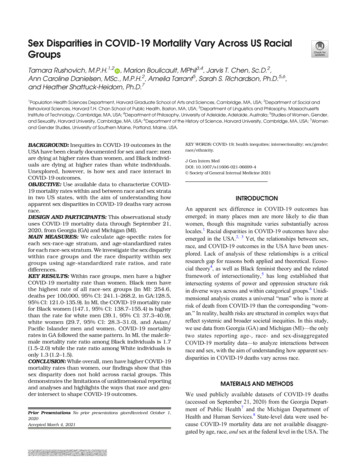
JGIM: Sex and Race Interactions in COVID-19 OutcomesFigure 1 Age-Standardized COVID-19 Mortality Rate by Race and Sex in Georgia and Michigan USA. Asian/PI, Asian or Pacific Islander.Age-standardized rates were calculated using direct standardization and the 2000 US population as the standard.Understanding these patterns, in particular the extremelyhigh death rates of Black men and women, requires consideration of how social factors interact with gender and race toshape COVID-19 disparities. We conceptualize the categoryof race not as indicative of genetic differences, but instead as amarker of historical and ongoing oppression of communitiesand individuals based on racial category.15 Similarly, socialcontext likely plays a critical role in observed sex-differencesin COVID-19 mortality rates.16 The sex-disparity in COVID19 mortality rates varies widely both between US states andbetween countries, and over time.1, 17 Our findings provideadditional confirmation of social-contextual variation inCOVID-19 sex disparities, as the mortality sex disparity differs dramatically across racial groups.When considering how race/racism and gendered socialcontexts impact health, it is important to recognize that thesesocietal factors can have different and complicated relationships to traditional understandings of social power within USsociety. For example, while men are usually considered theprivileged group, it is well-documented that masculinitynorms may nevertheless negatively impact men’s health.18 Inprior coronavirus epidemics, men were consistently less likelyto report adhering to social distancing measures.19 In thecurrent COVID-19 pandemic, men are less likely to reportwearing masks than women and were 1.5 times less likely tobe observed wearing a mask while shopping in a recent large,observational study.20 At least one study has found that selfreport of adherence to masculinity ideals is negatively correlated with mask-wearing for both men and women, thoughmore so for men.21 We did not find studies that simultaneouslyconsidered the effects of race and gender on social distancingor mask wearing, though we note that, in general, Black andHispanic Americans are more likely to report mask wearingthan white Americans.22Likely far more explanatory of the race/sex results observedin this study than individual behaviors and beliefs are structural factors including occupation and access to healthcare.Overall, men comprise 57% of essential workers in the USA,but within categories of essential workers, women compriseover 60% of the workforce in healthcare support, healthcarepractitioners, and personal care and social service essentialjobs, while men comprise over 60% of cleaning and maintenance, production and transportation, protective services, andTable 3 COVID-19 Age-Standardized Mortality Rate Ratios andRate Differences in Michigan and Georgia, ce(CI)Ref1.7 (1.5,2.0)Ref107.6 (81.2,133.7)Ref1.5 (1.3,1.7)Ref44.3 (29.9,58.7)Ref1.4 (1.3,1.6)Ref15.02 (9.9,20.1)Ref1.9 (1.0,3.5)Ref23.5 ( 0.3,47.2)Ref2.4 (2.1,2.7)1.0 (0.7,1.4)Ref75.3 (62.4,88.2) 2.0 ( 22.0,17.8)Ref2.21 (2.0,2.5)0.7 (0.4,1.2)Ref46.0 (37.9,54.1) 10.5 ( 24.5,3.4)RefRef1.3 (1.2,9.5 (5.8, 13.2)1.5)Asian and Pacific IslanderWomenRefRefMen1.4 (0.7,12.3 ( 14.9,2.9)39.4)MenWhiteRefRefBlack6.5 (5.8,215.5 (192.9,7.3)238.0)Asian/1.1 (0.7,3.6 ( 17.9,PI1.8)25.0)WomenWhiteRefRefBlack5.0 (4.4,117.4 (103.4,5.6)131.2)Asian/0 (0.6,0.8 ( 16.3,PI1.8)17.9)
JGIM: Sex and Race Interactions in COVID-19 OutcomesTable 4 COVID-19 Age-Standardized Mortality Rate Ratios and Rate Differences using a Common Race-Sex Reference Group in Michiganand Georgia, USAMichiganGeorgiaRate ratio (CI)Rate diff. (CI)Rate ratio (CI)Rate diff. sian/PI0.8( 16.3,17.9)13.1( 1)90.3(77.7,102.9)Asian/PI 10.5( 24.5,3.4)13( (5.8,13.2)WhiteRef9.5(5.8,13.2)Asian/PIRef12.3( 14.9,39.4)construction essential jobs.23 Preventative testing, use of personal protective equipment (i.e., masks and face shields), andother COVID-19 prevention measures may be enacted andenforced differently in healthcare settings compared to transportation or construction settings, influencing occupationrelated exposure risk. Racial segregation within alreadygender-segregated occupations—for instance the overrepresentation of Black women as nursing assistants and homehealth aides24—further shapes exposure risk. Furthermore, inthe USA, Black workers are disproportionately represented inpublic-facing jobs with increased risk of virus exposure including in healthcare, transportation, and the service industry.25 Mass incarceration, disproportionately impacting Blackmen, worsens overall health and increases risk of contractingCOVID-19 due to high-density detention facilities.26, 27 Similarly, areas with greater racialized economic segregation andcrowded housing have experienced higher COVID-19 mortality rates.2Disparities in COVID-19 mortality replicate welldocumented racial and gender health inequities. In GA, forinstance, Black men have the highest rates of cardiovasculardisease, Black women and white men have relatively similarrates, and white women have the lowest rates.28 Such gender,race, and class health disparities in chronic diseases are widelyunderstood as reflections of historical, structural, and contextual experiences of racism, discrimination, and inequity.29This study has several limitations, largely due to limitationsin the available data. First, at the time of download, GA andMI did not report ethnicity separately from race, makinganalysis of Latinx populations impossible. GA has recentlybegun reporting COVID-mortality by race and ethnicity, butMI still does not. Second, Michigan reported both “probable”and “confirmed” deaths while Georgia only /PIRef23.5( 0.3,47.2)“confirmed,” making the data from MI and GA not fullycommensurable. However, we note that only 3.3% of totalMichigan deaths were “probable”; therefore, the influence ofthe differences in reporting practices between GA and MI islikely relatively small. Lastly, US State COVID-19 surveillance reporting nearly exclusively tracks only the binary ofmale/female for the variable of sex, obscuring the representation of transgender and non-binary individuals who do notidentify as men or women.While we use an intersectional framework to motivatestatistical analysis of how sex/gender and race/ethnicity interact in relation to COVID-19 outcomes, examination of thesedata in relation to variables such as occupation, state-levelpolicies, neighborhood characteristics, and socioeconomic status is required to situate outcomes in intersecting systems ofpower and oppression. Our findings demonstrate the urgentneed for comprehensive federal and state reporting of sociallyrelevant variables in relation to COVID-19 outcomes.30 Suchdata are fundamental to multi-dimensional analyses that canilluminate the patterns of inequity we uncovered within andacross race and sex categories.Acknowledgements: Joseph Bruch provided comments and feedback on manuscript framing and methods. Dr. Nancy Krieger providedinitial conceptual and methodological feedback.Corresponding Author: Tamara Rushovich, M.P.H.; Department ofSocial and Behavioral Sciences, Harvard T.H. Chan School of PublicHealth, Boston, MA, USA (e-mail: trushovich@g.harvard.edu).Authors’ Contribution Tamara Rushovich contributed to statisticalanalysis and interpretation, drafted manuscript, and contributed toedits. Marion Boulicault contributed to conceptualization, drafting,and editing of the manuscript. Jarvis Chen contributed to dataanalysis and interpretation. Ann Caroline Danielsen contributed toconceptualization and data collection. Amelia Tarrant contributed to
: Sex and Race Interactions in COVID-19 Outcomesthe data collection and validation. Sarah Richardson contributed toframing the research project, data interpretation and conceptualelements, structure/logic/flow of manuscript, editing and writing.Heather Shattuck-Heidorn contributed to conceptualization, drafting,analysis, and editing.14.15.Data were derived from public domainresources. The data that support the findings of this study weredownloaded from three sources:1) Michigan.gov, at 98163 98173%2D%2D-,00.html from thepublic use dataset “Cases by Demographics Statewide”2) Georgia Department of Public Health at rt from the link “Downloadthe data (CSV)”3) Centers for Disease Control and Prevention BridgedRace Estimates at l from the 2018 vintage for the year 2018Data Availability16.17.18.19.Declarations:Conflict of Interest: None of the authors have any conflicts of interestto rvard GenderSci Lab. US Gender/Sex COVID-19 Data Tracker.Published 2020. d19. Accessed July 6, 2020.Krieger N, Waterman PD, Chen JT. COVID-19 and overall mortalityinequities in the surge in death rates by zip code characteristics:Massachusetts, January 1 to May 19, 2020. Am J Public Health.2020;110(12):1850-1852. https://doi.org/10.2105/AJPH.2020.305913.Yancy CW. COVID-19 and African Americans. J Am Med Assoc.2020;323(19):1891-1892. https://doi.org/10.1001/jama.2020.6548.Krieger N. Epidemiology and the web of causation: Has anyone seen thespider? Soc Sci Med. 1994;39(7):887-903. haw KW. Demarginalising the intersection of race and sex: A blackfeminist critique of anti-discrimination doctrine, feminist theory, andanti-racist politics. Univ Chic Leg Forum. 1989;1(8):139-167. https://doi.org/10.4324/9781315582924-10.McCall L. The Complexity of Intersectionality. Signs J Women Cult Soc.2005;30(3):1771-1800. https://doi.org/10.4324/9780203890882.Georgia Department of Public Health. Georgia Department of PublicHealth Daily Status Report. Published 2020. rt. Accessed September 21, 2020.Corona Virus, Michigan Data. Michigan.gov. Published 2020. https://w w w. m i c h i g a n . g o v / c o r o n a v i r u s / 0 , 9 7 5 3 , 7 - 4 0 6 - 9 8 1 6 398173%2D%2D-,00.html. Accessed September 21, 2020.Centers for Disease Control and Prevention. Bridged-Race PopulationEstimates. Published 2018. l. Accessed July 6, 2020.Klein RJ, Schoenborn CA. Age adjustment using the 2000 projectedU.S. population. Natl Cent Heal Stat. 2001;(20):1-9.Curtin LR, Klein RJ. Direct standardization (Age-Adjusted Death Rates).Heal People 2000 Stat Note. 1995;6:1-10.National Center for Health Statistics. Technical Notes: Provisional DeathCounts for Coronavirus Disease (COVID-19). Published 2021. https://www.cdc.gov/nchs/nvss/vsrr/covid19/tech notes.htm. Accessed February 5, 2021.von Elm E, Altman DG, Egger M, Pocock SJ, Gøtzsche PC, Vandenbroucke JP. The Strengthening the Reporting of Observational Studies inEpidemiology (STROBE) statement: guidelines for reporting observationalstudies. Lancet. 2007;370:1453-1457. .22.23.24.25.26.27.28.29.30.JGIMKrieger N, Chen JT, Waterman PD. COVID-19 Resources: Using theMethods of the Public Health Disparities Geocoding Project to MonitorCOVID-19 Inequities and Guide Action for Health Justice. Published2020. ovid-19resources/. Accessed December 19, 2020.Jones CP. Levels of racism: A theoretic framework and a gardener’s tale.Am J Public Health. 2000;90(8):1212-1215. https://doi.org/10.2105/AJPH.90.8.1212.Galasso V, Pons V, Profeta P, Becher M, Brouard S, Foucault M.Gender Differences in COVID-19 Related Attitudes and Behavior:Evidence from a Panel Survey in Eight OECD Countries. Natl Bur EconRes Work Pap Ser. 2020;27359. CBO9781107415324A009/type/book part% http://www.nber.org/papers/w27359.pdf.Global Health 5050. The COVID-19 Sex-Disaggregated Data r-and-covid-19-project/.Accessed December 19, 2020.Courtenay WH. Constructions of masculinity and their influence onmen’s well-being: a theory of gender and health. Soc Sci Med.2000;50:1385-1401. r N, Attar L, Farahat F, AlThaqafi A. Psychobehaviouralresponses to the 2014 Middle East respiratory syndrome-novel coronavirus (MERS CoV) among adults in two shopping malls in Jeddah,western Saudi Arabia. East Mediterr Heal J. 2016;22(11):817-823.Haischer MH, Beilfuss R, Hart MR, et al. Who is wearing a mask?Gender-, age-, and location-related differences during the COVID-19pandemic. PLoS One. 2020;15(10 October):1-12. r CL, Peterson RD. Toxic Mask-ulinity: The Linkbetween Masculine Toughness andAffective Reactions to MaskWearing in the COVID-19Era. Polit Gend. 2020:1-8. https://doi.org/10.1017/S1743923X20000422.Kramer S. More Americans say they are regularly wearing masks instores and other businesses. Pew Research Center. Published asks-in-stores-and-other-businesses/.Accessed December 19, 2020.Barnes TD, Holman MR. Essential Work Is Gender Segregated: ThisShapes the Gendered Representation of Essential Workers in PoliticalOffice. Soc Sci Q. 2020;101(5):1827-1833. https://doi.org/10.1111/ssqu.12850Frye J. On the Frontlines at Work and at Home: The DisproportionateEconomic Effects of the Coronavirus Pandemic on Women of Color. CentAm Prog. Published online 2020.Hawkins D. Differential occupational risk for COVID-19 and otherinfection exposure according to race and ethnicity. Am J Ind Med.2020;(May):13-16. https://doi.org/10.1002/ajim.23145.Saloner B, Parish K, Ward JA, DiLaura G, Dolovich S. COVID-19 Casesand Deaths in Federal and State Prisons. J Am Med Assoc.2020;324(6):602-603. https://doi.org/10.1056/nejmp2014836.Wildeman C, Wang EA. Mass incarceration, public health, and wideninginequality in the USA. Lancet. 2017;389(10077):1464-1474. https://doi.org/10.1016/S0140-6736(17)30259-3.Rana Bayakly A. Burden of cardiovascular disease in Georgia. GeorgiaDepartment of Public Health. Published 2015. ad. Accessed August 3, 2020.Williams DR, Lawrence JA, Davis BA. Racism and Health: Evidence andNeeded Research. Annu Rev Public Health. 2019;40:105-125. 043750.Boulicault M, Danielsen AC, Bruch J, Tarrant A, Borsa A, RichardsonS. Socially Relevant Variables In US State COVID-19 SurveillanceReporting: A Report Card. Heal Aff Blog. Published online g20200710.964611/full/.Publisher’s Note Springer Nature remains neutral with regard tojurisdictional claims in published maps and institut
Institutional Review Board approval review as only publicly available de-identified data were used. RESULTS Men had consistently higher COVID-19 mortality rates than women within age and race strata (Tables 1 and 2). For example, in GA, among individuals aged 70-79 the rate among white men and white women respectively was 235.5