Transcription
ExtraHop 8.5ExtraHop System User Guide
2022 ExtraHop Networks, Inc. All rights reserved.This manual in whole or in part, may not be reproduced, translated, or reduced to any machine-readableform without prior written approval from ExtraHop Networks, Inc.For more documentation, see https://docs.extrahop.com/.Published: 2022-05-03ExtraHop NetworksSeattle, WA 98101877-333-9872 (US) 44 (0)203 7016850 (EMEA) 65-31585513 (APAC)www.extrahop.com
ContentsAbout this guide8Introduction to the ExtraHop system9Contact usSmart Sensor AnalyticsMetric AnalyticsData feedsSoftware frame deduplicationDevice discoveryCentralized Management8999101113Navigating the ExtraHop System14Time intervals20Overview pages25Dashboards32Supported browsersLayout and menusStart analyzing dataAdvanced workflows for customizing your ExtraHop systemAccess keyboard shortcutsManage dashboards with keyboard shortcutsChange the time intervalView the latest data for a time intervalChange chart data granularityZoom in on a custom time rangeFreeze the time interval to create a custom time rangeSecurity OverviewThreat BriefingsNetwork OverviewActivity mapsNetwork health indicatorsPerimeter OverviewHalo visualizationCreating dashboardsViewing dashboardsExport and share dashboard dataSystem dashboardsActivity dashboardNetwork dashboardSecurity dashboardSystem Health dashboardCreate a dashboardCreate the dashboard layoutEdit a basic chartEdit a basic text box 3435353738383839ExtraHop 8.5 ExtraHop System User Guide3
Add more widgets and regions to your dashboardChart editing tipsCreate a dashboard with dynamic sourcesCopy a dashboardEdit a dashboard layoutEdit a chart with the Metric ExplorerCreate and edit a basic chartConfigure advanced options for data analysis and chart customizationRegular expression filtersEdit a text box widgetFormat text in MarkdownAdd images in MarkdownAdd metric examples in MarkdownMetric query examples for the text box widgetEdit a dashboard regionChange the time interval for a dashboard regionEdit dashboard propertiesPresent a dashboardShare a dashboardRemove access to a dashboardCreate a dashboard collectionShare a dashboard collectionExport dataExport data to ExcelExport data to CSVCreate a PDF fileCustomize the format of a PDF fileChart typesCreate a chartCopy a chartDrill downDrill down from a dashboard or protocol pageDrill down on network capture and VLAN metricsDrill down from a detectionDrill down from an alertInvestigate detail metricsDrill-down a second time by a key filterAdd detail metrics to a chartDisplay a rate or count in a chartDisplay the average rate in a chartDisplay the maximum rate in a chartDisplay percentiles or a mean in a chartDisplay a custom range of percentilesFilter outliers in histogram or heatmap chartsEdit metric labels in a chart legendAdd a dynamic baseline to a chartAdd a static threshold line to a chartDisplay device group members in a chartRegular expression filtersFind all devices talking to external IP addressesMonitor a device for external IP address connectionsCompare time intervals to find the metric deltaSort metricsCreate a chart from a protocol 919495969797ExtraHop 8.5 ExtraHop System User Guide4
Assets98Devices99Navigating devicesDevice Overview pageDevice metricsIP address detailsGrouping devicesCustom devicesDevice groupsDevice names and rolesDevice namesDevice rolesFind a deviceFind a device from a global searchSearch for a device by detailsSearch for devices by protocol activitySearch for devices accessed by a specific userSearch for peer devicesChange a device nameChange a device roleCreate a device tagCreate a device groupCreate a dynamic device groupCreate a static device groupCreate a custom deviceDelete or disable a custom deviceClassify IP addresses and trusted domainsSpecify the locality for IP addressesFilter IP addresses by localityAdd a trusted 17119120121122122126127128129129129130Analysis priorities132Activity maps141Prioritizing devices and groupsCompare analysis levelsTransfer management of analysis prioritiesPrioritize groups for Advanced AnalysisPrioritize groups for Standard AnalysisAdd a device to the watchlistRemove a device from the watchlistNavigate activity mapsLayoutLabels and iconsCircle and line sizeColorAdd steps and filters to a mapManage activity mapsBest practices for investigating activity map dataCreate an activity mapCreate a basic activity mapAdd connections and filter devices in your 1151153ExtraHop 8.5 ExtraHop System User Guide5
Add another level of device connectionsInclude or exclude devicesSave and share an activity mapRemove or change access to an activity mapLoad and manage a saved activity mapDetections154155156157157Navigating detectionsGrouping, filtering, and sorting detectionsGrouping detectionsFiltering detectionsSorting detectionsFinding detections in the ExtraHop systemShare a detectionInvestigate security detectionsStart your investigationRefine your investigationInvestigate performance detectionsStart your investigationRefine your investigationTune detectionsTune a detection from a detection cardManage Detection RulesCreate a notification ruleTrack a detection investigationCreate a custom detectionCreate a trigger to generate custom detectionsCreate a detection formatView custom detectionsExample Custom Detection TriggerSpecify custom parameters for detectionsConfigure ticket tracking for detectionsEnable ticket tracking and specify a URL templateWrite a trigger to create and update tickets about detections on yourticketing systemSend ticket information to detections through the REST 5176177178179180183184184186188188188190Threat intelligence193Alerts199Records210Threat collectionsInvestigating threatsManage threat collectionsEnable ExtraHop-curated threat collectionsUpload a threat collectionConfiguring alertsViewing alertsConfigure a threshold alertConfigure a trend alertConfigure a detection alertAdd a notification to an alert configurationAdd an exclusion interval to an alert193193197197198199199200202207208208ExtraHop 8.5 ExtraHop System User Guide6
Navigating recordsFilter your records with a simple queryFinding records in the ExtraHop systemCollect recordsCollect flow recordsCollect L7 records with a triggerCollect custom recordsWrite and assign a triggerCreate a custom record format to display your record results in a tableQuery for your custom record typeRecord format settingsQuery records with an advanced filterFilter your records with advanced query rulesEnable record queries for custom Appendix251Configure a global packet captureAnalyze a packet capture fileSet the offline capture modeReturn the system to live capture modeFilter packets with Berkeley Packet Filter syntaxAdd a filter with BPF syntaxSupported BPF syntaxStore SSL session keys on connected Trace appliancesDownload session keys with packet capturesConfigure Wireshark to view the decrypted payloadBuild a triggerConfigure trigger settingsWrite a trigger scriptAdvanced trigger optionsMonitor trigger performanceCheck trigger output in the debug logView the performance of an individual triggerView the performance of all triggers on the systemInstall a bundleCreate a bundlePost a bundle to the ExtraHop websiteGenerate a geomapCreate a scheduled reportExtraHop modulesSupported browsersCommon acronymsKeyboard 7239239240241243244245248249251252252253ExtraHop 8.5 ExtraHop System User Guide7
About this guideThis guide provides information about the ExtraHop system for the ExtraHop Discover and Commandappliances.The purpose of this guide is to help users understand the ExtraHop system architecture and functionality aswell as learn how to operate the controls, fields, and options available throughout the system.Additional resources are available through the following links: See information about administrator features and functions for the ExtraHop Discover and Commandappliances in the ExtraHop Admin UI GuideSee the complete ExtraHop documentation set: https://docs.extrahop.com .See online training modules on the ExtraHop website: https://www.extrahop.com/go/training/ .Contact usWe value your feedback.Please let us know how we can improve this document. Send your comments or suggestions todocumentation@extrahop.com.If you need additional help, please contact ExtraHop Support. at or visit the ExtraHop Customer SupportPortal at https://customers.extrahop.com/ . Email: support@extrahop.com Support Portal Website: https://customers.extrahop.com/ Telephone: 877-333-9872 (US) 44 (0)203 7016850 (EMEA) 65-31585513 (APAC)ExtraHop 8.5 ExtraHop System User Guide8
Introduction to the ExtraHop systemThe ExtraHop system provides a comprehensive network detection and response solution for trackingsecurity threats and IT operations. You can monitor how applications consume network resources, howsystems and devices communicate with each other, and how transactions flow across the data link layer (L2)to application layer (L7) in your network.This guide explains how the ExtraHop system collects and analyzes your data and how the core systemfunctionalities can help you access top-level and detailed metrics, transactions, and packets about thetraffic on your network.Smart Sensor AnalyticsExtraHop system provides a smart sensor that captures, stores, and analyzes metric data about yournetwork—and offers different levels of data analysis, collection, and storage based on your needs. Thesensor is provisioned with storage to support 30 days of metric lookback. Note that actual lookback variesby traffic patterns, transaction rates, the number of endpoints, and the number of active protocols.The browser-based system interface provides tools that enable you to explore and visualize data,investigate findings in both top-down and bottoms-up workflows, and customize how you collect, view, andshare your network data.Metric AnalyticsThe ExtraHop system collects and stores multiple depths of network interactions. Packets are the raw datatransferred between two endpoints. Records are structured information about transaction, message, andnetwork flows. Metrics are aggregated observations about endpoint interactions over time.For example, when a client sends an HTTP request to a web server, here is what each data type contains: The packet contains the raw data that was sent and received in the interaction.The related record contains the time-stamped metadata about the interaction: when the requesthappened, the IP address of the client and server, the requested URI, any error messages.The related metric (HTTP Requests) contains an aggregate of that interaction with other observedinteractions during the specified time period, such as how many requests occurred, how many ofthose requests were successful, how many clients sent requests, and how many servers received therequests.Both metrics and records can be customized to extract and store specific metadata with JavaScript-basedtriggers. While the ExtraHop system has over 4600 built-in metrics , you might want to create a custommetric that collects and aggregates 404 errors from only critical web servers. And, you might want tomaximize your record storage space by only collecting transactions that occurred over a suspicious port .Data feedsThe type of data feed you connect to the ExtraHop system determines how packets are collected, stored,and analyzed.Wire dataThe ExtraHop system passively collects a copy of unstructured packets through a port mirror or tap andstores the data in the local datastore. The copied data goes through real-time stream processing thattransforms the packets into structured wire data through the following stages:1.2.3.TCP state machines are recreated to perform full-stream reassembly.Packets are collected and grouped into flows.The structured data is analyzed and processed in the following ways:ExtraHop 8.5 ExtraHop System User Guide9
a.b.c.4.Transactions are identifiedDevices are automatically discovered and classified by their activity.Metrics are generated and associated with protocols and sources, and the metric data is thenaggregated into metric cycles.As new metrics are generated and stored, and the datastore becomes full, the oldest existing metricsare overwritten according to the first-in first-out (FIFO) principle.Flow dataAlternatively, you can configure the ExtraHop system to collect flows from machine data on remotenetworks. A flow is a set of packets that are part of a single transaction between two endpoints. Byanalyzing flows of network traffic, an administrator can identify the top network flows (most bytesconsumed), top network talkers (highest throughput), total number of bytes, and the total number ofpackets per router interface.Note: Reveal(x) systems cannot be configured to collect flow data.The ExtraHop system acts as a flow collector or analyzer and supports the following types of flow data:NetFlow v5The Cisco proprietary protocol that defines a flow as a unidirectional flow of packets that sharethe following values: ingress interface, source and destination IP address, IP protocol, source anddestination ports, and the type of service. NetFlow v5 has a fixed record format with 20 fields andcannot be customized.NetFlow v9An adapted version of NetFlow v5 where the record format is template based. NetFlow v9 has 60 fields in the records and can be customized. In the ExtraHop system, these records are only partiallyparsed until the template packet is detected.IPFIXAn open standard based on the NetFlow v9 standard. The ExtraHop system supports only the nativeformat; formats where the Enterprise bit is set outside of a trigger are not supported.AppFlowThe Citrix implementation of IPFIX with customized extensions to include application-levelinformation such as HTTP URLs, HTTP request methods, status codes, and so on.sFlowA sampling technology for monitoring traffic in data networks. sFlow samples every nth packet andsends it to the collector whereas NetFlow sends data from every flow to the collector. The primarydifference between sFlow and NetFlow is that sFlow is network layer independent and can sampleanything. NetFlow v5 is IP based, but v9 and IPFIX can also look at Layer 2.Software frame deduplicationThe ExtraHop system removes duplicate L2 and L3 frames and packets when metrics are collected andaggregated from your network activity by default. L2 deduplication removes identical Ethernet framesExtraHop 8.5 ExtraHop System User Guide10
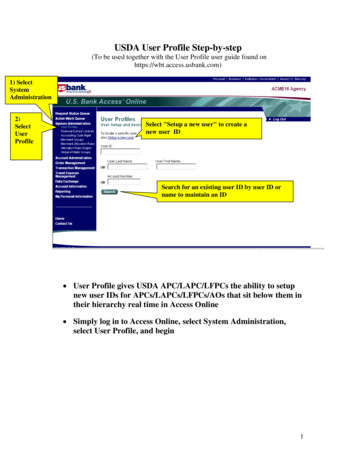
(where the Ethernet header and the entire IP packet must match); L3 deduplication removes TCP or UDPpackets with identical IP ID fields on the same flow (where only the IP packet must match).The ExtraHop system checks for duplicates and removes only the immediately-previous packet both on theflow (for L3 deduplication) or globally (for L2 deduplication) if the duplicate arrives within 1 millisecond ofthe original packet.By default, the same packet traversing different VLANs is removed by L3 deduplication. In addition, packetsmust have the same length and the same IP ID, and TCP packets also must have the same TCP checksum.L2 duplication usually only exists if the exact same packet is seen through the data feed, which is typicallyrelated to an issue with port mirroring. L3 duplication is often the result of mirroring the same trafficacross multiple interfaces of the same router, which can show up as extraneous TCP retransmissions in theExtraHop system.The System Health page contains charts that display L2 and L3 duplicate packets that were removed by theExtraHop system. Deduplication works across 10Gbps ports by default and across 1Gbps ports if softwareRSS is enabled. L3 deduplication currently is supported only for IPv4, not IPv6.Device discoveryThe ExtraHop system can discover and track devices by their MAC address (L2 Discovery) or by their IPaddresses (L3 Discovery). L2 Discovery offers the advantage of tracking metrics for a device even if the IPaddress is changed or reassigned through a DHCP request.Device IPv4 and IPv6 addresses are learned from Address Resolution Protocol (ARP) messages, theNeighbor Discovery Protocol (NDP) responses, local broadcasts, or local subnet multicast traffic. The MACaddress and IP address for devices appear in search results and throughout the system with the deviceinformation.After a device is discovered, the ExtraHop system begins to collect metrics based on the analysis levelconfigured for that device through analysis priorities. You can search for devices by their MAC address, IPaddress, or name (such as a hostname observed from DNS traffic, NetBIOS name, Cisco Discovery Protocol(CDP) name, DHCP name, or a custom name that you assigned to the device).Important: Previous versions of the ExtraHop system were configured for L3 Discovery by default.If your ExtraHop system is upgraded to version 8.0, the Device Discovery settings donot change automatically. If you switch to L2 Discovery, metrics begin accumulating ondifferent devices with the same IP address. Learn how to enable L2 Discovery .L2 DiscoveryThe ExtraHop system creates a device entry for every local MAC address discovered over the wire. IPaddresses are mapped to the MAC address, but metrics are stored with the device MAC address even if theIP address changes.IP addresses observed outside of locally-monitored broadcast domains are aggregated at one of theincoming routers in your network. If a device sends a DHCP request through a router acting as a DHCPrelay agent, the ExtraHop system detects and maps the IP address to the device MAC address. If the IPaddress changes for the device with a subsequent request through the DHCP relay agent, the ExtraHopsystem updates its mapping and continues to keep track of the device metrics by the MAC address.ExtraHop 8.5 ExtraHop System User Guide11
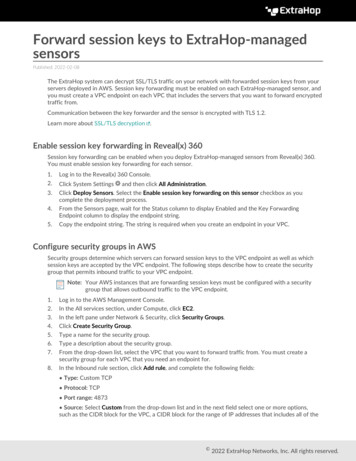
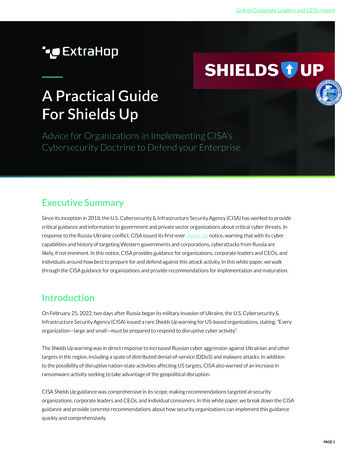
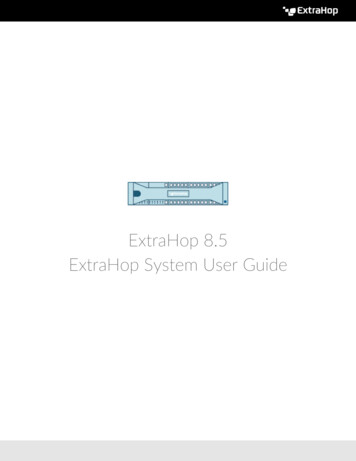
Figure 1: Both MAC address and IP address are discovered for the remote device.If a DHCP relay agent is not configured, remote devices can be discovered by their IP addresses throughRemote L3 Discovery.L3 DiscoveryWhen L3 Discovery is enabled, the ExtraHop system creates and links two entries for each local discovereddevice: an L2 parent entry with a MAC address and an L3 child entry with IP addresses and the MACaddress.Here are some important considerations about L3 discovery: If a router has proxy ARP enabled, the ExtraHop system creates an L3 device for each IP address thatthe router answers ARP requests for.If you have a proxy ARP configured in your network, the ExtraHop system might automaticallydiscover remote devices.L2 metrics that cannot be associated with a particular L3 child device (for example, L2 broadcast traffic)are associated with the L2 parent device.L2 parent devices that are not gateways or custom devices do not count towards your licensed analysiscapacity. These devices are configured for the L2 Parent Analysis level.Configure L3 DiscoveryRemote L3 DiscoveryIf the ExtraHop system detects an IP address that does not have associated ARP or NDP traffic, that deviceis considered a remote device. Remote devices are not automatically discovered, but you can add a remoteIP address range and discover devices that are outside of the local network. A device entry is created foreach IP address that is observed within the remote IP address range. (Remote devices do not have L2parent entries.)ExtraHop 8.5 ExtraHop System User Guide12
Figure 2: Only the IP address is discovered for the remote device.Here are some conditions about when you should configure Remote L3 Discovery: Your organization has a remote office without an on-site ExtraHop system but users at that site accesscentral data center resources that are directly monitored by an ExtraHop system. The IP addresses atthe remote site can be discovered as devices.A cloud service or other type of off-site service hosts your remote applications and has a known IPaddress range. The remote servers within this IP address range can be individually tracked.Configure devices for Remote L3 DiscoveryNetwork localityBy default, any device with an RFC1918 IP address (included in a 10/8, 172.16/12, or 192.168/16 CIDRblock) is classified on the system as an internal device.However, because some network environments include non-RFC1918 IP addresses as part of their internalnetwork, you can change the internal or external classification for IP addresses from the Network Localitiespage.Centralized ManagementThe ExtraHop system can be configured as a centralized system with connections to multiple sensors, datawarehouses, and packetstores that are distributed across data centers, branch offices, and cloud services.The system interface on the Command appliance and Reveal(x) 360 provides visibility across all of your datain a single view and enables you to sync certain advanced configurations (such as triggers and alerts) andsettings (custom parameters, analysis priorities, and recordstores)Here are some benefits to centralized management: Create a dashboard that displays sensor data from each of your remote offices.Query for records and view detections that show potential issues across multiple sites.Limit user accounts to a single system instead of creating multiple accounts for each sensor.ExtraHop 8.5 ExtraHop System User Guide13
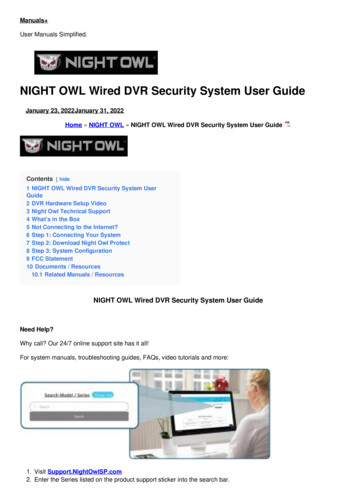
Navigating the ExtraHop SystemThe ExtraHop system provides access to network activity data and detection details through a dynamic andhighly customizable user interface.This guide provides an overview of the global navigation and controls, fields, and options availablethroughout the system. See Introduction to the ExtraHop system to learn how the ExtraHop systemcollects and analyzes your data.Supported browsersThe following browsers are compatible with all ExtraHop systems. Apply the accessibility and compatibilityfeatures provided by your browser to access content through assistive technology tools. FirefoxGoogle ChromeMicrosoft EdgeSafariImportant: Internet Explorer 11 is no longer supported. We recommend that you install the latestversion of any supported browser.Layout and menusGlobal navigation elements are located at the top of the page and contain links to the main sections of thesystem. Within each section, the left pane contains links to specific pages or data.The following figure shows both global and left pane navigation elements.Here are definitions of each global navigation element:ExtraHop 8.5 ExtraHop System User Guide14
Overview pagesOverview pages enable you to quickly evaluate the scope of suspicious activity on your network,learn about protocol activity and device connections, and investigate inbound and outbound trafficon your network. View the Security Overview for information about security detections on your network. View the Network Overview for information about active devices on your network. View the Perimeter Overview for information about traffic traveling in and out of your network.DashboardsClick Dashboards to view, create, or share dashboards for monitoring any aspect of your networkor applications. System dashboards give you an instant view of the activity and potential securitythreats on your network.AlertsClick Alerts to view information about each alert generated during the time interval.DetectionsIf your Discover appliance is connected to the ExtraHop Machine Learning Service, the top levelnavigation shows the Detections menu. Click Detections to view detections identified from yourwire data. You can access stored detections even if your appliance is disconnected from the MachineLearning Service.Note: Machine learning detections require a connection to ExtraHop Cloud Services .AssetsClick Assets to find any application, network, or device discovered by the ExtraHop system. You canview protocol metrics for your assets, active users, or network activity by protocol.RecordsIf your ExtraHop system is configured with a recordstore, the top level navigation shows the Recordsmenu. Click Records to query for all stored records for the current time interval. Records arestructured information about transactions, messages, and network flows.PacketsIf your ExtraHop system is configured with a packetstore, the top level navigation shows the Packetsmenu. Click Packets to query for all stored packets for the current time interval.Global search fieldType the name of any device hostname or IP address, application, or network to find a match onyour Discover or Command appliance. If you have a connected ExtraHop Explore appliance, you cansearch for saved records. If you have a connected Trace appliance, you can search for packets.Help iconSee help information for the page that you are currently viewing. To access the most current andcomprehensive set of ExtraHop documentation, visit the ExtraHop Documentation website .System Settings iconAccess system configuration options, such as Triggers, Alerts, Scheduled Reports, and CustomDevices. Click to view the ExtraHop appliance and version and view system notices .User option iconLog in and log out of your Discover appliance or Command appliance, change your password, andaccess API options.Pane toggleCollapse or expand the left pane.Global Time SelectorChange the time interval to view application and network activity that was observed by theExtraHop system for a specific time period. The global time interval is applied to all metrics acrossthe system and does not change as you navigate to different pages.ExtraHop 8.5 ExtraHop System User Guide15
Recent pagesSee a list of the most recent pages you visited in a drop-down menu and make a selection to go backto a previous page. Repeated pages are deduplicated and condensed to save space.Navigation pathView where you are in the system and click a page name in the path to navigate back to that page.Command menu drop-downClick to access specific actions for the page you are viewing. For example, when you clickDashboards at the top of the page, the command menu provides actions for changing dashboardproperties or creating a new dashboard.Start analyzing dataBegin your data analysis journey with the ExtraHop system by following the basic workflows listed below.As you become familiar with the ExtraHop system, you can complete more advanced tasks, such asinstalling bundles and building triggers.Here are some basic ways to navigate and work with the ExtraHop system to analyze network activity.Monitor metrics and investigate interesting dataA good starting point is the Activity dashboard, which shows you a summary of important metricsabout application performance on your network. When you see a spike in traffic, errors, or serverprocessing time, you can interact with dashboard data to drill down and identify which clients,servers, methods, or other factors contributed to the unusual activity.You can then continue performance monitoring or troubleshooting by creating a custom dashboardto track a set of interesting metrics and devices.Check out the following walkthroughsto learn more about monitoring data in dashboards: Monitor website performance in a dashboard Monitor DNS errors in a dashboard Monitor database health in a dashboardSearch for a specific device and investigate related metrics and transactionsIf you want to investigate a slow server, you can search for the server in the ExtraHop system bydevice name or IP address and then investigate the server's activity on a protocol page. Was therea spike in response errors or requests? Was server processing time too high or did network latencyaffect the rate of data transfer? Click on different protocols on the Devices page to investigate moremetric data collected by the ExtraHop system. Drill down by peer IP addresses to see which clientsor applications the server talked to.If your ExtraHop system is connected to a recordstore, you can investigate entire transactions thatthe server participated in by creating a record query.Check out the following walkthroughsto learn more about exploring metrics and records: Explore metrics in the ExtraHop system to investigate DNS failures Query records to find missing web resourcesGet visibility into changes to your network by searching for protocol activityYou can get a top-down view of your network by looking at built-in protocol groups. An protocolgroup is a collection of devices automatically grouped together by the ExtraHop system based on theprotocol traffic observed over the wire. For example, you can find new or decommissioned serversthat are actively communicating over a protocol by creating an activity map.If you find a collection of devices that you want to continue monitoring, you can add a device tagor custom device name to make those devices easier to find in the ExtraHop system. You can alsocreate a custom device group or a custom dashboard to monitor device group activity.ExtraHop 8.5 ExtraHop System User Guide16
Advanced workflows for customizing your ExtraHop systemAfter becoming familiar with basic workflows, you can customize your ExtraHop system by setting up alertnotifications, creating custom metrics, or installing bundles.Set up alertsAlerts track specified metrics to notify you of traffic deviations that might indicate an issue with anetwork device. Configure a threshold alert to notify you when a monitored metric crosses a definedvalue. Configure a trend alert to notify you when a monitored metric deviates from the normaltrends observed by the system.Install a bundle to enhance ExtraHop features and integrationsBundles are a saved set of system configurations that can be uploaded to
Drill-down a second time by a key filter 80 Add detail metrics to a chart 81 Display a rate or count in a chart 83 Display the average rate in a chart 84 Display the maximum rate in a chart 84 Display percentiles or a mean in a chart 85 Display a custom range of percentiles 86 Filter outliers in histogram or heatmap charts 86