Transcription
CLOSING THE FINANCING GAPIN ASIAN INFRASTRUCTURESungsup Ra and Zhigang LiNO. 57June 2018ADB SOUTH ASIAWORKING PAPER SERIESASIAN DEVELOPMENT BANK
ADB South Asia Working Paper SeriesClosing the Financing Gap in Asian InfrastructureSungsup Ra and Zhigang LiNo. 57 June 2018Sungsup Ra is a director at the Human and SocialDevelopment Division (SAHS), South Asia Department,Asian Development Bank (ADB); and Zhigang Li is asocial sector specialist at SAHS, ADB.We thank Kairon Shayne D. Garcia for her excellentresearch assistance to this report.
Creative Commons Attribution 3.0 IGO license (CC BY 3.0 IGO) 2018 Asian Development Bank6 ADB Avenue, Mandaluyong City, 1550 Metro Manila, PhilippinesTel 63 2 632 4444; Fax 63 2 636 2444www.adb.orgSome rights reserved. Published in 2018.ISSN 2313-5867 (print), 2313-5875 (electronic)Publication Stock No. WPS189402-2DOI: http://dx.doi.org/10.22617/WPS189402-2The views expressed in this publication are those of the authors and do not necessarily reflect the views and policiesof the Asian Development Bank (ADB) or its Board of Governors or the governments they represent.ADB does not guarantee the accuracy of the data included in this publication and accepts no responsibility for anyconsequence of their use. The mention of specific companies or products of manufacturers does not imply that theyare endorsed or recommended by ADB in preference to others of a similar nature that are not mentioned.By making any designation of or reference to a particular territory or geographic area, or by using the term “country”in this document, ADB does not intend to make any judgments as to the legal or other status of any territory or area.This work is available under the Creative Commons Attribution 3.0 IGO license (CC BY 3.0 o/. By using the content of this publication, you agree to be boundby the terms of this license. For attribution, translations, adaptations, and permissions, please read the provisionsand terms of use at https://www.adb.org/terms-use#openaccess.This CC license does not apply to non-ADB copyright materials in this publication. If the material is attributedto another source, please contact the copyright owner or publisher of that source for permission to reproduce it.ADB cannot be held liable for any claims that arise as a result of your use of the material.Please contact pubsmarketing@adb.org if you have questions or comments with respect to content, or if you wishto obtain copyright permission for your intended use that does not fall within these terms, or for permission to usethe ADB logo.Notes:In this publication, “ ” refers to United States dollars.ADB recognizes “China” as the People’s Republic of China, and “Korea” as the Republic of Korea.Corrigenda to ADB publications may be found at http://www.adb.org/publications/corrigenda.
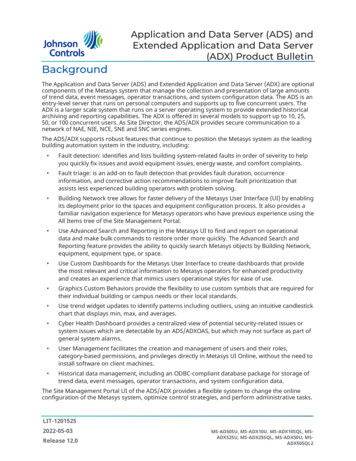
CONTENTSTABLES AND FIGURES .ivABBREVIATIONS . vABSTRACT .viI.INTRODUCTION . 1II.HOW WIDE IS ASIA’S INFRASTRUCTURE FINANCING GAP? . 3A.Economic Infrastructure . 3B.Social Infrastructure . 5C.Structure of Financing Gaps . 7III.WHY HAVE ASIA’S SAVINGS LARGELY FAILED TO FINANCEITS INFRASTRUCTURE NEEDS? . 8A.Cross-border Investment Paradox . 8B.Sources of Failure . 11IV.HOW TO BRIDGE THE FINANCING GAP . 16A.Solution Framework . 16B.Role of Multilateral Development Banks . 18C.Latest Developments in Infrastructure Financing Modalities in Asia. 19D.Caveat of New Initiatives for Infrastructure Financing . 21V.CONCLUSION . 22REFERENCES . 25
TABLES AND FIGURESTABLES1Infrastructure Investment Gap in Asia, 25 Developing Member Countries .12Portfolio Investment Assets Position from Asia to the World and Vice Versa .103Total Gross Savings, Reserves, and Net Investment in Selected Countries .10FIGURES1Gross Domestic Product per Capita and Infrastructure Index, 2011 . 22Current Infrastructure Investment in Asia, by Country and Source of Financing (2015) .43Infrastructure Investment, Current and Projected, by Sector . 54Current Infrastructure Investment in Social Sector . 65Infrastructure Investment, by Financing Source and Sector . 76Infrastructure Financing Gap, Public versus Private, 2016–2020 . 87Investment Assets Positions from Developing Asia and PacificRegion to the World and Vice Versa. 118Risk–Return Profiles of Infrastructure Investments in Relationto Traditional Asset Classes. 139Partnering with Financing Intermediaries for Wholesale Lending . 2010Partnering with Financing Intermediaries to Develop the Bond Market . 2011Developing Local Currency Bond Market . 21
WHO––––––––––––Asian Development Bankdeveloping member countrygross domestic productIndia Infrastructure Finance Company Limitedmultilateral development bankOrganisation for Economic Co-operation and Developmentpublic–private partnershipPeople’s Republic of ChinaUnited NationsUnited Nations Educational, Scientific and Cultural OrganizationUnited StatesWorld Health Organization
ABSTRACTInfrastructure investment in Asia faces a massive financing gap, both in “hard” and “soft” infrastructure,despite the region’s high savings. Underlying this gap is a capital flow paradox in which Asia’s outflow ofportfolio funds far exceeds the inflow. To change this, solutions in at least three areas are necessary:innovative measures to mitigate constraints, preparation of bankable projects, and mitigation of risks.This study presents examples from actual investment projects to illustrate the latest developmentsaddressing some fundamental constraints on infrastructure financing.
“[t]he infrastructure story is tantalizing—trillions of dollars needed in infrastructure upgradesand a global wall of money seeking yield. Yet the investable universe is smalland funds take a long time to invest.”(BlackRock 2014)I.INTRODUCTION1.Asia continues to suffer a massive infrastructure financing deficit. The Asian Development Bank(ADB) in 2017 estimated a financing gap in this area of 459 billion per year, or about 2.4% of developingAsia’s gross domestic product (GDP).1 Add in the expected need for funding of “social” infrastructure,such as health and education, and the gap almost doubles to 907 billion.2.This is because Asia’s developing countries spend only about 881 billion a year oninfrastructure, well below an estimated need of 1.34 trillion per year from 2016 until 2030 (Table 1).Demand for infrastructure investment is only bound to grow as the region realizes its economic potential(Figure 1).Table 1: Infrastructure Investment Gap in Asia, 25 Developing Member CountriesCountriesTotal (25 Asian DMCs)Total without jection (2016–2020)Future AnnualNeeds1,340503837Gap (% of GDP)459 (2.4)308 (5.0)151 (1.2)DMC developing member country, GDP gross domestic product, PRC People’s Republic of China.Notes: billion in 2015 prices. Gap Investment needs – Current InvestmentSource: ADB (2017a).3.As such, unless Asian countries undertake measures to address the underlying problems, theshortfall will continue and the infrastructure gap widen even more. These actions could include, amongothers, a stronger pipeline of infrastructure investments, a reduction in their perceived risks, removal ofinstitutional constraints on investment, clearer definition of infrastructure as an asset class, and bettercapital markets to draw in more homegrown investment.4.For now, however, even though Asia and the Pacific maintains the highest savings rates in theworld, it still invests significantly more of these funds abroad than it does within the region. In 2015,savings rates in one-third of Asian economies were more than 30%, far above their westerncounterparts. In the People’s Republic of China (PRC), the rate reaches as much as 45% and grosssavings exceed 5 trillion. It also continues to accumulate unusually high foreign exchange reserves. Yet,as of the end of December 2016, Asia had invested 6.2 trillion in the rest of the world, while the rest ofthe world had invested 4.4 trillion in Asia.1The implied financing gap is at 2015 prices and the data are from Asian Development Bank publication, Meeting Asia’sInfrastructure Needs.
2ADB South Asia Working Paper Series No. 57Figure 1: Gross Domestic Product per Capita and Infrastructure Index,201111Natural log of GDP Per Capita( in 2010 Prices)SingaporeRepublicof Korea10MalaysiaHong Kong, ongoliaPapua New GuineaIndiaKiribatiFijiIndonesiaViet NamPakistanKyrgyz RepublicBangladeshCambodiaTongaArmeniaGeorgiaSri LankaBhutanPhilippinesUzbekistanLao PDRSolomon 6-Nepal24681012Infrastructure IndexGDP gross domestic product, Lao PDR Lao People’s Domestic Republic, PRC People’s Republicof China.Notes: The infrastructure index is computed based on first principal component of infrastructure stocksin roads, airport, electricity, telephone, mobile, broadband, water, and sanitation. Higher values representgreater infrastructure availability.Sources: World Bank. World Development Indicators. Available at: http://data.worldbank.org/indicator(accessed October 2017); Asian Development Bank (ADB). 2017a. Meeting Asia’s Infrastructure Needs.Asian Development Bank, Manila.5.Underlying these simultaneously massive savings and a yawning infrastructure gap is a “globalcapital flows paradox.” This refers to the coexistence of three unusual phenomena in the global financialsystem: (i) a huge outflow of capital from emerging markets into the industrialized countries,(ii) accumulation of foreign reserves in emerging economies, and (iii) expected negative returns onthose foreign reserves (Summers 2006).6.Another part of the problem is fiscal: that is, in meeting any such large financing need, it is notenough to simply raise fiscal spending. Indeed, many Asian countries are incapable of doing so—Asiancountries can only meet around half of the projected gap due to restrictions on debt expansion, taxreform, and reallocation of fiscal spending.7.Transforming even a small part of the region’s massive savings pool to greater infrastructureinvestment in Asia would substantially ease the projected infrastructure gap.The Financing Gap in the Literature8.The literature estimating the size of the infrastructure financing gap is growing rapidly. In 2017,ADB calculated that its 45 developing member countries (DMCs) would need to invest 26 trillion overthe 15-year period from 2016 to 2030, or 1.7 trillion per year. This amount included the costs of climatemitigation and adaptation (climate-adjusted estimate). It also updated its widely recognized estimatefrom 2009, compiled alongside the ADB Institute, projecting that developing Asia would need to invest
Closing the Financing Gap in Asian Infrastructure3a total slightly above 8 trillion (in 2008 prices) from 2010 to 2020, or almost 750 billion a year to buildthe infrastructure needed. That study looked at 32 of 45 DMCs. Both studies covered four sectors:transport, power, telecommunications, and water supply and sanitation.9.However, the current literature has a few limitations. Existing estimates of the infrastructurefinancing gap have paid most attention to “economic infrastructure” and much less attention to “socialinfrastructure,” mainly education and health. This could lead policy to show a significant bias toward socalled “hard” infrastructure.10.The literature mostly either takes a global perspective or focuses on more developed economiesor other regions, especially Latin America. Asia has received less attention even though it accounts forthe largest share of infrastructure investment and, possibly, the biggest future financing gap.11.Very few studies have explored practical policies and innovations to address the financing gapbased on actual infrastructure projects. A similar observation is made in Griffith-Jones et al. (2017):“Even though much of the conventional discussion about the role of development banks relies onmarket failures to provide a theoretical basis for their existence, there is little discussion about howdevelopment banks operate, their different intervention models, products and markets targeted, andregulatory issues.”12.This study’s contribution to the literature is therefore three-fold. It focuses on Asia, discussespotential solutions in-depth based on experience on the ground, and includes social infrastructure in itsscope of estimation. As will be shown, the financing gap in “social infrastructure” may be as massive asthat of “economic infrastructure” and deserve the same attention.II.HOW WIDE IS ASIA’S INFRASTRUCTURE FINANCING GAP?13.This study defines infrastructure broadly, including economic (hard) infrastructure—mainlytransport, energy, water and sanitation, and telecommunications—and social (soft) infrastructure suchas education and health. In contrast to economic infrastructure, which is mainly on capital, socialinfrastructure also includes recurrent spending in this study. This is partly because both capital andrecurrent spending are typically planned and financed together and hardly separable, and partly becausedata available do not allow for estimating the financing gap for capital and recurrent spending separately.Following Asian Development Bank (ADB 2017), for economic infrastructure, the infrastructurefinancing gap is defined as the difference between the recommended or estimated infrastructureinvestment needs for a country and its actual infrastructure investment over recent years. For socialinfrastructure, projections of needs are not available, so to measure the gap the study uses the differencebetween actual social sector spending and benchmark spending (as recommended by internationalagencies).A.Economic Infrastructure14.ADB (2017a) also provides the latest comprehensive estimates of the financing gap for physicalinfrastructure (or economic infrastructure) in Asia.2 As noted in the introduction, it estimates that the2Physical infrastructure includes roads, highways, railroads, airports, sea ports, electricity, telecommunications, water supplyand sanitation.
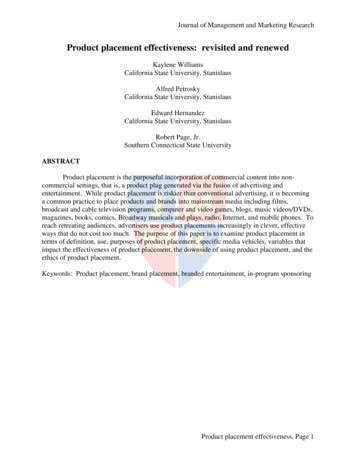
4ADB South Asia Working Paper Series No. 57region requires 1.3 trillion per year of economic infrastructure investment from 2016 to 2020 (in 2015prices), the analysis restricted to 25 developing member countries (DMCs) covering 2016–2020.3 Thisamount is 459 billion higher than the current infrastructure investment in these economies, equivalentto 2.4% of these economies’ total gross domestic product (GDP) during the same period (Table 1).15.Extending to 2016–2030 and expanding country coverage to 45 DMCs, the annual economicinfrastructure investment need increases to 1.7 trillion, or 26 trillion over 15 years. The investmentneeds are based on projections of a set of economic and demographic variables that influence demandor supply of infrastructure services and the historical, cross-country relationship between physicalstocks and these variables.16.Among Asian DMCs, the People’s Republic of China (PRC) has a relatively lower financing gap:its 686 billion current annual investment is 151 billion less than the projected infrastructureinvestment for 2016 to 2020. Although that is a large amount, it is only 1.2% of the PRC’s GDP (Table 1).In contrast, for the rest of the 24 countries, the annual financing gap is 308 billion—around 5% of GDP.6.8 6.65.7 5.45.1 4.94.3 4.13.72.1 1.9 1.8 1.7Feo ijirgSr ia*iLaAr nkamenIndo ia*nesN iaepM al*yPh anmilip arpiSi nesng *apoPa rePakispua Mo tanNew ngoG liaBa uinng ealad *eTh sh*ailand2.6 2.6 2.5 2.4 2.32.1G87654321-PRBh CuVi tanetNamInM diaaldives% of GDPFigure 2: Current Infrastructure Investment in Asia, by Country andSource of Financing (2015)PublicPrivate* public sector includes central government budget only, GDP gross domestic product,PRC People’s Republic of China.Sources: Country sources for public sector investments; World Bank. Private Participation inInfrastructure Database. https://ppi.worldbank.org/ (accessed September 2017); World Bank. WorldDevelopment Indicators. Available at: http://data.worldbank.org/indicator (accessed October 2017);Asian Development Bank (2017a).17.Figure 2 also shows current infrastructure financing of selected Asian economies. The share ofcurrent infrastructure investment to GDP ranges from about 2% for Bangladesh to close to 7% for thePRC. Other countries investing more than 5% of its GDP in infrastructure included Bhutan, India,Maldives, and Viet Nam in 2015.3The 25 DMCs include Afghanistan, Armenia, Bangladesh, Bhutan, Cambodia, the PRC, Fiji, India, Indonesia, Kazakhstan,Kiribati, the Kyrgyz Republic, Malaysia, Maldives, the Marshall Islands, the Federated States of Micronesia, Mongolia,Myanmar, Nepal, Pakistan, Papua New Guinea, the Philippines, Sri Lanka, Thailand, and Viet Nam.
Closing the Financing Gap in Asian Infrastructure518.The biggest infrastructure financing gap, meanwhile, is in the transport sector ( 600 billion peryear), followed by power ( 300 billion) (Figure 3). The investment gap for water and sanitation is around 100 billion per year, while the gap in telecommunications is small.Figure 3: Infrastructure Investment, Current and Projected, by werWaterand alNeeds400CurrentInvestment billion800939HealthNotes:1 For Transportation, Power, Water and Sanitation, Telecommunications: Current Investment is basedon 2011 figures. Investment needs are for 2016–2030 divided by 15 years.2 For Education and Health: Figures only include 18 DMCs; Year coverage: 2009 (Education) and 2013(Health) for the Philippines; 2013 for Fiji, India, Thailand, and Viet Nam; 2014 for Armenia,Bangladesh, Bhutan, Indonesia, Nepal, Pakistan, Sri Lanka, and Timor-Leste; 2011 (Education) and2014 (Health) for Mongolia; 2015 (Education) and 2014 (Health) for Kazakhstan; 2014 for theKyrgyz Republic; 2012 for Georgia; and 2012 (Education) and 2014 (Health) for the People’sRepublic of China.Source: Asian Development Bank (2017a).B.Social Infrastructure19.The financing gap in the social sector, including education and health, is also wide. Although few studiesare available to estimate the gross funding gap for the social sector in Asia, comparing actual social sectorspending with the benchmark can provide the necessary information. This study adopts the United NationsEducational, Scientific and Cultural Organization (UNESCO) recommendation as a benchmark for educationspending needs and the World Health Organization (WHO) benchmark for health spending needs.20.In this study, the total education investment covers general government education expenditure(current, capital, and transfers). It includes transfer-funded expenditure from international sources togovernment. Total health investment refers to total health expenditure as the sum of public and privatehealth. It includes the provision of health services (preventive and curative); family planning; nutrition;and emergency aid designated for health, excluding those allocated for water and sanitation. UNESCOrecommends that 6% of GDP be allotted for education, and the WHO recommends that 5% of GDP bespent on health (Singh 2010). 4 The difference between education or health expenditure and theUNESCO or WHO benchmarks is used to estimate the education and health spending gaps.4Recommendation on education expenditure as mentioned by UN Special Rapporteur on the Right to Education; KishoreSingh at the UNESCO Future Seminar on “Innovative Financing for Education” in 2010; Recommendation on healthexpenditure as implied in WHO World Health Report 2010.
6ADB South Asia Working Paper Series No. 5721.In 2016, 673 billion was spent on education, and 867 billion on health in 18 major DMCs(Figure 3). The Kyrgyz Republic, Mongolia, the PRC, Thailand, and Viet Nam spent above 4% of GDP inboth education and health. Bangladesh, Kazakhstan, and Pakistan spent less than 3% of GDP on eithereducation or health. In addition, although the spending of most developing Asian countries on educationand health is balanced, some spend much more on education than health (Bhutan, Timor-Leste), whileother Asian countries spend much more on health than education (Armenia, Georgia, Nepal, the PRC,the Philippines, and Sri Lanka).522.Following the approach described above, the total social sector spending gap in Asia is estimatedat 448 billion, almost equivalent to the total physical infrastructure investment gap (Figure 4). Most ofthe gap comes from the education sector, which amounts to 376 billion, with just 72 billion for health.It is important to note that this study is measuring the gap on public spending in education and health,which includes not only capital, but also recurrent spending. Hence, the scope of financing gap is widerthan that estimated for economic infrastructure, which mostly cover capital spending. As less than 20%of social sector spending is on capital, and more than 80% on recurrent spending (staff salaries), thefinancing gap for capital will likely be smaller than estimated. Due to data limitation, however, this studyis not able to disaggregate the spending on the “hard” and “soft” sides of the social sector spending.Figure 4: Current Infrastructure Investment in Social SectorGDP gross domestic product; PRC People’s Republic of China; UNESCO United NationsEducational, Scientific and Cultural Organization; WHO World Health Organization.Notes:Years covered: 2009 (Education) and 2013 (Health) for the Philippines; 2013 for Fiji, India, Thailand, andViet Nam; 2014 for Armenia, Bangladesh, Bhutan, Indonesia, Nepal, Pakistan, Sri Lanka, and Timor-Leste;2011 (Education) and 2014 (Health) for Mongolia; 2015 (Education) and 2014 (Health) for Kazakhstan;2014 for the Kyrgyz Republic; 2012 for Georgia; 2012 (Education) and 2014 (Health) for the PRC; and2015 for Singapore.Sources: United Nations. United Nations Educational, Scientific and Cultural Organization (UNESCO)Institute for Statistics. Available at: http://uis.unesco.org/ (accessed October 2017); World HealthOrganization. Global Health Expenditure database. Available at: http://www.who.int/health-accounts/ghed/en/ (accessed October 2017); Country government budget documents for education and healthcapital investment.5UNESCO Institute for Statistics. Available at: http://uis.unesco.org/ (accessed October 2017); WHO. Global HealthExpenditure database. Available at: http://www.who.int/health-accounts/ghed/en/ (accessed October 2017); World Bank.World Development Indicators. Available at: http://data.worldbank.org/indicator (accessed October 2017).
Closing the Financing Gap in Asian InfrastructureC.7Structure of Financing Gaps23.According to ADB (2017), the public sector dominates infrastructure financing, with 92% of thetotal. Public sector participation in infrastructure financing is highest in East Asia, with its share of over90%, and lowest in South Asia, holding 62% of the infrastructure financing. The private sector’scontribution is rising, accounting for 80% of physical infrastructure investment in Maldives, 50% inPakistan and the Philippines, and 40% in India. In contrast, in several countries, such as Bhutan, the PRC,and Mongolia, the role of private sector infrastructure investment is still very limited (Figure 2).24.Sources of funding (public versus private) varies by sector, depending on expected return,predictability of revenue stream, and risk profile (Figure 5). The telecommunications sector is the mostattractive for private investment, and the power sector comes second. Similar to Latin America, morethan 75% of the telecommunications sector and close to 50% in the power sector are privately financedin Asia. In contrast, water and sanitation, transport infrastructure, and social sector investment in theregion are mostly invested by the public sector.%Figure 5: Infrastructure Investment, by Financing Source and pingAsiaWater andSanitationPublicPrivateNotes:1 Latin America transport data is for land transport only. Years are: 2011 for Developing Asia; 2001–2006 gross domestic product-weighted average for Latin America.2 ADB estimates based on country sources and private participation in World Bank, Infrastructure,database.Sources: World Bank. Private Participation in Infrastructure Database. Available at:https://ppi.worldbank.org/ (accessed September 2017); World Bank. World Development Indicators.Available at: http://data.worldbank.org/indicator (accessed October 2017); Country sources as used inCalderon and Servén (2009).25.The potential for additional public-sector financing for infrastructure is limited, however. Itdepends on several factors, including the potential for increasing tax revenue through tax reform;reorienting spending such as by reducing general fuel subsidies; and prudent public-sector borrowing.ADB (2017) points out that while most countries in Asia have additional fiscal space to increaseinfrastructure investment, it is not sufficient, except in the PRC, which is able to fill its futureinfrastructure investment gap through higher public investment. Public financing during 2016–2020 isestimated to be 272 billion per year, approximately 60% of the total gap in Asia (Figure 6). This means
8ADB South Asia Working Paper Series No. 57that private financing will have to increase from the current 62.5 billion to 250 billion to fill theremaining gap. Facilitating private infrastructure financing is therefore critical.Annual Investment Gap( billion in 2015 prices)Figure 6: Infrastructure Financing Gap, Public versus Private, 2016–2020500450400350300250200150100500Private: 187 billionPrivate: 187 billionPublic: 272 billionGap with the PRC[ 459 billion]Public: 121 billionGap without the PRC[ 308 billion]PRC People’s Republic of China.Note: Numbers may not add up to total due to rounding.Source: ADB (2017a) estimates.III.WHY HAVE ASIA’S SAVINGS LARGELY FAILED TO FINANCEITS INFRASTRUCTURE NEEDS?26.Leading economies in developing Asia have accumulated massive savings and foreign reservesin recent years. For example, while the People’s Republic of China (PRC) is still a developing economy,its total gross savings and foreign reserves exceed many advanced economies in Europe and America,including the United States (US). However, as noted, Asia’s efforts to draw on its own foreign exchangesavings and reserves to fund the region’s investment have been weak, and this is not limited toinfrastructure. Addressing this paradox may lead to the fundamental solution for the infrastructurein
Sungsup Ra and Zhigang Li ADB SOUTH ASIA WORKING PAPER SERIES NO. 57 June 2018. ADB South Asia Working Paper Series . ADB cannot be held liable for any claims that arise as a result of your use of the material. Please contact pubsmarketing@adb.org if you have questions or comments with respect to content, or if you wish .