Transcription
BRITE ADVISORY GROUP LTDGBP Portfolios 1-7Asset Breakdown
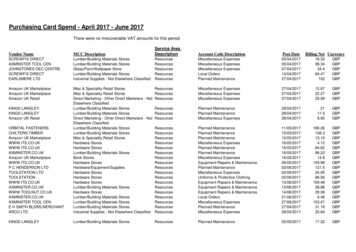
Portfolio 1CautiousPortfolio: GB - P1Timeframe: 31/1/2005 - 29/7/2022Currency: GBPPerformanceTotal Return(P) in %2005/1/31 to 2022/7/29Total Return(B) in %Benchmark: Custom FTSE All World Index / Bloomberg Barclays UK Gilt All Bond Gross Price - 50/50Brite Advisors pension portfolios offer clients a distinct advantage as they provide a low cost, end to end solution. This transparentinvestment approach broadly tracks the market delivering better returns and over time consistently growing clients’ retirement savings.Minimum investment is 20,000.P rreflects hypothetical backtested performance of the underlying benchmarks for the ETFs held in portfolio and does notinclude annual rebalancing.Past performance is not an indicator of future performance.B composite benchmark reflecting performance since inception date of 50% held in the FTSE All-World Index and 50% heldin the Bloomberg Barclays UK Gilt All Bond Gross Price and does not include any annual rebalancing.Proxy Holdings For BacktestingFTSE Asia XJPMSCI EM IMIMSCI Europe ex UK Hedged TRCRSP US Total Market TRGBP Index Link GiltsTAWNT09U IndexMIMUEMRN IndexM0EUGHGB IndexCRSPTMT IndexBCIU1T IndexUK Gilts 05YRBloomberg Barclays GBP Corp Bond TRFTSE 100 Net TaxMS Long Gold GBP Hedge IndexBloomberg Commodity IndexiShares Global REIT ETFFTRFBGL IndexLC61TRGU IndexTUKXG IndexMSCEGLDG IndexBCOMTR IndexRNXG IndexGB P1 vs BenchmarkPerformance in % as of 29/7/20223 MONTHSBenchmarkTotal ReturnPortfolio-3.45%Standard Deviation (Annualized)1 YEAR-1.42%-6.72%9.00%9.44%Total ReturnStandard Deviation (Annualized)5 YEARS-2.23%Total Return arkStandard Deviation (Annualized)15 02%8.40%Total Return (Annualized)Standard Deviation (Annualized)Benchmark6.12%Asset ClassHoldings - Portfolio P1as of 90USDiShares GBP Index Link GiltsINXG21.00%IE00B1FZSD53GBPVanguard FTSE Pacific ex JPNVAPX15.63%IE00B9F5YL18GBPWT Physical Gold-Gbp HedgeGBSP12.00%JE00B7VG2M16GBPiShares FTSE 100ISF5.63%IE0005042456GBPiShares UK Gilts 05YRIGLS4.50%IE00B4WXJK79GBPSPDR GBP Corporate BondUKCO4.50%IE00B4694Z11GBPAberdeen Standard All Commodity Strategy K-1 ETFBCI4.00%US0032611040USDiShares Global REIT ETFREET US4.00%US46434V6478USDiShares MSCI EM IMIEMIM1.88%IE00BKM4GZ66GBPiShares MSCI Europe GBP HG XUKEUXS1.88%IE00BVDPJP67GBPHoldings NameVanguard Total US Stock MarketThe total expense ratio of the portfolio is 0.14%.SymbolDeveloped Markets42.51%Emerging Markets1.88%Domestic Markets5.63%Fixed Income30.00%Commodities16.00%Real Estate4.00%
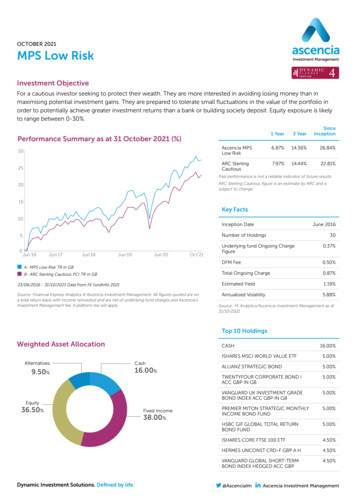
Portfolio 2ConservativePortfolio: GB - P2Currency: GBPPerformanceTotal Return(P) in %2005/1/31 to 2022/7/29Total Return(B) in %Benchmark: Custom FTSE All World Index / Bloomberg Barclays UK Gilt All Bond Gross Price - 55/45Brite Advisors pension portfolios offer clients a distinct advantage as they provide a low cost, end to end solution. This transparentinvestment approach broadly tracks the market delivering better returns and over time consistently growing clients’ retirement savings.Minimum investment is 20,000.P reflects hypothetical backtested performance of the underlying benchmarks for the ETFs held in portfolio and does notinclude annual rebalancing.Past performance is not an indicator of future performance.B composite benchmark reflecting performance since inception date of 55% held in the FTSE All-World Index and 45% heldin the Bloomberg Barclays UK Gilt All Bond Gross Price and does not include any annual rebalancing.Proxy Holdings For BacktestingFTSE Asia XJPMSCI EM IMIMSCI Europe ex UK Hedged TRCRSP US Total Market TRGBP Index Link GiltsTAWNT09U IndexMIMUEMRN IndexM0EUGHGB IndexCRSPTMT IndexBCIU1T IndexUK Gilts 05YRBloomberg Barclays GBP Corp Bond TRFTSE 100 Net TaxMS Long Gold GBP Hedge IndexBloomberg Commodity IndexiShares Global REIT ETFFTRFBGL IndexLC61TRGU IndexTUKXG IndexMSCEGLDG IndexBCOMTR IndexRNXG IndexGB P2 vs BenchmarkPerformance in % as of 29/7/20223 MONTHSBenchmarkTotal ReturnPortfolio-3.25%Standard Deviation (Annualized)1 YEAR-0.77%-5.77%9.17%9.73%Total ReturnStandard Deviation (Annualized)5 YEARS-2.11%Total Return arkStandard Deviation (Annualized)15 .58%9.04%Total Return (Annualized)Standard Deviation (Annualized)Benchmark7.09%Asset ClassHoldings - Portfolio P2as of 90USDiShares GBP Index Link GiltsINXG18.20%IE00B1FZSD53GBPVanguard FTSE Pacific ex JPNVAPX17.19%IE00B9F5YL18GBPWT Physical Gold-Gbp HedgeGBSP11.40%JE00B7VG2M16GBPiShares FTSE 100ISF6.19%IE0005042456GBPiShares UK Gilts 05YRIGLS3.90%IE00B4WXJK79GBPSPDR GBP Corporate BondUKCO3.90%IE00B4694Z11GBPAberdeen Standard All Commodity Strategy K-1 ETFBCI3.80%US0032611040USDiShares Global REIT ETFREET US3.80%US46434V6478USDiShares MSCI EM IMIEMIM2.06%IE00BKM4GZ66GBPiShares MSCI Europe GBP HG XUKEUXS2.06%IE00BVDPJP67GBPHoldings NameVanguard Total US Stock MarketThe total expense ratio of the portfolio is 0.14%.SymbolDeveloped Markets46.75%Emerging Markets2.06%Domestic Markets6.19%Fixed Income26.00%Commodities15.20%Real Estate3.80%
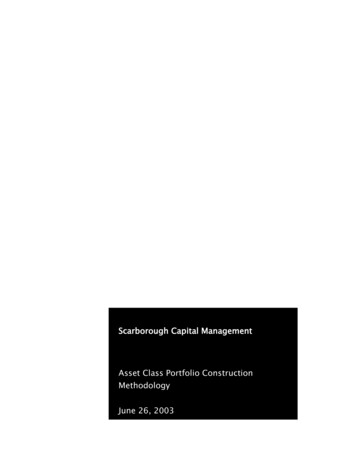
Portfolio 3Careful GrowthPortfolio: GB - P3Currency: GBPPerformanceTotal Return(P) in %2005/1/31 to 2022/7/29Total Return(B) in %Benchmark: Custom FTSE All World Index / Bloomberg Barclays UK Gilt All Bond Gross Price - 60/40Brite Advisors pension portfolios offer clients a distinct advantage as they provide a low cost, end to end solution. This transparentinvestment approach broadly tracks the market delivering better returns and over time consistently growing clients’ retirement savings.Minimum investment is 20,000.P reflects hypothetical backtested performance of the underlying benchmarks for the ETFs held in portfolio and does notinclude annual rebalancing.Past performance is not an indicator of future performance.B composite benchmark reflecting performance since inception date of 60% held in the FTSE All-World Index and 40% heldin the Bloomberg Barclays UK Gilt All Bond Gross Price and does not include any annual rebalancing.Proxy Holdings For BacktestingFTSE Asia XJPMSCI EM IMIMSCI Europe ex UK Hedged TRCRSP US Total Market TRGBP Index Link GiltsTAWNT09U IndexMIMUEMRN IndexM0EUGHGB IndexCRSPTMT IndexBCIU1T IndexUK Gilts 05YRBloomberg Barclays GBP Corp Bond TRFTSE 100 Net TaxMS Long Gold GBP Hedge IndexBloomberg Commodity IndexiShares Global REIT ETFFTRFBGL IndexLC61TRGU IndexTUKXG IndexMSCEGLDG IndexBCOMTR IndexRNXG IndexGB P3 vs BenchmarkPerformance in % as of 29/7/20223 MONTHSTotal ReturnPortfolio-3.05%Standard Deviation (Annualized)1 YEARTotal ReturnStandard Deviation (Annualized)Benchmark5 YEARS-2.00%Total Return 75%10.03%BenchmarkStandard Deviation (Annualized)15 Total Return (Annualized)14.23%10.03%9.44%10.09%Standard Deviation (Annualized)10.23%9.73%Asset ClassHoldings - Portfolio P3as of 90USDVanguard FTSE Pacific ex JPNVAPX18.75%IE00B9F5YL18GBPiShares GBP Index Link GiltsINXG15.40%IE00B1FZSD53GBPWT Physical Gold-Gbp HedgeGBSP10.80%JE00B7VG2M16GBPiShares FTSE 100ISF6.75%IE0005042456GBPAberdeen Standard All Commodity Strategy K-1 ETFBCI3.60%US0032611040USDiShares Global REIT ETFREET US3.60%US46434V6478USDiShares UK Gilts 05YRIGLS3.30%IE00B4WXJK79GBPSPDR GBP Corporate BondUKCO3.30%IE00B4694Z11GBPiShares MSCI EM IMIEMIM2.25%IE00BKM4GZ66GBPiShares MSCI Europe GBP HG XUKEUXS2.25%IE00BVDPJP67GBPHoldings NameVanguard Total US Stock MarketThe total expense ratio of the portfolio is 0.14%.SymbolDeveloped Markets51.00%Emerging Markets2.25%Domestic Markets6.75%Fixed Income22.00%Commodities14.40%Real Estate3.60%
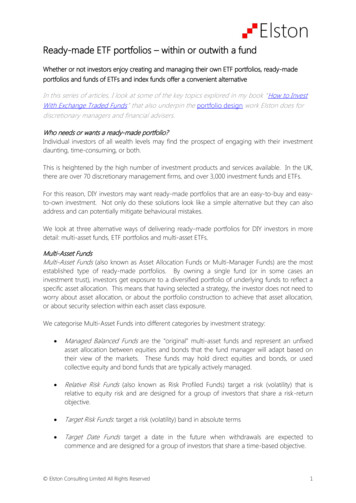
Portfolio 4BalancedPortfolio: GB - P4Currency: GBPPerformanceTotal Return(P) in %2005/1/31 to 2022/7/29Total Return(B) in %Benchmark: Custom FTSE All World Index / Bloomberg Barclays UK Gilt All Bond Gross Price - 65/35Brite Advisors pension portfolios offer clients a distinct advantage as they provide a low cost, end to end solution. This transparentinvestment approach broadly tracks the market delivering better returns and over time consistently growing clients’ retirement savings.Minimum investment is 20,000.P reflects hypothetical backtested performance of the underlying benchmarks for the ETFs held in portfolio and does notinclude annual rebalancing.Past performance is not an indicator of future performance.B composite benchmark reflecting performance since inception date of 65% held in the FTSE All-World Index and 35% heldin the Bloomberg Barclays UK Gilt All Bond Gross Price and does not include any annual rebalancing.Proxy Holdings For BacktestingFTSE Asia XJPMSCI EM IMIMSCI Europe ex UK Hedged TRCRSP US Total Market TRGBP Index Link GiltsTAWNT09U IndexMIMUEMRN IndexM0EUGHGB IndexCRSPTMT IndexBCIU1T IndexUK Gilts 05YRBloomberg Barclays GBP Corp Bond TRFTSE 100 Net TaxMS Long Gold GBP Hedge IndexBloomberg Commodity IndexiShares Global REIT ETFFTRFBGL IndexLC61TRGU IndexTUKXG IndexMSCEGLDG IndexBCOMTR IndexRNXG IndexGB P4 vs BenchmarkPerformance in % as of 29/7/20223 MONTHSTotal ReturnStandard Deviation (Annualized)1 4.39%Benchmark5 YEARSTotal Return (Annualized)Portfolio12.04%Benchmark9.06%Standard Deviation (Annualized)15 YEARS11.21%10.69%PortfolioBenchmarkTotal Return0.52%-3.85%Total Return (Annualized)14.75%10.77%Standard Deviation (Annualized)9.78%10.52%Standard Deviation (Annualized)10.95%10.47%Asset ClassHoldings - Portfolio P4as of 90USDVanguard FTSE Pacific ex JPNVAPX20.31%IE00B9F5YL18GBPiShares GBP Index Link GiltsINXG12.60%IE00B1FZSD53GBPWT Physical Gold-Gbp HedgeGBSP10.20%JE00B7VG2M16GBPiShares FTSE 100ISF7.31%IE0005042456GBPAberdeen Standard All Commodity Strategy K-1 ETFBCI3.40%US0032611040USDiShares Global REIT ETFREET US3.40%US46434V6478USDiShares UK Gilts 05YRIGLS2.70%IE00B4WXJK79GBPSPDR GBP Corporate BondUKCO2.70%IE00B4694Z11GBPiShares MSCI EM IMIEMIM2.44%IE00BKM4GZ66GBPiShares MSCI Europe GBP HG XUKEUXS2.44%IE00BVDPJP67GBPHoldings NameVanguard Total US Stock MarketThe total expense ratio of the portfolio is 0.13%.SymbolDeveloped Markets55.25%Emerging Markets2.44%Domestic Markets7.31%Fixed Income18.00%Commodities13.60%Real Estate3.40%
Portfolio 5ModeratePortfolio: GB - P5Currency: GBPPerformanceTotal Return(P) in %2005/1/31 to 2022/7/29Total Return(B) in %Benchmark: Custom FTSE All World Index / Bloomberg Barclays UK Gilt All Bond Gross Price - 70/30Brite Advisors pension portfolios offer clients a distinct advantage as they provide a low cost, end to end solution. This transparentinvestment approach broadly tracks the market delivering better returns and over time consistently growing clients’ retirement savings.Minimum investment is 20,000.P reflects hypothetical backtested performance of the underlying benchmarks for the ETFs held in portfolio and does notinclude annual rebalancing.Past performance is not an indicator of future performance.B composite benchmark reflecting performance since inception date of 70% held in the FTSE All-World Index and 30% heldin the Bloomberg Barclays UK Gilt All Bond Gross Price and does not include any annual rebalancing.Proxy Holdings For BacktestingFTSE Asia XJPMSCI EM IMIMSCI Europe ex UK Hedged TRCRSP US Total Market TRGBP Index Link GiltsTAWNT09U IndexMIMUEMRN IndexM0EUGHGB IndexCRSPTMT IndexBCIU1T IndexUK Gilts 05YRBloomberg Barclays GBP Corp Bond TRFTSE 100 Net TaxMS Long Gold GBP Hedge IndexBloomberg Commodity IndexiShares Global REIT ETFFTRFBGL IndexLC61TRGU IndexTUKXG IndexMSCEGLDG IndexBCOMTR IndexRNXG IndexGB P5 vs BenchmarkPerformance in % as of 29/7/20223 MONTHSTotal ReturnPortfolio-2.66%Standard Deviation (Annualized)1 YEARBenchmark5 YEARS-1.78%Total Return .10%11.39%BenchmarkStandard Deviation (Annualized)15 YEARS11.83%PortfolioPortfolioBenchmarkTotal Return1.16%-2.90%Total Return (Annualized)15.27%11.52%Standard Deviation (Annualized)10.19%11.02%Standard Deviation (Annualized)11.76%11.24%Asset ClassHoldings - Portfolio P5as of 90USDVanguard FTSE Pacific ex JPNVAPX21.88%IE00B9F5YL18GBPiShares GBP Index Link GiltsINXG9.80%IE00B1FZSD53GBPWT Physical Gold-Gbp HedgeGBSP9.60%JE00B7VG2M16GBPiShares FTSE 100ISF7.88%IE0005042456GBPAberdeen Standard All Commodity Strategy K-1 ETFBCI3.20%US0032611040USDiShares Global REIT ETFREET US3.20%US46434V6478USDiShares MSCI EM IMIEMIM2.63%IE00BKM4GZ66GBPiShares MSCI Europe GBP HG XUKEUXS2.63%IE00BVDPJP67GBPiShares UK Gilts 05YRIGLS2.10%IE00B4WXJK79GBPSPDR GBP Corporate BondUKCO2.10%IE00B4694Z11GBPHoldings NameVanguard Total US Stock MarketThe total expense ratio of the portfolio is 0.13%.SymbolDeveloped Markets59.51%Emerging Markets2.63%Domestic Markets7.88%Fixed Income14.00%Commodities12.80%Real Estate3.20%
Portfolio 6BoldPortfolio: GB - P6Currency: GBPPerformanceTotal Return(P) in %2005/1/31 to 2022/7/29Total Return(B) in %Benchmark: Custom FTSE All World Index / Bloomberg Barclays UK Gilt All Bond Gross Price - 75/25Brite Advisors pension portfolios offer clients a distinct advantage as they provide a low cost, end to end solution. This transparentinvestment approach broadly tracks the market delivering better returns and over time consistently growing clients’ retirement savings.Minimum investment is 20,000.P reflects hypothetical backtested performance of the underlying benchmarks for the ETFs held in portfolio and does notinclude annual rebalancing.Past performance is not an indicator of future performance.B composite benchmark reflecting performance since inception date of 75% held in the FTSE All-World Index and 25% heldin the Bloomberg Barclays UK Gilt All Bond Gross Price and does not include any annual rebalancing.Proxy Holdings For BacktestingFTSE Asia XJPMSCI EM IMIMSCI Europe ex UK Hedged TRCRSP US Total Market TRGBP Index Link GiltsTAWNT09U IndexMIMUEMRN IndexM0EUGHGB IndexCRSPTMT IndexBCIU1T IndexUK Gilts 05YRBloomberg Barclays GBP Corp Bond TRFTSE 100 Net TaxMS Long Gold GBP Hedge IndexBloomberg Commodity IndexiShares Global REIT ETFFTRFBGL IndexLC61TRGU IndexTUKXG IndexMSCEGLDG IndexBCOMTR IndexRNXG IndexGB P6 vs BenchmarkPerformance in % as of 29/7/20223 MONTHSTotal ReturnPortfolio-2.48%Standard Deviation (Annualized)1 YEARBenchmark5 YEARS-1.68%Total Return .86%12.13%BenchmarkStandard Deviation (Annualized)15 YEARS12.49%PortfolioPortfolioBenchmarkTotal Return1.79%-1.94%Total Return (Annualized)15.81%12.27%Standard Deviation (Annualized)10.67%11.57%Standard Deviation (Annualized)12.64%12.04%Asset ClassHoldings - Portfolio P6as of 90USDVanguard FTSE Pacific ex JPNVAPX23.44%IE00B9F5YL18GBPWT Physical Gold-Gbp HedgeGBSP9.00%JE00B7VG2M16GBPiShares FTSE 100ISF8.44%IE0005042456GBPiShares GBP Index Link GiltsINXG7.00%IE00B1FZSD53GBPAberdeen Standard All Commodity Strategy K-1 ETFBCI3.00%US0032611040USDiShares Global REIT ETFREET US3.00%US46434V6478USDiShares MSCI EM IMIEMIM2.81%IE00BKM4GZ66GBPiShares MSCI Europe GBP HG XUKEUXS2.81%IE00BVDPJP67GBPiShares UK Gilts 05YRIGLS1.50%IE00B4WXJK79GBPSPDR GBP Corporate BondUKCO1.50%IE00B4694Z11GBPHoldings NameVanguard Total US Stock MarketThe total expense ratio of the portfolio is 0.13%.SymbolDeveloped Markets63.75%Emerging Markets2.81%Domestic Markets8.44%Fixed Income10.00%Commodities12.00%Real Estate3.00%
Portfolio 7AggressivePortfolio: GB - P7Currency: GBPPerformanceTotal Return(P) in %2005/1/31 to 2022/7/29Total Return(B) in %Benchmark: Custom FTSE All World Index / Bloomberg Barclays UK Gilt All Bond Gross Price - 80/20Brite Advisors pension portfolios offer clients a distinct advantage as they provide a low cost, end to end solution. This transparentinvestment approach broadly tracks the market delivering better returns and over time consistently growing clients’ retirement savings.Minimum investment is 20,000.P reflects hypothetical backtested performance of the underlying benchmarks for the ETFs held in portfolio and does notinclude annual rebalancing.Past performance is not an indicator of future performance.B composite benchmark reflecting performance since inception date of 80% held in the FTSE All-World Index and 20% heldin the Bloomberg Barclays UK Gilt All Bond Gross Price and does not include any annual rebalancing.Proxy Holdings For BacktestingFTSE Asia XJPMSCI EM IMIMSCI Europe ex UK Hedged TRCRSP US Total Market TRGBP Index Link GiltsTAWNT09U IndexMIMUEMRN IndexM0EUGHGB IndexCRSPTMT IndexBCIU1T IndexUK Gilts 05YRBloomberg Barclays GBP Corp Bond TRFTSE 100 Net TaxMS Long Gold GBP Hedge IndexBloomberg Commodity IndexiShares Global REIT ETFFTRFBGL IndexLC61TRGU IndexTUKXG IndexMSCEGLDG IndexBCOMTR IndexRNXG IndexGB P7 vs BenchmarkPerformance in % as of 29/7/20223 MONTHSTotal ReturnPortfolio-2.29%Standard Deviation (Annualized)1 YEARTotal ReturnStandard Deviation (Annualized)Benchmark5 YEARS-1.58%Total Return .67%12.89%BenchmarkStandard Deviation (Annualized)15 otal Return (Annualized)16.37%13.02%11.20%12.16%Standard Deviation (Annualized)13.60%12.86%Asset ClassHoldings - Portfolio P7as of 90USDVanguard FTSE Pacific ex JPNVAPX25.00%IE00B9F5YL18GBPiShares FTSE 100ISF9.00%IE0005042456GBPWT Physical Gold-Gbp HedgeGBSP8.40%JE00B7VG2M16GBPiShares GBP Index Link GiltsINXG4.20%IE00B1FZSD53GBPiShares MSCI EM IMIEMIM3.00%IE00BKM4GZ66GBPiShares MSCI Europe GBP HG XUKEUXS3.00%IE00BVDPJP67GBPAberdeen Standard All Commodity Strategy K-1 ETFBCI2.80%US0032611040USDiShares Global REIT ETFREET US2.80%US46434V6478USDiShares UK Gilts 05YRIGLS0.90%IE00B4WXJK79GBPSPDR GBP Corporate BondUKCO0.90%IE00B4694Z11GBPHoldings NameVanguard Total US Stock MarketThe total expense ratio of the portfolio is 0.12%.SymbolDeveloped Markets68.00%Emerging Markets3.00%Domestic Markets9.00%Fixed Income6.00%Commodities11.20%Real Estate2.80%
Bloomberg Commodity Index iShares Global REIT ETF TAWNT09U Index MIMUEMRN Index M0EUGHGB Index CRSPTMT Index BCIU1T Index FTSE Asia XJP MSCI EM IMI MSCI Europe ex UK Hedged TR CRSP US Total Market TR GBP Index Link Gilts Performance in % as of 29/7/2022 as of 29/7/2022 2005/1/31 to 2022/7/29-2.86% -1.89% 13.74% 14.39% Portfolio Benchmark .