Transcription
www.ark-invest.comJanuary 25, 2022Annual Research Report For Informational Purposes OnlyARK Investment Management LLC. This is not a recommendation in relation to any named particular securities/cryptocurrencies and no warranty or guarantee is provided. Any references to particularsecurities/cryptocurrencies are for illustrative purposes only. There is no assurance that the Adviser will make any investments with the same or similar characteristics as any investment presented. The readershould not assume that an investment identified was or will be profitable. PAST PERFORMANCE IS NOT INDICATIVE OF FUTURE PERFORMANCE, FUTURE RETURNS ARE NOT GUARANTEED.
2 DISCLOSURERisks of Investing in InnovationPlease note: Companies that ARK believes are capitalizing on disruptive innovation and developing technologies to displace older technologiesor create new markets may not in fact do so. ARK aims to educate investors and seeks to size the potential investment opportunity, noting that risksand uncertainties may impact our projections and research models. Investors should use the content presented for informational purposes only,and be aware of market risk, disruptive innovation risk, regulatory risk, and risks related to certain innovation areas.Please read risk disclosure carefully.RISK OF INVESTING IN INNOVATIONRapid Pace of ChangeExposure Across Sectors and Market CapUncertainty and Unknownsà Aim for a cross-sector understanding of technologyand combine top-down and bottom-up research.Source: ARK Investment Management LLC, 2021Regulatory HurdlesDisruptiveInnovationPolitical or Legal PressureCompetitive Landscapeà Aim to understand the regulatory, market, sector,and company risks. (See Risk and Disclosure Page)
3 Disruptive InnovationBig Ideas 2022: Change & ConvergenceWhen has investing not been about the future?Change appears to happen slowly and then all at once. Over time,innovation should displace industry incumbents, increaseefficiencies, and gain majority market share. With the rightunderstanding of disruptive innovation and a long-term timehorizon, we believe investors will capture exponential growthopportunities, which deserve a strategic allocation in theirportfolios. For this reason, ARK focuses on opportunities likely toscale as technologies converge, transforming entire industries.To enlighten investors on the impact of breakthrough technologieswe began publishing Big Ideas in 2017. This annual research reportseeks to highlight our most provocative research conclusions forthe coming year. We hope you enjoy our Big Ideas for 2022.Forecasts are inherently limited and cannot be relied upon. For informational purposes only and should not be considered investment advice, or a recommendation to buy, sell or hold any particular security.Source: ARK Investment Management LLC, 2021
4 Big Ideas 2022 - ReportIntroduction5Gene Editing77Artificial Intelligence14Multi-Omics84Digital Consumers24Electric Vehicles93Digital Wallets30Autonomous Ride-Hail101Public Blockchains38Autonomous Logistics108Bitcoin443D Printing & Robotics114Ethereum & DeFi56Orbital Aerospace122Web366Source: ARK Investment Management LLC, 2021
5 Introduction to Big Ideas 2022Technologies Are ConvergingBrett Winton, Director of ResearchARK’s research is centered around the belief that fiveinnovation platforms are evolving and converging atthe same time: Artificial Intelligence, Robotics, EnergyStorage, DNA Sequencing, and Blockchain Technology.We identified 14 transformative technologies that areapproaching tipping points as costs drop, unleashingdemand across sectors and geographies and spawningmore innovation.We believe that historians will look back on this era asone of unprecedented technological foment—andthey will say: everything changed.Node Size: Log Prospective 2030 MarketEdge Size: ARK Convergence ScoreColor: Innovation PlatformForecasts are inherently limited and cannot be relied upon. For informational purposes only and should not be considered investment advice, or a recommendation to buy, sell or hold any particular security/cryptocurrency.ARK Investment Management LLC, 2021. Forecast is compilation of forecasts for the 14 technologies that ARK defines as underlying the 5 innovation platforms. Assumes that traditional equity market exposures continue to compound valueat a rate in excess of inflation and are not substantially disrupted or marked down by negative exposure to innovation. Cryptoassets are likely to be increasingly considered a different asset class by many; comparisons between cryptoassetvalues and equity market capitalization are cross-asset comparisons. Numbers rounded.Source: World Federation of Exchanges, ARK Investment Management LLC, 2021.
A R K B I GI D E A S2 0 2 2Digital WalletsUpending Traditional BankingResearch by Max Friedrich, ARK Analyst, and Nishita Jain, ARK Research AssociateToday, digital wallets like Venmo, Cash App, and others around the globe are penetratingtraditional financial services, including brokerage and lending, thanks to what we believe aresuperior user experiences and much lower costs of acquisition.In ARK’s view, digital wallets could scale at an annual rate of 69% in the US, from more than 400 billion in market capitalization to 5.7 trillion, and 78% globally, from 1.1 to 20 trillion,during the next five years.Forecasts are inherently limited and cannot be relied upon. For informational purposes only and should not be considered investment advice, or a recommendation to buy, sell or hold any particular security.Source: ARK Investment Management LLC, 2021www.ark-invest.com
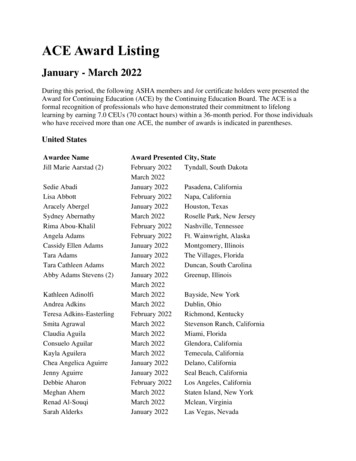
31 Digital WalletsDigital Wallets Are The Number One Payment Method Offline And OnlineDominating e-commerce payments since 2017, digital wallets surpassed cash last year in point-of-sales (POS) payments, likely inresponse to the COVID-19 pandemic.Top Payment Methods as Share of GlobalTop Payment Methods as Share of GlobalE-Commerce Purchase VolumePoint-of-Sales (POS) Purchase VolumeDigital WalletCredit CardBank TransferCash on DeliveryDebit CardDigital Wallet50%50%40%40%30%30%20%20%10%10%0%Credit CardDebit CardCash0%20162017201820192020For informational purposes only and should not be considered investment advice, or a recommendation to buy, sell or hold any particular security.Source: ARK Investment Management LLC, 2021; Worldpay Global Payments Report issues 2017, 2018, 2020, 2021. ARK estimates for 2017.201820192020
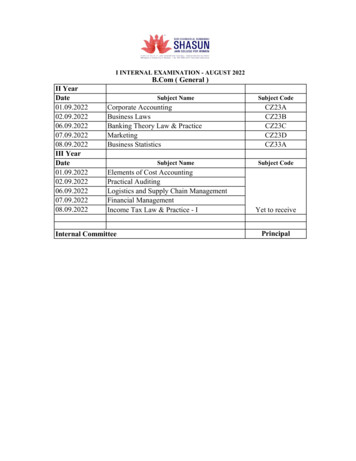
32 Digital WalletsThe Number Of Digital Wallet Users Has Surpassed The Number OfDeposit Account Holders At One Of The Largest US BanksBased on publicly available data, Square’s Cash App and PayPal’s Venmo have amassed 74 million and 82 million annual active users inthe past 8 and 11 years, respectively. J.P. Morgan hit 60 million deposit account holders after five acquisitions in more than 30 years.1J.P. Morgan De posit. Accounts90Cash App AAUsVenmo AAUs807060(Millions)Deposit Accounts / Annual Active UsersJ.P. Morgan Chase Deposit Accounts vs. Cash App and Venmo Annual Active Users (AAUs)5040Acquisition302010MergerChemical Bank,ManufacturersHanoverWashington MutualMergerChemical Bank,Chase Manhattan BankMergerChase ManhattanBank, J.P. MorganAcquisitionBank One01990 1991 1992 1993 1994 1995 1996 1997 1998 1999 2000 2001 2002 2003 2004 2005 2006 2007 2008 2009 2010 2011 2012 2013 2014 2015 2016 2017 2018 2019 2020 2021Forecasts are inherently limited and cannot be relied upon. For informational purposes only and should not be considered investment advice, or a recommendation to buy, sell or hold any particular security.[1] Refers to number of J.P. Morgan Chase deposit accounts 100,000 prior to 2010 and number of deposit accounts 250,000 after 2010 due to changing reporting regulation.Source: ARK Investment Management LLC, 2021, based on data sourced from: Federal Deposit Insurance Corporation (FDIC) Statistics on Depository Institutions (SDI) and RIS.
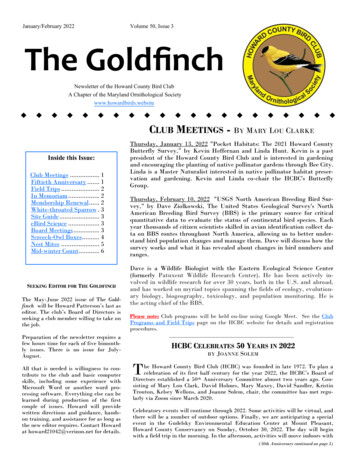
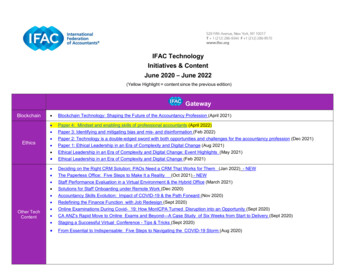
33 Digital WalletsDigital Wallets Are Differentiated By Customer Acquisition StrategiesCustomerAcquisitionPeer-to-Peer (P2P)Land and ExpandVertical Integration intoFinancial ServicesMerchant-FirstMarketStructureDeveloped or developing marketssuffering from friction in P2P orcross-border paymentsDeveloped or developing marketswith opportunities to optimize asingle use case in financial servicesDeveloping markets with lowfinancial services penetrationMostly developed marketswith well-established financialservices, making (P2P) payments anunattractive customeracquisition strategyStrategyGrowing P2P networks organically,sometimes accelerated bypartnerships with brandsor influencersLeveraging trust with customers tocross-sell other productsExpanding into financial services,often with giveawaysor rewardsUsing relationships with establishedmerchants to acquire retailcustomers, mostly throughcash-back campaignsExamplesForecasts are inherently limited and cannot be relied upon. For informational purposes only and should not be considered investment advice, or a recommendation to buy, sell or hold any particular security.Source: ARK Investment Management LLC, 2021
34 Digital WalletsDifferentiated Customer Acquisition Strategies Result InLower Customer Acquisition CostsOn a net basis, traditional banks in the US spend roughly 750 inpaid marketing and roughly 2500 in total, including the occupancyexpenses for branch networks, to acquire a new customerBased on network effects, viral marketing, and arguably superior valuepropositions, digital wallet providers spend as little as 1 to acquirenew customers, giving them room to invest and move up-market.Customer Acquisition Costs: Digital Wallets vs. US Banks 2,500 2,500 2,000 1,500 1,000 750 500 - 1 5 18 26NubankCash AppTinkoff BankKaspiFor informational purposes only and should not be considered investment advice, or a recommendation to buy, sell or hold any particular security.Source: ARK Investment Management LLC, 2021, Company information and ARK EstimatesUS Banks: Paid MarketingUS Banks: Paid Marketingand Occupancy Costs
35 Digital WalletsEach Digital Wallet User In The USCould Be Worth 22,500 At MaturityPotential Value Per Average Digital Wallet User (U.S.) 30,000per average US user.Beyond financial services, digital wallets could becomelead-generation platforms for offline and online commerce,potentially adding more than 12,000 to their net presentvalue per user.Digital wallets also could serve as on-ramps to Web3 assets,such as NFTs. ARK estimates that such Web3 monetizationcould add 1,700 to their net present value per user. 25,000Value Per User (USD)If digital wallets were to become consumer financialdashboards, ARK estimates that the net present value oftheir financial service revenues would be roughly 10,000 12,400 22,500 20,000 15,000 10,000 2,400 1,200 1,700 2,300 5,000 700 1,800 &CodMngkinecoinndit lToForecasts are inherently limited and cannot be relied upon. For informational purposes only and should not be considered investment advice, or a recommendation to buy, sell or hold any particular security.Source: ARK Investment Management LLC, 2021. All net present value estimates based on 2020 or 2021, except web3. Offline/Online Commerce assumes digital wallet captures lead generation fee for 100% of offlineand online average US consumer retail spend. Insurance assumes digital wallet captures lead generation fee on average insurance revenue per US consumer. Saving and Spending Account assumes digital walletcaptures spread between interest rate and risk-free rate for average balance of US transaction accounts as defined by the Federal Reserve or lead generation fee on net interest income. Offline and Online Paymentsassumes digital wallet captures fee on 100% of offline and online average US consumer retail spend. Personal credit and mortgage assumes digital wallet captures spread between interest rate and risk-free rate forinterest income from average debt per adult in US or or lead-generation fee on net interest income. Investing assumes digital wallet captures revenue (excluding commissions) from average US brokerage andcryptocurrency exchange consumer. Web3 assumes digital wallet captures lead-generation or first party marketplace fee on 100% of 2026 web3 Gross Merchandise Value as forecasted by ARK.
36 Digital WalletsThe US Digital Wallet Opportunity Could Scale 69% At An Annual RateFrom More Than 400 Billion In 2021 To 5.7 Trillion In 2026.Penetration of Potential Value per Digital Wallet UserDigital Wallet Penetration ofSmartphone Users 2026 (US)Digital Wallet Users 2026 (US)Potential Valueper Digital WalletUser (US)5%10%25%50%75%100%Digital Wallet Opportunity (US)50%127 Million 140Billion 290Billion 710Billion 1.4Trillion 2.1Trillion 2.8Trillion75%190 Million 210Billion 420Billion 1Trillion 2.1Trillion 3.2Trillion 4.2Trillion100%250 Million 290Billion 570Billion 1.4Trillion 2.8Trillion 4.2Trillion 5.7Trillion 22,500If every US smartphone user,valued at 22,500 per user, wouldadopt a digital wallet by 2026.Forecasts are inherently limited and cannot be relied upon. For informational purposes only and should not be considered investment advice, or a recommendation to buy, sell or hold any particular security.Source: ARK Investment Management LLC, 2021.
37 Digital WalletsThe Global Digital Wallet Opportunity Could Scale 78% At An Annual RateFrom 1.1 Trillion To 20 Trillion In 2026.Digital Wallet Penetration ofSmartphone Users 2026Penetration of Potential Value per Digital Wallet UserDigital Wallet Users 2026(Global)(Global)Potential Value perDigital Wallet User(Global) 15%10%25%50%75%100%Digital Wallet Opportunity (Global)50%2.7 Billion 500Billion 1Trillion 2.5Trillion 5Trillion 7.7Trillion 10Trillion75%4.1 Billion 750Billion 1.5Trillion 3.8Trillion 7.7Trillion 12Trillion 15Trillion 1Trillion 2Trillion 5Trillion 10Trillion 15Trillion 20Trillion 3,800100%5.4 Billion1Applying ratio of Global GDP per Capita to US GDP per Capita to Potential Value per Digital WalletUser in US to estimate Global Potential Value per Digital Wallet UserIf every global smartphone user,valued at 3,800 per user, wouldadopt a digital wallet by 2026.Forecasts are inherently limited and cannot be relied upon. For informational purposes only and should not be considered investment advice, or a recommendation to buy, sell or hold any particular security.Source: ARK Investment Management LLC, 2021.
Financial Services Land and Expand Merchant-First Examples Market Structure Developing markets with low financial services penetration Developed or developing markets with opportunities to optimize a single use case in financial services Developed or developing markets suffering from friction in P2P or cross-border payments Mostly developed markets