Transcription
ALICE IN PENNSYLVANIA:A FINANCIAL HARDSHIP STUDY2020 PENNSYLVANIA REPORT
ALICE IN THE TIME OF COVID-19The release of this ALICE Report for Pennsylvania comes during an unprecedented crisis — the COVID-19pandemic. While our world changed significantly in March 2020 with the impact of this global, dual health andeconomic crisis, ALICE remains central to the story in every U.S. county and state. The pandemic has exposedexactly the issues of economic fragility, widespread hardship, and growing disparities — particularly by race andethnicity — that United For ALICE and the ALICE data work to reveal.That exposure makes the ALICE data and analysis more important than ever. The ALICE Report for Pennsylvaniapresents the latest ALICE data available — a point-in-time snapshot of economic conditions across the state in2018. By showing how many Pennsylvania households were struggling then, the ALICE Research provides thebackstory for why the COVID-19 crisis is having such a devastating economic impact. The ALICE data is especiallyimportant now to help advocates identify the most vulnerable in their communities, and direct programming andresources to assist them throughout the pandemic and the recovery that follows. And as Pennsylvania movesforward, this data can be used to estimate the impact of the crisis over time, providing an important baseline forchanges to come.This crisis is fast-moving and quickly evolving. To stay abreast of the impact of COVID-19 on ALICE householdsand their communities, visit our website at UnitedForALICE.org/COVID19 for updates.ALICE REPORT, 2020iPENNSYLVANIA
UNITED WAYS AND UNITED FUNDSIN PENNSYLVANIACentre County United WayUnited Way of Bedford CountyUnited Way of Mercer CountyClearfield Area United WayUnited Way of Berks CountyUnited Way of Mifflin-JuniataClinton County United WayUnited Way of Blair CountyUnited Way of Mon ValleyDu Bois Area United WayUnited Way of Bradford CountyUnited Way of Pike CountyThe Ellwood City Area United FundUnited Way of Bucks CountyUnited Way of Southern Chester CountyGreater Susquehanna ValleyUnited WayUnited Way of Carlisle& Cumberland CountyUnited Way of SouthwesternPennsylvaniaGreene County United WayUnited Way of Chester CountyUnited Way of the Boyertown AreaGrove City Area United WayUnited Way of Clarion CountyUnited Way of the Bradford AreaHuntingdon County United WayUnited Way of the Capital RegionKane Area United FundUnited Way of Columbia& Montour CountyLycoming County United WayUnited Way of Erie CountyUnited Way of the GreaterLehigh ValleyMansfield Area United FundUnited Way of Franklin CountyUnited Way of the Laurel HighlandsNorth Penn Area United FundUnited Way of Greater HazletonUnited Way of the Shippensburg AreaPocono Mountains United WayUnited Way of Greater Philadelphia& Southern New JerseyUnited Way of the Titusville RegionSchuylkill United WaySt. Marys Area United WayUnited Fund of the Corry AreaUnited Fund of Warren CountyUnited Way of Adams CountyUnited Way of Armstrong CountyUnited Way of Beaver CountyUnited Way of Indiana CountyUnited Way of Lackawanna andWayne CountiesUnited Way of Venango CountyUnited Way of WesternCrawford CountyUnited Way of Wyoming ValleyUnited Way of Lancaster CountyUnited Way of York CountyUnited Way of Lawrence CountyUnited Way Washington CountyUnited Way of Lebanon CountyWyoming County United WayNote: In addition to corporate sponsorships, this Report was made possible by the United Ways noted above in bold.Learn more about ALICE in Pennsylvania: www.uwp.org/ALICEAcknowledgmentsUnited Ways of Pennsylvania thank our sponsors, partners, and community advocates throughout the state for theirsupport and commitment to this 2020 ALICE Report for Pennsylvania. It is our hope that this Report will help raiseawareness of the 39% of households in the state who live in poverty or who are ALICE — Asset Limited, IncomeConstrained, Employed. Our goal is to inform and inspire policy and action to improve the lives of ALICE families.To learn more about how you can get involved in advocating and creating change for ALICE in Pennsylvania, contact:Rebecca O’Shea, roshea@uwp.org, 717-238-7365 x 204.To access the ALICE data and resources for Pennsylvania, go to UnitedForALICE.org/PennsylvaniaALICE REPORT, 2020iiPENNSYLVANIA
ALICE RESEARCHALICE Reports provide high-quality, research-based information to foster a better understanding of who is struggling inour communities. To produce the ALICE Report for Pennsylvania, our team of researchers collaborated with a ResearchAdvisory Committee composed of experts from across the state. Research Advisory Committee members fromour partner states also periodically review the ALICE Methodology. This collaborative model ensures that the ALICEReports present unbiased data that is replicable, easily updated on a regular basis, and sensitive to local context.Learn more about the ALICE Research Team on our website at UnitedForALICE.org/ALICE-TeamDirector and Lead Researcher: Stephanie Hoopes, Ph.D.Research Support Team:Andrew Abrahamson; Ashley Anglin, Ph.D.; Catherine Connelly, D.M.H.; Max Holdsworth, M.A.; Dan Treglia, Ph.D.ALICE Research Advisory Committee for PennsylvaniaWilliam A. Calo, Ph.D., J.D., M.P.H.Penn State College of MedicineJonathan Johnson, M.S.The Center for Rural PennsylvaniaVincent Cannizzaro, M.P.P.The Arthur J. Glatfelter Institute forPublic Policy, York College of PennsylvaniaBen Marsh, Ph.D.Bucknell UniversityScott Davis, M.S.Pennsylvania Housing Finance AgencyTeri Ooms, M.B.A.The Institute for Public Policy& Economic DevelopmentPaul R. Flora, M.U.R.P., M.A.Federal Reserve Bank of PhiladelphiaAdam Scavette, M.S.Federal Reserve Bank of PhiladelphiaKaren Grimm-Thomas, M.S.Pennsylvania Office of Child Developmentand Early LearningBerwood A. Yost, M.A.Floyd Institute for Public Policy, Center forOpinion Research, Franklin & Marshall CollegeJames P. Huguley, M.Ed., Ed.D.University of Pittsburgh School of Social Work,Center on Race and Social ProblemsALICE REPORT, 2020iiiPENNSYLVANIA
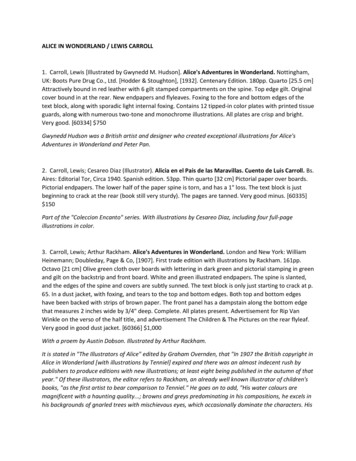
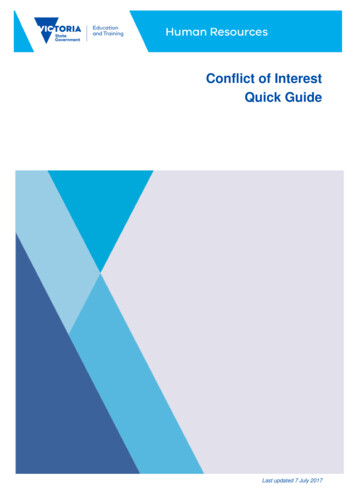
ALICE: A GRASSROOTS MOVEMENTThis body of research provides a framework, language, and tools to measure and understand the struggles of apopulation called ALICE — an acronym for Asset Limited, Income Constrained, Employed. ALICE represents the growingnumber of households in our communities that do not earn enough to afford basic necessities. Partnering with UnitedWays, nonprofits, academic institutions, corporations, and other state organizations, this research initiative providesdata to stimulate meaningful discussion, attract new partners, and ultimately inform strategies for positive change.Based on the overwhelming success of this research in identifying and articulating the needs of this vulnerablepopulation, this work has grown from a pilot in Morris County, New Jersey to 21 states and more than 648 United Ways.Together, United For ALICE partners can evaluate current initiatives and discover innovative approaches to improve lifefor ALICE and the wider community. To access Reports from all states, visit UnitedForALICE.orgNorth ganIllinois asNew oMassachusettsNew YorkIowaNebraskaNevadaMaineWisconsinSouth DakotaIdahoNew HampshireVermontNorthCarolinaRhode IslandConnecticutNew JerseyDelawareMarylandDistrict ai‘iStates With ReportsNATIONAL ALICE ADVISORY COUNCILThe following companies are major funders and supporters of this work:Aetna FoundationCompare.com DeloitteRWJBarnabas HealthALICE REPORT, 2020Allergan Alliant EnergyEntergy AT&T Johnson & JohnsonRobert Wood Johnson Foundationiv Atlantic Health System JLL Atlantic Union BankKaiser PermanenteThrivent Financial Foundation Key BankUPS U.S. VenturePENNSYLVANIA
WHAT’S NEW IN ALICE RESEARCHEvery two years, United For ALICE undertakes a full review of the ALICE Methodology to ensure that the ALICEmeasures are transparent, replicable, and current in order to accurately reflect how much income families needto live and work in the modern economy. In 2019, more than 40 external experts — drawn from the ResearchAdvisory Committees across our United For ALICE partner states — participated in the review process. A fulldescription of the Methodology and sources is available at UnitedForALICE.org/MethodologyThis Report includes the following improvements:More local variation: The ALICE budgets for housing, food, transportation, health care, and taxes incorporatemore local data. For housing, we differentiate counties within Metropolitan Statistical Areas using AmericanCommunity Survey gross rent estimates. For food, the U.S. Department of Agriculture’s Thrifty Food Plan isadjusted at the county level using Feeding America’s cost-of-meal data. For transportation, auto insurance isadded to new miles-traveled data (discussed in the next paragraph) to reflect different driving costs by state.For health care, out-of-pocket costs are provided by census region. And taxes now systematically include localincome tax, using data from the Tax Foundation.Better reflection of household composition: Transportation and health care budgets now better reflect costsfor different household members. The transportation budget for driving a car uses the Federal HighwayAdministration’s miles-traveled data, sorted by age and gender, and AAA’s cost-per-mile for a small or mediumsized car. The health care budget reflects employer-sponsored health insurance (the most common form in 2018,when it covered 49% of Americans1), using the employee’s contribution, plus out-of-pocket expenditures by ageand income, from the Agency for Healthcare Research and Quality Medical Expenditure Panel Survey.More variations by household size: The median household size in the U.S. is three people for householdsheaded by a person under age 65 and two people for households headed by seniors (65 ).2 Reflecting thisreality, the Household Survival Budgets are presented in new variations, including a Senior Survival Budget. Thewebsite provides data to create budgets for households with any combination of adults and children. The ALICEThreshold has also been adjusted to incorporate the most common modern household compositions. Thesenew budget variations are included in the County Profile and Household Budget pages onUnitedForALICE.org/PennsylvaniaNew ALICE measures: The Senior Survival Budget more accurately represents household costs for people age 65 and over. Housingand technology remain constant; however, some costs are lower — transportation, food, and health insurancepremiums (due to Medicare) — while others are higher, especially out-of-pocket health costs. Because over 90%of seniors have at least one chronic condition, the Senior Survival Budget includes the additional cost of treatingthe average of the five most common chronic diseases. The ALICE Essentials Index is a standardized measure of the change over time in the costs of essentialhousehold goods and services, calculated for both urban and rural areas. It can be used as a companion to theBureau of Labor Statistics’ (BLS) Consumer Price Index, which covers all goods and services that families at allincome levels buy regularly.Data Notes: The data are estimates; some are geographic averages, others are one- or five-year averagesdepending on population size. Change-over-time ranges start with 2007, before the Great Recession, thenmeasure change every two years from 2010 to 2018. County-level data remains the primary focus, as stateaverages mask significant differences between counties. For example, the share of households below the ALICEThreshold in Pennsylvania ranges from 27% in Chester County to 51% in Philadelphia and Potter counties. Manypercentages are rounded to whole numbers, sometimes resulting in percentages totaling 99% or 101%. Themethodological improvements included in this Report have been applied to previous years to allow for accurateyear-over-year comparisons. This means that, due to improved sources and calculations, some numbers andpercentages at the state and county level may not match those reported in the previous ALICE Report forPennsylvania.ALICE REPORT, 2020vPENNSYLVANIA
TABLE OF CONTENTSAsset Limited, Income Constrained, Employed 1At-A-Glance: Pennsylvania 3Who Is ALICE? 6Trends: Household Demographics 8The Cost of Living in Pennsylvania 10The ALICE Household Budgets 10The ALICE Essentials Index 12Trends: Cost of Living 13The Changing Landscape of Work in Pennsylvania 16The New Labor Force 18ALICE Jobs: Maintaining the Economy 20Trends: The Landscape of Work 22Next Steps: Data for Action 24Identifying Gaps 24Understanding ALICE: Health, Education, and Social Factors 26The Benefits of Moving Toward INCOME Equity in Pennsylvania 27Appendix 31Endnotes 32Figure 12: Sources 44ALICE REPORT, 2020viPENNSYLVANIA
ASSET LIMITED, INCOME CONSTRAINED, EMPLOYEDFrom 2010 to 2018, Pennsylvania showed steadyeconomic improvements according to traditionalmeasures. Unemployment in the state and across theU.S. fell to historic lows, GDP grew, and wages roseslightly. Yet in 2018, eight years after the end of the GreatRecession, 39% of Pennsylvania’s 5,067,682 householdsstill struggled to make ends meet. And while 12% of thesehouseholds were living below the Federal Poverty Level(FPL), another 27% — more than twice as many — wereALICE households: Asset Limited, Income Constrained,Employed. These households earned above the FPL, butnot enough to afford basic household necessities.12%61%Poverty27%ALICEAbove ALICEThresholdThis Report provides new data and tools that explain thepersistent level of hardship faced by ALICE households, revealing aspects of the Pennsylvania economy not tracked bytraditional economic measures. The Report highlights three critical trends: The cost of living is increasing for ALICE households. From 2007 to 2018, the cost of household essentials(housing, child care, food, transportation, health care, and technology) increased faster than the cost of other goodsand services. The ALICE Essentials Index, a new tool that measures change over time in the cost of essentials,increased at an average rate of 3.4% annually nationwide over the past decade, while the official rate of inflationwas 1.8%. Worker vulnerability is increasing while wages stagnate in ALICE jobs. By 2018, a near-record-low number ofpeople were reported to be unemployed. However, that low unemployment concealed three trends that exposeALICE workers to greater risk: growth in the number of low-wage jobs, minimal increases in wages, and morefluctuations in job hours, schedules, and benefits that make it harder to budget and plan. These trends were clearin 2018: A record number of Pennsylvania workers — 56% — were paid by the hour, and 58% of the state’s jobs paidless than 20 per hour. The number of ALICE households is increasing in Pennsylvania as a result of rising costs and stagnant wages.There are more than twice the number of ALICE households than households in poverty, and the number of ALICEhouseholds is increasing at a faster rate. The FPL, with its minimal and uniform national estimate of the cost ofliving, far underestimates the number of households that cannot afford to live and work in the modern economy. InPennsylvania, the percentage of households that were ALICE rose from 21% in 2007 to 27% in 2018. By contrast,those in poverty remained at around 13% throughout the period.This Report provides critical measures that assess Pennsylvania’s economy from four perspectives: They track financialhardship over time and across demographic groups; quantify the basic cost of living in Pennsylvania; assess job trends;and identify gaps in assistance and community resources. These measures also debunk assumptions and stereotypesabout low-income workers and families. ALICE households are as diverse as the general population, composed of peopleof all ages, genders, races, and ethnicities, living in rural, urban, and suburban areas.The Report concludes with an analysis of the economic benefits if all households had income above the ALICEThreshold. Not only would there be a significant positive impact on families and their communities, but the stateeconomy would also benefit. In fact, the added value to the Pennsylvania GDP would be approximately 130.2 billion.This Report and its measures are tools to help advocates increase public awareness, ask the right questions, reducevulnerabilities, remove obstacles to advancement, identify gaps in community resources, build a stronger workforce, andimplement programs and policies that help put financial stability within reach for ALICE households. With the magnitudeof financial hardship revealed, these actions can help move all households toward a more equitable economy, and ensurethat no one is left behind in harder times.ALICE REPORT, 20201PENNSYLVANIA
GLOSSARYALICE is an acronym that stands for Asset Limited, Income Constrained, Employed — households with incomeabove the Federal Poverty Level but below the basic cost of living. A household consists of all the people whooccupy a housing unit. In this Report, households do not include those living in group quarters such as a dorm,nursing home, or prison.The Household Survival Budget estimates the actual bare-minimum costs of basic necessities (housing, childcare, food, transportation, health care, and a basic smartphone plan) in Pennsylvania, adjusted for differentcounties and household types.The Senior Survival Budget incorporates specific cost estimates for seniors for food, transportation, and healthcare, reflecting key differences in household expenses by age.The Household Stability Budget calculates the costs of supporting and sustaining an economically viablehousehold over time, including a contingency for savings.The ALICE Threshold is the average income that a household needs to afford the basic necessities defined by theHousehold Survival Budget for each county in Pennsylvania. Households Below the ALICE Threshold include bothALICE and poverty-level households.The ALICE Essentials Index is a measure of the average change over time in the costs of the essential goods andservices that households need to live and work in the modern economy — housing, child care, food, transportation,health care, and a smartphone plan.ALICE ONLINEVisit UnitedForALICE.org for more details about ALICE, including:Interactive MapsData at the state, county,municipal, ZIP code, andcongressional district levelsDemographic DataInformation about ALICEhouseholds by age, race/ethnicity, and household typeCounty ProfilesDetailed data about ALICEhouseholds in each countyALICE REPORT, 2020Research AdvisoryCommitteeAdditional ReportsData SpreadsheetJobs GraphsDownload the ALICE dataDetails about where ALICEworksMethodologyMore AboutUnited For ALICELearn about the members androle of this critical groupOverview of the sources andcalculations used in the ALICEresearch2Explore The ALICE EssentialsIndex and The Consequences ofInsufficient Household IncomeSee our partners, press coverage,learning communities, etc.PENNSYLVANIA
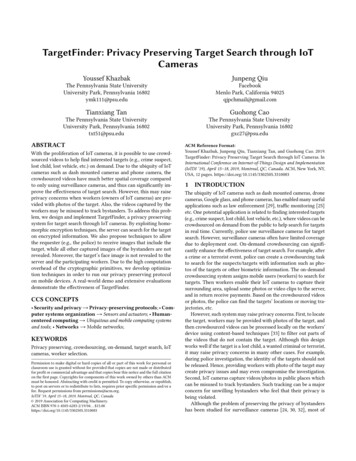
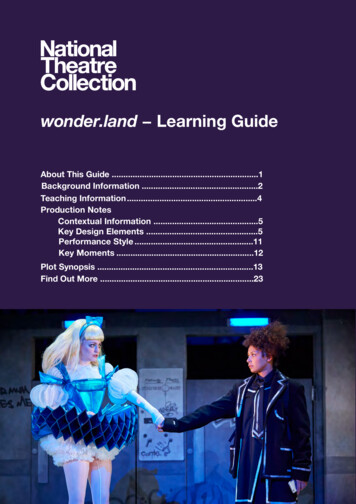
AT-A-GLANCE: PENNSYLVANIA2018 Point-in-Time DataPopulation: 12,807,060Number of Counties: 67Number of Households: 5,067,682How many households are struggling?12%ALICE, an acronym for Asset Limited, IncomeConstrained, Employed, comprises households that earnmore than the Federal Poverty Level but less than thebasic cost of living for the state (the ALICE Threshold).Of Pennsylvania’s 5,067,682 households, 611,043 earnedbelow the Federal Poverty Level (12%) in 2018, andanother 1,359,983 (27%) were ALICE.61Poverty27%%ALICEAbove ALICEThresholdWhat does the Pennsylvania laborforce look like?A 2018 overview of the labor status of Pennsylvania’s 10,464,719 working-age adults (people age 16 and over) showsthat 63% of adults were in the labor force (blue bars), yet more than half were workers who were paid hourly. Hourlypaid jobs tend to have lower wages, fewer benefits, and less stability. In addition, 38% of adults were outside the laborforce (gold bars), either because they were retired or because they had stopped looking for work.Labor Status, Population Age 16 and Over, Pennsylvania, 2018Population Age 16 and Over 10.5 TimeHourlyNot in LaborForce - Other6,000,0008,000,00018%Not in LaborForce - Retired10,000,00012,000,000Note: Data for full- and part-time jobs is only available at the national level; these national rates (51% of full-time workers and 75% of part-time, hourly workers) have beenapplied to the total Pennsylvania workforce to calculate the breakdown shown in this figure. Full-time represents a minimum of 35 hours per week at one or more jobs for48 weeks per year. Many percentages are rounded to whole numbers, sometimes resulting in percentages totaling 99% or 101%.ALICE REPORT, 20203PENNSYLVANIA
What does it cost to afford the basic necessities?The average ALICE Household Survival Budget in Pennsylvania was 23,544 for a singleadult, 26,436 for a single senior, and 69,648 for a family of four in 2018 — significantlymore than the Federal Poverty Level of 12,140 for a single adult and 25,100 for afamily of four.Household Survival Budget, Pennsylvania Average, 2018SINGLE ADULT2 ADULTS, 1 INFANT,1 PRESCHOOLERSENIOR (1 ADULT)Monthly CostsHousing 640 640 894-- 1,229Food 277 236 839Transportation 332 287 789Health Care 187 485 716Technology 55 55 75Miscellaneous 178 200 528Taxes 293 300 734 1,962 2,203 5,804 23,544 26,436 69,648 11.77 13.22 34.82Child CareMonthly TotalANNUAL TOTALHourly Wage**Full-time wage required to support this budgetPennsylvania Counties, 2018COUNTYAdamsTOTAL HOUSEHOLDSPennsylvania Counties, 2018% ALICE &POVERTYCOUNTYTOTAL HOUSEHOLDS% ALICE 2444%ALICE REPORT, 20204PENNSYLVANIA
Pennsylvania Counties, 2018COUNTYTOTAL HOUSEHOLDSPennsylvania Counties, 2018% ALICE rd34,38639%Cumberland102,243DauphinDelawareTOTAL HOUSEHOLDS% ALICE 43%FranklinJuniataLackawannaALICE REPORT, 2020Sources: Point-in-Time Data: American Community Survey, 2018. ALICEDemographics: ALICE Threshold, 2018; American Community Survey, 2018.Labor Status: American Community Survey, 2018; Federal Reserve Bank of St.Louis, 2018. Budget: AAA, 2018; Agency for Healthcare Research and Quality,2018; American Community Survey, 2018; Bureau of Labor Statistics, 2018—Consumer Expenditure Surveys; Bureau of Labor Statistics, 2019—ConsumerExpenditure Survey; Bureau of Labor Statistics, 2018—Occupational EmploymentStatistics; Centers for Medicare & Medicaid Services, 2016—Medicare CurrentBeneficiary Survey; Centers for Medicare & Medicaid Services, 2019; Centers forMedicare & Medicaid Services, 2019—Medicare - Chronic Conditions; FederalHighway Administration, 2017; Feeding America, 2019; Fowler, 2019; InternalRevenue Service, 2020; Internal Revenue Service—FICA, 2020; Medicare.gov;Pennsylvania Department of Education and Human Services; Scarboro, 2018;The Zebra, 2018; U.S. Department of Agriculture, 2018—Official USDA FoodPlans; U.S. Department of Housing and Urban Development, 2018—Fair MarketRents; Walczak, 2019. For more details, see the Methodology Overview atUnitedForALICE.org/Methodology5PENNSYLVANIA
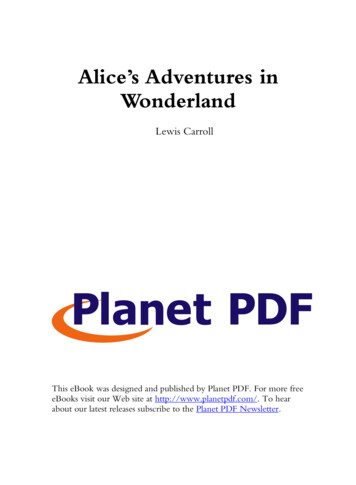
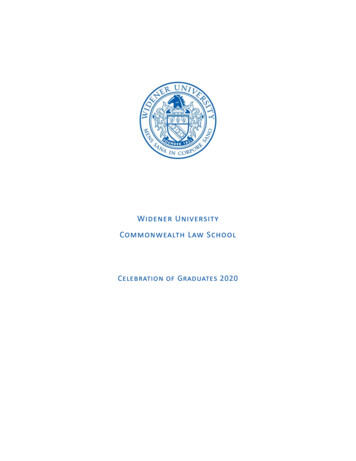
WHO IS ALICE?With income above the Federal Poverty Level (FPL) but below a basic survival threshold — defined as the ALICEThreshold — ALICE households earn too much to qualify as “poor” but are still unable to make ends meet. They oftenwork as cashiers, nursing assistants, office clerks, child care workers, servers, laborers, and security guards. Thesetypes of jobs are vital to keeping Pennsylvania’s economy running smoothly, but they do not provide adequate wages tocover the basics of housing, child care, food, transportation, health care, and technology for these ALICE workers andtheir families.Between 2007 and 2018 the total number of Pennsylvania households grew by 4%, to 5,067,682 households. Whenhouseholds in poverty alone are considered, financial hardship remained relatively flat during this period, and evenimproved slightly between 2014 and 2018. However, the trajectory for ALICE households in the state presents a verydifferent picture, one that shows a large and growing number of households that did not benefit from the “recovery”after the Great Recession, and who continue to struggle to make ends meet. The number of ALICE householdsincreased by a substantial 35% (from 1,006,708 to 1,359,983) from 2007 to 2018, with their share of all householdsrising from 21% to 27%. Overall, the percentage of households living below the ALICE Threshold (ALICE and povertylevel households combined) increased from 33% in 2007 to 39% in 2018 (Figure 1).Figure 1.Households by Income, Pennsylvania, 00Households1,000,000800,000600,000Below FederalPoverty Level611,043400,000200,0000PercentBelow 39%39%Sources: ALICE Threshold, 2007–2018; American Community Survey, 2007–2018ALICE households live in every county in Pennsylvania — urban, suburban, and rural — and they include people of allgenders, ages, and races/ethnicities, across all household types. Figure 2 shows that in 2018, the largest numbers ofhouseholds below the ALICE Threshold were in the largest demographic groups in Pennsylvania — namely, householdsheaded by someone in their prime working years (ages 25–64), single or cohabiting households (without children orseniors), and White households. Among families with children — another of the state’s biggest groups — married-parentfamilies were the largest subgroup and accounted for 30% of families with children living below the ALICE Threshold.ALICE REPORT, 20206PENNSYLVANIA
Figure 2.Household Types by Income, Largest Groups, Pennsylvania, 2018Total Households 5,067,682HispanicEachSingle-Female-Headed 100,000 HouseholdsBelow ALICE ThresholdBlackAbove ALICE ThresholdMarried With ChildrenFamilies With ChildrenSeniors (65 )25 to 44
Penn State College of Medicine Vincent Cannizzaro, M.P.P. The Arthur J. Glatfelter Institute for Public Policy, York College of Pennsylvania Scott Davis, M.S. Pennsylvania Housing Finance Agency Paul R. Flora, M.U.R.P., M.A. Federal Reserve Bank of Philadelphia Karen Grimm-Thomas, M.S. Pennsylvania Office of Child Development and Early Learning