Transcription
MetaTrader 4USER GUIDEwww.robotz.inrobotz.in@gmail.com
MT4 Chart Software ManualTable of ContentsIntroductionIntroductionMT4 Download linkInstalling of MT4Alice Blue IndicatorAlice Blue ScannerAlice Blue One Click TradingAlice Blue AP ToolGeneral instruction For Nest & MT4www.robotz.in123145678robotz.in@gmail.com
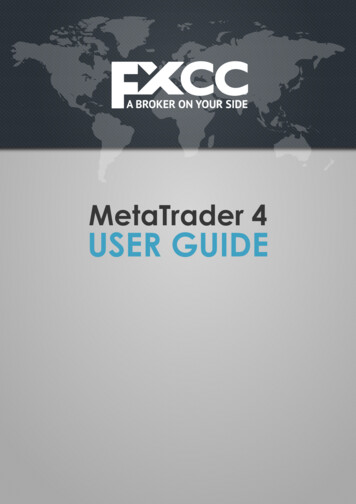
1. Introduction:Here is a picture of what the MT4 main screen looks likeMain menu (access to the program menu and settings);Toolbars (quick access to the program features and settings);"Market Watch" window (real-time quotes for the specified instruments);"Navigator" window (quick access to all your accounts, indicators, expertadvisors); "Chart" window;"Terminal" window (quick access to the trading and account history, list of openpositions and placed orders, client terminal log-file and internal mailbox).www.robotz.inrobotz.in@gmail.com
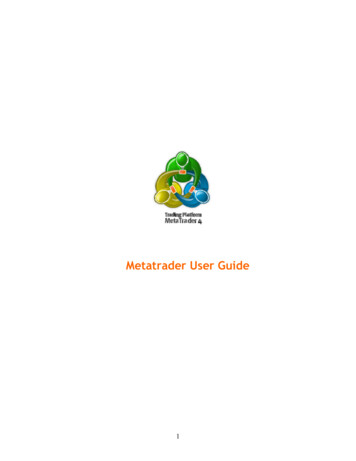
2. MT4 DOWNLOAD LINKTo download MetaTrader4 platform from s/uploads/downloads/tradize4setup.exe3. MT4 INSTALLATIONAfter downloading the file double click on it and Run theMT4Chart setup.a) Launch the MT4Chart exe file the same way you will get.www.robotz.inrobotz.in@gmail.com
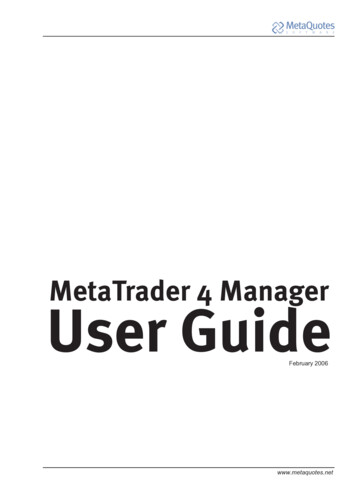
Click on the Next Buttonb) After Clicking the Next Button You will get the Screen like thisThen Click on the Install Buttonc) After Clicking the Install Button You will get the Screen like thiswww.robotz.inrobotz.in@gmail.com
Then Click on the Finish Buttond) After Clicking the Finish Button You will get an ICON on Desktop like thisDouble Click On itwww.robotz.inrobotz.in@gmail.com
e) You will get an Screen like thisAfter coming this Screen Put your Login No & Password for LOGIN it .Then your MT4 terminal will get in to LOGIN www.robotz.inrobotz.in@gmail.com
4. ALICE BLUE INDICATORINSTALLTION PROCEDUREa) To use Alice Blue Indicator Go to Indicators Folder At there will be anFolder Name- AB INDICATOR.b) In that there will 3 Indicators named ABCPITICK / ALICECW / ALICESWc) Right Click on the Indicator name and click Attach to a Chart on the 3indicators one by one.www.robotz.inrobotz.in@gmail.com
d) After attaching Indicator you will get an Page like thiswww.robotz.inrobotz.in@gmail.com
5.ALICE BLUE SCANNERPRODUCT DESCRIPTIONThis is one of the customized indicator tools for Meta Trader Charting Platform. It’sshowing the Super Trend Indicator trending levels with stop loss, 3 Takeprofit levelsvalue of the available scripts in market watch window in MT4 chart.While clicking the Symbol Name Button it will open the respective script chart windowwith Super Trend Indicator at current Time Frame.In this main screen, showing symbol name with Stop Loss value, Entry Price, LastTraded Price and 3 Level Take Profit.INSTALLTION PROCEDUREa) To use Alice Blue Scanner Go to Indicators Folder At there will be anFolder Name- AB SCANNER.b) In that there will 2 Indicators named ALICE SCANNER /ALICESCANNER STc) Go to Tools menu In that Option Click Expert Advisor and Enable AllowAutomated trading & Allow DLL Imports and Click OK Buttonwww.robotz.inrobotz.in@gmail.com
d) In that Right Click on the Indicator name ALICE SCANNER and click Attach to aChart.www.robotz.inrobotz.in@gmail.com
e) After attaching to chart you change parameter from Input according to yourstrategy and then Click OKf) After clicking Ok you will get an Screen like thiswww.robotz.inrobotz.in@gmail.com
g) While clicking the Symbol Name Button it will open the respective script chart window withSuper Trend Indicator at current Time Frame.h) You can Set Mobile Notification for each signal. Whenever the Entry comes youwill get an message to your mobile. To do this Go to Options From Tools MenuStep 1: Find your “MetaQuotes ID”The MetaQuotes ID is a unique code assigned to your device. On your mobile device, download andopen MetaTrader 4 mobile. Go to the settings menu. Scroll down to the “Messages” header. You willsee “MetaQuotes ID” and an 8-character code.www.robotz.inrobotz.in@gmail.com
Step 2 : Put that “MetaQuotes ID” in BOXStep 3: Test your connectionAfter you enter your MetaQuotes ID, click “Test.” This will generate a test message to your mobiledevice. It will prompt you to check your journal. You can look in the “Journal” tab of the terminalwindow to confirm the notification was sent. If set up properly, you will receive a notification in yourstatus bar and in the “Messages” area of MT4 Mobile.www.robotz.inrobotz.in@gmail.com
6. ALICE BLUE ONE CLICK TRADEPRODUCT DESCRIPTIONThis is one of the customized indicator tools for Meta Trader Charting Platform. Place Instant order in Oneclick to NEST terminal.WHY USE ONE CLICK TRADING?One Click trading has a lot of benefits that help you to take advantage in trading. While clicking the Buyor Sell Button it will place the order in Client Nest Terminal Instantly. Save Your Time Instant & Quick Execution Easy to Place order in High Volatile Market. Buy SL/Sell SL Order Execution with Multiple lot Easy to close all Trades in One click Easy for Newbie’s TradersINSTALLTION PROCEDURE :a) To use Alice Blue One Click Trade Go to Indicators Folder There will bean Folder Name- AB ONE CLICK TRADE.b) In that there will 2 Indicators named Alice One Click Trade- 32 Bit / AliceOne Click Trade- 64www.robotz.inrobotz.in@gmail.com
c) Go to Tools menu In that Option Click Expert Advisor and Enable AllowAutomated trading & Allow DLL Imports and Click OK Buttond) Check your system is made up of 32 or 64 Bit. If your System is 32 Bit thenRight Click on Alice One Click Trade- 32 Bit and click Attach to a Chartwww.robotz.inrobotz.in@gmail.com
e) After attaching to chart you will get an Input window like this.f) In MyLoginID Type your Nest ID & In MyTransPwd Type your NestTransaction Password. ( If you Don’t have Transcation Password thentype as- ALICE000)www.robotz.inrobotz.in@gmail.com
g) After giving Input Details click OK Button. Then you will get an Window likethisg) For Instant Buy or Sell entry you can directly click the BUY or SELL button. ByClicking the Button it will place order in your NEST acc.www.robotz.inrobotz.in@gmail.com
7. ALICE BLUE AP TOOLPRODUCT DESCRIPTIONThis is one of the customized indicator tools for Meta Trader Charting Platform. Place Instant order forMultiple Clients in One click to NEST terminal.WHY USE AP ONE CLICK TRADING?AP One Click trading has a lot of benefits that help you to take advantage in trading. While clicking theBuy or Sell Button it will place orders to MULTIPLE Clients Instantly . Save Your Time Instant & Quick Execution to all clients Easy to Place order in High Volatile Market. Buy SL/Sell SL Order Execution with Multiple lot Easy to close all Trades in One click Easy for Newbie’s TradersINSTALLTION PROCEDURE :a) To use Alice Blue One Click Trade Go to Indicators Folder There will bean Folder Name- AB AP TOOL.b) In that there will 2 Indicators named Alice AP One Click Trade- 32 Bit AP/ Alice AP One Click Trade- 64 Bit APc) Go to Tools menu In that Option Click Expert Advisor and Enable Allowwww.robotz.inrobotz.in@gmail.com
Automated trading & Allow DLL Imports and Click OK Buttond) Check your system is made up of 32 or 64 Bit. If your System is 32 Bit thenRight Click on Alice AP One Click Trade- 32 Bit AP and click Attach to aChartwww.robotz.inrobotz.in@gmail.com
e) After attaching to chart you will get an Input window like this.f) In MyLoginID Type your Nest IDwww.robotz.inrobotz.in@gmail.com
g) After giving Input Details click OK Button. Then you will get an Window likethish) By this tool we can Place order for NRML & MIS mode also. And We canPlace for Current & Nest Month Contract alsowww.robotz.inrobotz.in@gmail.com
i) By this tool we can Place order to Multiple Clients by Saving their Nest LoginId in MyClients Notepad.For doing this you need to Click MyClients Button. After Clicking you will getan Notepad File. In that Add your Clients Nest Id details.j) After finishing it Save the file and close the notepad. By doing this you canplace instant order to all clients in Same pair.Like this you can save Multiple Pairs list for Multiple Clients.www.robotz.inrobotz.in@gmail.com
k) For Instant Buy or Sell entry you can directly click the BUY or SELL button. ByClicking the Button it will place order in your NEST acc.www.robotz.inrobotz.in@gmail.com
IMPORTANT IF ONE CLICK NOT WORKED:1. Right Click on the MT4Chart Icon and Click Troubleshoot Compatibility.2. Click on Try Recommended Settingswww.robotz.inrobotz.in@gmail.com
3. After Clicking it. Click the Start The Program Button And Click NEXT Button4.After Clicking Next, Click the Yes, Save these setting for this Program.www.robotz.inrobotz.in@gmail.com
.5. After Finishing Close the Troubleshooter6. Program Will Restart and file get openwww.robotz.inrobotz.in@gmail.com
8. GENERAL INSTRUCTIONS FOR NEST & MT4a) Configuration of Trading Terminal NEST: Check Order Settings in Nest Select - Single Click to Execute Order in Nest order systemb) Check Order Settings in Nest:Location for NEST: Nest - Preferences- Order SettingsKeep these options - Disabled in terminal Order settings Fresh OrderOrder ModificationMarket OrderOrder Cancellationc)Configuration of MT4 Trading Terminalwww.robotz.inrobotz.in@gmail.com
Go to Tools menu In that Option Click Expert Advisor and Enable AllowAutomated trading & Allow DLL Imports and Click OK ButtonThe Market Watch Window:The "Market Watch" window can be activated by pressing the Ctrl M key combination, or by usingthe View- Market Watch menu sequence or by clicking thebutton from the "Standard" toolbar:Right click the mouse button on the "Market Watch" window to produce the context menu:New Order – enables the window to open/close aposition or to place a new pending order;Chart Window – enables the chart of a currency pairor CFD;Tick Chart – shows the tick chart for the m
Hide – deletes the specified symbol from the list in the"Market Watch" window;Hide All – deletes all symbols from the list in the"Market Watch" window which are not used (if youhave open positions or charts, its symbols will not bedeleted);Show All – displays all available symbols in the"Market Watch" window;Symbols – enables the window where you canhide/show the selected instruments;Sets – saves/adjusts/deletes the custom settings forthe "Market Watch" window;High/Low – shows/hides columns with the highestand lowest prices for each instrument;Time – displays a column with the arrival time of thelatest quote for each instrument;Grid - hides/unhides gridlines in the "Market Watch"window;Popup Prices – opens the popup window whichcontains real time quotes for your om
In MetaTrader 4, you can see as many real time charts as you wish, all on one screen, for anycurrency pair and for any time period. The following types of charts are available in MetaTrader 4:Line Chart. Chart x-axis is for the different time periods (minutes, hours, days, months etc.),and y-axis is for the price. The point on the chart shows the close price for the period, i.e. thebid of the last quote for this period. All the sequential points are joined by lines:It is recommended that this chart type is used only for the short time periods (up to 5 minutes).In order to change the chart to a line chart, press thebutton on the «Charts» toolbar:or press the Alt 3 key combination or use the Charts - Line Chart menu sequence.Bar Chart. The chart is created with the use of bars. Each bar has a high (top), a low (bottom),an opening price (left horizontal little line) and a closing price (right horizontal little line) for thespecified period of time (for example, an hour):www.robotz.inrobotz.in@gmail.com
It is recommended that you use this chart type for periods of 5 minutes or more. In orderto change the chart to a bar chart press thebutton on the "Charts" toolbaror press the Alt 1 key combination, or use the Charts - Bar Chart menu sequence.Candlesticks. These charts are created in the same way as bar charts:Candlesticks charts were very popular in the 80-90s because of their clear graphics.This method of technical analysis is based on the correlation between both closingand opening prices within the same trading day, and the closing price of the previoussession and the opening price of the next session.Candlesticks have different configurations compared to bar charts. The rectangular part ofthe candlestick line is called the real body. The thin vertical lines above and below thebody are called shadows. They show lows and highs within a specified period of time.Depending on the closing and opening prices the real body can be white (empty) orblack. When the body is white, the closing price is higher than the opening level. Whenthe body is black, the closing price is lower than the opening level.In order to create a candle chart press thewww.robotz.inbutton on the "Charts" toolbar:robotz.in@gmail.com
the Alt 2 keys simultaneously, or use the Charts - or press Candlesticks menu sequenceIn order to create a new chart for any instrument right click on the "Market Watch" window,select the Chart window item from the context menu:thenBy left clicking the mouse you can drag and drop any selected currency pair into any openchart window.Chart period – the period displayed in one bar or candle. For example, if you create a 15 minutebar chart, then each bar will have the price data for the relevant 15 minutes. In MetaTrader 4 thefollowing time periods can be used: 1, 5, 15, 30 minutes (M1, M5, M15, M30 respectively), 1 hour(H1), 4 hours (H4), 1 day (D1), 1 week (W1) and 1 month (MN). In order to change a timeperiod, use the "Periodicity" toolbar:www.robotz.inrobotz.in@gmail.com
Right click anywhere on the chart to produce the context menu to get access to the chart settings:Choose Periodicity and select a time period from the drop down menu or press thebutton on the "Charts" toolbar;Select Refresh item if an error occurs or if there are so called "gaps" on the chart. All missingdata will be uploaded from the server and will appear on the chart;Select Grid if you wish to hide/unhide gridlines on the chart;Select Volumes in order to show/hide tick volume (the number of quotes of any period time);Zoom in / Zoom out will help you to modify chart measures. You can also use thebuttons on the "Charts" toolbar or press the " " and "-" buttons;Save as picture will save the chart as the *.gif, or *.bmp. file;www.robotz.inrobotz.in@gmail.com/
Properties (or the F8 button) enables the window where you can change chart settings, byselecting the "Color" tab you can change the color of any element on the chart:Other settings can be changed in the Common tab:www.robotz.inrobotz.in@gmail.com
Please note the following options:Offline chart - the chart is not being updated by new quotes. Once you openthe chart offline (File - Open offline) this option becomes automatic;Chart shift – allows you to shift the chart from the right edge of the window,button onto see the most recent candle forming. You can also press thethe "Charts" toolbar or use the Charts - Chart shift menu sequence;Chart autoscroll - autoscrolls to the left once a new quote is received. You canalso press the button on the "Charts" toolbar or use the Charts - Autoscroll menu sequence. If you are viewing the chart back a few days, andthe autoscroll button is depressed, it will automatically take you to the mostrecent candle forming on the next tic of the price.How to install Indicators,Experts,Scripts,Templates in MT4Step By Step instructionsHow to install software (Indicators, Experts, Scripts,Templates) into new MT41. Open your MetaTrader 42. Click File — Open Data Folder (Picture #1)www.robotz.inrobotz.in@gmail.com
Pic.1 File — Open Data FolderHere you will find a folder called MQL4:Pic.2 MQL4 Folderwww.robotz.inrobotz.in@gmail.com
3. Open MQL4 folder. Now, you’ll see these folders:Pic.3 Folders into MQL\Experts – Expert Advisors (trading robots),\Indicators – custom indicators,\Scripts – scripts (MQL4 applications for a single run on the chart),\include – source code MQH and MQ4 files implemented into other programs,\libraries – libraries in the form of MQ4 source codes and EX4 executable files compiled from them. They are usedfor the dynamic call of the functions contained there by other MQL4 programs,\Images – image files for using in resources,\files – special “file sandbox”. MQL4 applications are allowed to execute file operations only within this directory.4. Insert your files :– Insert your EA files (ex4 or .mq4) into MQL4/Experts folder.– Insert your Indicators (ex4 or .mq4) files into MQL4/Indicators folder.– Insert your Scripts files (ex4 or .mq4) into MQL4/Scripts folder.www.robotz.inrobotz.in@gmail.com
– Insert Settings files of EA (.set) into MQL4/Presets folder.– Insert your Libraries files (dll) files into MQL4/Libraries folder.– NOTE: Template files must be NOT in “MQL4 folder” . Copy your .tpl files into templates folder(Picture #4). You can find templates folder when open your Data Folder)Pic.4 Templates Folder5. Restart your MetaTrader 4 after Attaching.Thank youwww.robotz.inrobotz.in@gmail.com
MetaTrader 4 USER GUIDE . www.robotz.in robotz.in@gmail.com MT4 Chart Software Manual Table of Contents Introduction 1 Introduction 1 MT4 Download link 2 Installing of MT4 3 Alice Blue Indicator 4 Alice Blue Scanner 5 Alice Blue One Click Trading 6 Alice Blue AP