Transcription
THE EFFECT OF VERY HIGH HYDRAULIC PRESSURE ON THEPERMEABILITY AND SALT REJECTION OF REVERSE OSMOSISMEMBRANESAuthors:Ronan Killian McGovern, Dillon McConnon and John H. Lienhard VPresenter:Ronan Killian McGovern, PhDPost-doctoral Associate – Massachusetts Institute of Technology – USAmcgov@alum.mit.eduAbstractWe employ a stirred-cell reverse osmosis setup to demonstrate that a seawater reverse osmosismembrane can maintain excellent salt rejection at pressures as high as 172 bar. However, we alsodemonstrate a very significant drop in membrane permeability at high pressures – likely due tomembrane compaction. At 172 bar, permeability is more than 50% lower than at a pressure of 34.5 bar.In addition, our results illustrate how flux fluctuates significantly in time when the pressure is removedand then reapplied, even for very short periods, in high pressure reverse osmosis processes – an effectthat requires careful consideration from the perspective of process control and operation. From theperspective of membrane performance, RO is feasible at high pressures but distinct challenges arepresented by reduced permeability and increased variability in flux.I.INTRODUCTIONWe demonstrate, using a high pressure stirred cell, that seawater reverse osmosis (RO) membranes canreject salt effectively, even when operating at pressures of up to 172 bar. Although water permeability isreduced relative to performance at conventional seawater test pressures of 55 bar, salt rejection isimproved. These results are significant as they demonstrate that, at least from the perspective ofmembrane performance, reverse osmosis systems can treat waters with osmotic pressures that go farbeyond seawater salinities.One application of relevance to high pressure reverse osmosis systems is the purification of waters in theoil and gas industry, where certain highly saline waste water streams require purification [1]. The use ofreverse osmosis, which is by far the most energy efficient desalination technology for seawaterdesalination [2], is particularly interesting given the poor energy efficiency of the thermal technologiescurrently employed for the desalination of highly saline waters [3]. If feasible, high salinity reverseosmosis systems could potentially achieve significant reductions in energy consumption relative tomechanical vapour compression systems [3].Of relevance to the feasibility of RO at high pressures is the question of whether RO membranes canperform satisfactorily, in terms of water permeability and salt rejection, at high pressures. Until now,answers to this question have been largely theoretical. Studies on the effect of hydraulic pressure on thinfilm composite polyamide membranes have, to our knowledge, been limited to experiments spanningpressures up to 50 bar on nano-filtration (NF) membranes [4,5] and preliminary experiments reaching 69bar on reverse osmosis membranes [6].The International Desalination Association World Congress on Desalination and Water Reuse 2015/San Diego,CA, USAREF: IDAWC15- McGovern
In brief, our expectations for the performance of reverse osmosis at high pressures are perhaps wellsummarized by the following three observations of studies conducted to date in literature:1. Reverse osmosis membranes comprise three layers – a porous fabric, a polysulfone support layerand a salt-rejecting polyamide layer, known as the active layer. The polyamide active layer is thethinnest of all layers ( 200 nm) and sits upon the porous polysulfone layer. At high pressures,there is therefore concern that the active layer might tear and compromise the salt rejectingability of the membrane. Synthesis and analysis of thin film composite membranes, achieved viapendant drop mechanical analysis, indicates that the rupture stress of the active layer is on theorder of 400 bar [7]. While it would be incorrect to directly compare this rupture stress to thehydraulic pressure applied, it is nonetheless comforting that the rupture stress is on the order of400 bar – perhaps suggesting the membrane is robust at very high pressures.2. Analysis of the permeability and salt rejection of nanofiltration membranes indicates that ashydraulic pressure increases, permeability to water decreases but salt rejection increases [4,5].Furthermore, it appears that there exists a value of applied hydraulic pressure at which fluxreaches a limiting value [4]. The active layer composition in nanofiltration membranes iscertainly different than for reverse osmosis – indeed the active layer in NF appears to be morearomatic, less rough, less hydrophobic, and less homogeneous than the active layer in an ROmembrane [8,9,10]. Nonetheless, it is interesting to ask whether permeability and salt rejectionmight follow the same trends for RO at high pressure as seen for NF and whether a limitingvalue of flux might exist.3. Finally, in assessing the pressure dependence of flux for NF membranes, a viscoelastic model(spring and damper in parallel) was shown to fit the evolution of permeability of water with timeduring the application of a fixed hydraulic pressure [5]. It is therefore interesting to ask whethersuch a model might adequately describe the evolution of permeability with time for RO and,furthermore, whether such a model remains accurate during the repeated application and removalof pressure.II.METHODSExperimentalDe-ionised water with a conductivity of less than 5 μS/cm was used in all experiments (McMaster Carr,New Jersey, USA). The membranes used in all experiments were SWC membranes from Hydranautics(California, USA). The membranes were obtained as hydrated flat sheets in a sodium bisulfite solution.These membranes were cut from seawater RO elements that had previously been operated at standardseawater test conditions for a period of 30 minutes. Each sample was used for one experiment only.A dead-end, stirred cell (HP4750X; Sterlitech, Washington, USA) was used for permeability and rejectionstudies. The cell is made of stainless steel and withstands pressures of up to 172 bar. The cellaccommodates a stirring bar that is suspended above the membrane without making contact. Themembrane was secured against an EPDM O-ring and the torque applied to the bolts was 20ft-lbs. Pressurewas applied using a nitrogen cylinder connected to the cell, a pressure regulator (Y11-N198J; Airgas,Radnor, PA, U.S.A.) and a pressure gauge (345 bar rating; Ashcroft, Stratford, CT, U.S.A.). During tests,pressure fluctuated by no more than /- 7 bar. Water flux determined by measuring the mass of permeateversus time using a precision scales (ML203E; Mettler Toledo, Billerica, MA, U.S.A.). Flux was basedupon a 750 second time average. Permeability was computed by dividing the water flux by the appliedThe International Desalination Association World Congress on Desalination and Water Reuse 2015/San Diego,CA, USAREF: IDAWC15-McGovernPage - 2 - of 7
hydraulic pressure, adjusting for the osmotic pressure at the surface of the RO membrane where necessary(Eq. 1).𝐽Eq. 1: 𝐽𝑤 𝐴𝑚 [𝑃 𝜋 exp ( 𝑘𝑤 )]𝐽𝑤 is the water flux, 𝐴𝑚 is the permeability of the membrane to water, 𝜋 is the osmotic pressure of thesolution and 𝑘 is the mass transfer coefficient resulting from stirring. For the purpose of calculations, allunits are in SI. However, to correspond with industry standards, flux is reported in litres per square metreper hour, pressure is reported in bar and permeability is reported in litres per square metre per hour perbar. All tests were operated with the stir bar rotating at 500 rpm, giving rise to an estimated mass transfer𝑚coefficient of 4 10 5 𝑠 [12]. The effective area of the membrane was taken to be 14.38 cm2,determined via measurement with calipers.For each test pressure, the experimental procedure consisted of three steps: a salt rejection test to insureminimal salt leakage around the membrane; a permeability test with DI water; and, a second salt rejectiontest to insure there is still minimal leakage around the membrane. In total, the three steps were designedto last 8 hours, which was estimated, from previous tests, to have been the representative time over whichthe most significant change in membrane permeability occurred. Salt rejection tests were run over a periodof 45 minutes at the test pressure using 200 mL of 1 g/L sodium sulfate solution for the 34.5 bar (500 psi)test, and 300 mL of 1g/L sodium sulfate solution for the 103.4 bar (1500 psi) and 172.4 bar (2500 psi)test. During this 45 minutes, permeate was collected for 30 minutes and thrown away. Permeate was thencollected for 15 more minutes and the conductivity of this permeate was measured using a Jenco 3250conductivity meter and used to determine rejection. For permeability testing with DI water between thesalt rejection tests, the cell was first rinsed with DI water and then filled with 300 mL of DI water. When280 g of permeate had been gathered, the test would be stopped to refill the cell with DI water.ModellingThe viscoelastic model proposed is similar in form to that employed in literature for NF membranes [5].Essentially, the level of compaction (strain) of the active layer was modelled via a spring and a damperthat are connected in parallel (Eq. 2).Eq. 2: 𝑃 𝐾𝑥 𝐶𝑥̇𝑃 is the applied pressure in Pa, 𝐾 is a spring constant in Pa/m and 𝐶 is a damper constant in Pa s/m. 𝑥 isthe active layer strain, defined as the change in thickness divided by its initial thickness. The solution tothis equation takes the form:𝑃Eq. 3: 𝑥 (𝑥 ′ 𝐾) exp ( 𝐾𝑡𝐶𝑃) 𝐾𝑥 ′ is the initial level of strain, which is zero at the very start of an experiment, and 𝑡 is the time elapsed.Essentially, this model predicts that, when a constant pressure is applied, strain will rise to an asymptoticvalue, and, the higher the pressure, the higher the asymptotic strain. When no pressure is applied, the strainshould return to zero, with the speed of return determined by the damper constant 𝐶.The International Desalination Association World Congress on Desalination and Water Reuse 2015/San Diego,CA, USAREF: IDAWC15-McGovernPage - 3 - of 7
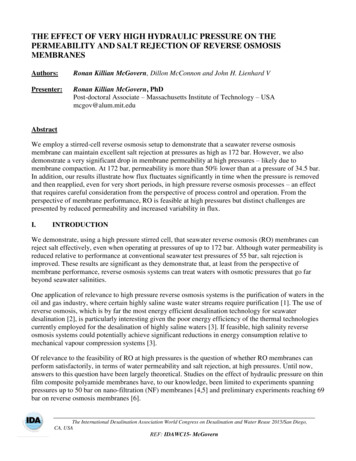
To relate strain to flux, we assume a linear relationship between the change in permeability and the strain,as indicated in Eq. 4 [11]. In other words, if permeability drops by 10% relative to its initial value, weassume that strain has increased by 10%:𝐴Eq. 3: 1 𝐴𝑚0 𝑥𝑚where 𝐴0𝑚 is the permeability measured after the initial application of pressure.III.RESULTS AND DISCUSSIONFigure 1 illustrates the water flux of the RO membrane at three different pressures demonstrating that fluxincreases monotonously with the level of applied pressure. The first discontinuity in data for each pressureis as a result of stopping the test to switch out the sodium chloride solution for DI after the salt rejectiontest. Conversely, the last discontinuity in data for each pressure results from the DI water being swappedout for a sodium chloride solution after the DI water tests. Discontinuities in data during DI water testsresult from the tests being stopped to refill the feed-water chamber with DI water. As was reported for NFmembranes [4], it appears that there is a limiting flux, somewhere close to 172 bar, beyond which furtherincreases in applied pressure yield no further increase in permeability. Interestingly, the value of appliedpressure at which the limiting flux appears to be reached for the SWC RO membrane is much higher thanwas reported for the NF-90 membrane [4].12034.5 bar103 bar172 bar100salt rejection test-2-1Flux [Lm hr ]80salt rejection test60402000DI water tests12345Time [hr]6789The International Desalination Association World Congress on Desalination and Water Reuse 2015/San Diego,CA, USAREF: IDAWC15-McGovernPage - 4 - of 7
Fig. 1 Membrane flux versus time. Flux measurements during the processing of DI water are accurate towithin 1.0% - calculated via the propagation of error from measuring the rejection rate of sodiumsulfate. Flux measurements during salt rejection tests are accurate to within 5%, due to large error inestimating the mass transfer coefficient. Breaks in the data are due to the procedure needing us to changethe water since the stirred cell we used does not have a large enough capacity to handle 7 hours ofdischarge. They are that large because we need 750 seconds of raw data to get our averaged data.Figure 2 is derived from the combination of data in Figure 1 with data on the evolution of pressure withtime. It illustrates the effect of applied pressure upon permeability – clearly illustrating how higher appliedpressures lead to reduced membrane permeability. At a pressure of 172 bar, the permeability is less thanhalf of the value at 34.5 bar. This no doubt implies that reverse osmosis systems operating at higherpressures can be expected to require greater membrane area, a greater number of pressure vessels and alarger footprint than conventional seawater desalination systems.Of particular note, both in Figs. 1 and 2, is the recovery of flux and permeability when pressure is released– even for a brief period – and then reapplied. Although pressure is removed for only a matter of minuteswhen the DI water in the cell is refilled, there is a very notable increase in flux and permeability when thepressure is reapplied; it is clear that some form of viscoelastic behavior is at play in the membrane. Tobetter understand this behavior, the spring-damper model described in the methods was fitted to the datafor DI water processing in Fig. 2. Although the model fits the data reasonably well over the full eighthours it does not accurately predict the rapid recovery of permeability when pressure is removed. It seemsthat either the spring-damper model chosen, or the assumptions relating permeability to strain are not fullysatisfactory.Actual 34.5 barFitted 34.5 barActual 103 barFitted 103 barActual 172 barFitted 172 bar21.8-2 -1-1Permeability [Lm h bar ]1.61.41.210.80.60.40.2DI water testssalt rejection test0012salt rejection test345Time [hr]6789The International Desalination Association World Congress on Desalination and Water Reuse 2015/San Diego,CA, USAREF: IDAWC15-McGovernPage - 5 - of 7
Fig. 2 Membrane permeability versus time. The error on permeability measurements, propagated fromerror on measuring flux and pressure, is 1.0%. Breaks in the data are due to the procedure needing us tochange the water since the stirred cell we used does not have a large enough capacity to handle 7 hoursof discharge. They are that large because we need 750 seconds of raw data to get our averaged data.Finally, the salt rejection rates corresponding to Figs. 1 and 2 are shown in Table 1. The level of leakagearound the O-ring is difficult to quantify and, therefore, these values of rejection serve only as a lowerbound upon the true rejection of the membrane. Furthermore, these values of rejection are specific onlyto a single run at each pressure, i.e. if the test at 34.5 bar were to be repeated, we would expect variancein the rejection at the start and end due to stochastic differences in the seal between the membrane andthe O-ring as well as possible differences in the membrane sample itself because of the non-uniformityof membrane sheets [4]. For this reason, while we can legitimately compare rejections at the start andend of the same test, it is more difficult to compare the rejections obtained at different pressures.Notwithstanding these limitations, there is nonetheless an important increase in membrane rejection withtime in the tests conducted at each of the three pressures, as was previously reported for NF membranes[5], indicating that membrane compaction tends to boost rejection.Table 1, Salt rejection at the start and end of three runs at different pressures. In each case, the error onconductivity measurements results in an uncertainty of 0.01% on rejection.Pressure 10%99.62%V.CONCLUSIONSWe have demonstrated, experimentally, that a seawater reverse osmosis membrane (SWC, Hydranautics)can maintain excellent salt rejection when operating at pressures of up to 172 bar. While we have shownthat RO is technically feasible up to at least 172 bar, we have also shown that the permeability at suchpressure falls by more than 50% relative to its value at 34.5 bar. If this membrane were to be used, the ROsystem would therefore be at least twice as large, in terms of membrane area and footprint, as a seawaterRO system that produced permeate at the same rate. Furthermore, given the apparent viscoelastic natureof the reverse osmosis membrane, operators of high pressure RO systems should expect high variabilityin permeate flow rates with time, even if the applied pressure is held fixed in time. Still, the potentialbenefits, especially in terms of reduced energy consumption, of replacing technologies such as mechanicalvapor compression with high pressure reverse osmosis are very significant. We therefore believe that highpressure reverse osmosis holds great promise for the near future.VI.REFERENCESShaffer, Devin L., Laura H. Arias Chavez, Moshe Ben-Sasson, Santiago Romero-Vargas Castrillón,Ngai Yin Yip, and Menachem Elimelech. "Desalination and reuse of high-salinity shale gasproduced water: drivers, technologies, and future directions." Environmental science & technology47, no. 17 (2013): 9569-9583.2. Mistry, Karan H., Ronan K. McGovern, Gregory P. Thiel, Edward K. Summers, Syed M. Zubair,and John H. Lienhard. "Entropy generation analysis of desalination technologies." Entropy 13, no.10 (2011): 1829-1864.1.The International Desalination Association World Congress on Desalination and Water Reuse 2015/San Diego,CA, USAREF: IDAWC15-McGovernPage - 6 - of 7
3.4.5.6.7.8.9.10.11.12.Thiel, Gregory P., Emily W. Tow, Leonardo D. Banchik, Hyung Won Chung, and John H. Lienhard."Energy consumption in desalinating produced water from shale oil and gas extraction."Desalination (2015).Hussain, Yazan A., Mohammed H. Al-Saleh, and Suekainah S. Ar-Ratrout. "The effect of activelayer non-uniformity on the flux and compaction of TFC membranes." Desalination 328 (2013): 1723.Hussain, Yazan A., and Mohammed H. Al-Saleh. "A viscoelastic-based model for TFC membranesflux reduction during compaction." Desalination 344 (2014): 362-370.Luk-Cyr, Jacques. "Experiments and modeling of multilayered coatings and membranes: applicationto thermal barrier coatings and reverse osmosis membranes." PhD diss., Massachusetts Institute ofTechnology, 2014.Roh, Il Juhn, Jae-Jin Kim, and Soo Young Park. "Mechanical properties and reverse osmosisperformance of interfacially polymerized polyamide thin films." Journal of membrane science 197,no. 1 (2002): 199-210.Tang, Chuyang Y., Young-Nam Kwon, and James O. Leckie. "Effect of membrane chemistry andcoating layer on physiochemical properties of thin film composite polyamide RO and NFmembranes: I. FTIR and XPS characterization of polyamide and coating layer chemistry."Desalination 242, no. 1 (2009): 149-167.Tang, Chuyang Y., Young-Nam Kwon, and James O. Leckie. "Effect of membrane chemistry andcoating layer on physiochemical properties of thin film composite polyamide RO and NFmembranes: II. Membrane physiochemical properties and their dependence on polyamide andcoating layers." Desalination 242, no. 1 (2009): 168-182.Coronell, Orlando, Benito J. Marinas, and David G. Cahill. "Depth heterogeneity of fully aromaticpolyamide active layers in reverse osmosis and nanofiltration membranes." Environmental science &technology 45, no. 10 (2011): 4513-4520.Van Der Velden, P. M., and C. A. Smolders. "Initial flux decline and initial rejection increase forswollen ionic membranes." Journal of Applied Polymer Science 20, no. 5 (1976): 1153-1164.Becht, Nils O., Danish J. Malik, and E. S. Tarleton. "Evaluation and comparison of proteinultrafiltration test results: dead-end stirred cell compared with a cross-flow system." Separation andpurification technology 62, no. 1 (2008): 228-239.The International Desalination Association World Congress on Desalination and Water Reuse 2015/San Diego,CA, USAREF: IDAWC15-McGovernPage - 7 - of 7
The International Desalination Association World Congress on Desalination and Water Reuse 2015/San Diego, CA, USA REF: IDAWC15-McGovern Page - 4 - of 7 To relate strain to flux, we assume a linear relationship between the change in permeability and the strain, as indicated in Eq. 4 [11]. In other words, if permeability drops by 10% relative to .