Transcription
Region of Waterloo Economic DevelopmentTable of ContentsCHAPTER 1: Demographics . 61.1 General Population . 71.1.1 Population Growth. 71.1.2 Median Age . 81.2 Language . 81.2.1 Languages Spoken at Home . 91.3 Diversity . 101.3.1 Visible Minorities . 101.3.2 Immigrant Population . 111.4 Income Earners . 121.4.1 Low Income Measure (LIM) . 121.4.2 Income Distribution . 131.5 Crime . 14CHAPTER 2: Workforce. 152.1 Labour Force Statistics . 162.1.1 Labour Force and Participation Rate . 162.1.2 Unemployment Rate . 172.2 Highly Skilled Workforce . 182.2.1 Educational Attainment . 182.2.2 Major Field of Study . 192.2.3 Tech Talent in Waterloo Region. 202.2.4 Employment by Industry . 222.2.5 Employment by Occupation. 23CHAPTER 3: Education . 243.1 Wilfrid Laurier University . 253.2 University of Waterloo . 263.3 Conestoga College. 273.4 Business Support Organizations and Research Centre . 28CHAPTER 4: Resilient Economy . 304.1 Innovation Culture . 314.1.1 Start-up Culture . 312WATERLOO REGION COMMUNTY PROFILE 2018
Region of Waterloo Economic Development4.2 Local Economy . 344.2.1 An Overview of Business Environment . 344.3 Key Industries . 354.3.1 Advanced Manufacturing Sector . 354.3.2 Information Technology Sector . 364.3.3 Aerospace Sector . 384.4 Key Economic Indicators . 414.4.1 GDP Growth . 414.4.2 Consumer Price Index . 424.4.3 Employment Growth. 434.5 Building Development. 444.5.1 Total Value of New Building Permits . 444.5.2 Housing Starts . 454.5.3 Development in the Built Up Area (BUA). 464.5.4 Total New Square Footage, Non-Residential . 474.6 Standard of Living . 484.6.1 Residential Prices and Rental Market . 484.6.2 Median Household Income . 50CHAPTER 5: Transportation . 525.1 Market Access . 535.2 Rail Access to Toronto. 535.3 Local Transit Network . 545.3.1 Grand River Transit . 545.3.2 Rapid Transit . 555.4 New Transit Investments . 565.4.1 The King-Victoria Transit Hub . 565.4.2 High Speed Rail . 565.5 Region of Waterloo International Airport. 57CHAPTER 6: Cost Competitiveness . 586.1 National and Provincial Cost Advantages . 596.1.1 Property Tax Rates in Waterloo Region . 596.1.2 Corporate Tax Rates . 606.1.3 Exchange Rate . 61
Region of Waterloo Economic Development6.1.4 National and Provincial Incentives . 626.2 Regional Incentives . 666.2.1 Brownfield Financial Incentive Program . 666.2.2 Other Incentives . 66List of FiguresFigure 1: Projections of population growth . 7Figure 2: Average age in selected regions, 2016 . 8Figure 3: Mother tongue compared to home language in Waterloo Region, 2011 and 2016 . 9Figure 4: Visible minority groups in Waterloo Region, 2006-2016 . 10Figure 5: Place of birth for total immigrant population in Waterloo Region, 2016 . 11Figure 6: Percentage of low income (after-tax) families by selected Region . 12Figure 7: Income distribution by age cohort in Kitchener-Cambridge-Waterloo, 2015 . 13Figure 8: Total Criminal code violations (excluding traffic) per 100,000 people (rate) . 14Figure 9: Total violent criminal code violations per 100,000 people (rate). 14Figure 10: Regional labour force and participation rates . 16Figure 11: Unemployment Rate . 17Figure 12: Educational attainment by age cohort for Waterloo Region, 2016. 18Figure 13: University field of study for individuals aged 25 to 34 with a Bachelor’s degree or above, 2006and 2016 . 19Figure 14: Waterloo Region Top Tech Office Deals (2017) . 20Figure 15: Momentum of Top Tech Talent Labour Pools 2014-2016 (Top 5). 21Figure 17: Employment by Industry in Kitchener-Cambridge-Waterloo, 2017 . 22Figure 18: Employment by Occupation in Kitchener-Cambridge-Waterloo, 2017 . 23Figure 19: Student enrollment and Co-op/Apprenticeship, 2016-2017 . 27Figure 20: Average Annual Salary of Software Engineers . 31Figure 21: Market Reach Percentage of Foreign Customers . 32Figure 22: Exit Value Growth Index (13/14 vs. 14/15) . 33Figure 23: Output Growth Index ('10-'12 vs. '13-'15) . 33Figure 24: Number of Businesses by Employment Range in Waterloo Region . 34Figure 25: Information Technology and Analytical Instruments Location Quotient by CMA, 2016 . 37Figure 26: Aerospace Vehicles and Defense Location Quotient by CMAs in Ontario (2016) . 38Figure 27: GDP Growth and Levels . 41Figure 28: GDP per Capita Kitchener-Cambridge-Waterloo vs. Ontario and Canada, 2017. 42Figure 29: CPI (2002 1.0) and Inflation . 42Figure 30: Employment Growth in Kitchener-Cambridge-Waterloo . 43Figure 31: Total Value of New Building Permits (2008-2017). 44Figure 32: Housing Starts in Kitchener-Cambridge-Waterloo . 45Figure 33: Units Constructed Inside the Build Up Area (BUA) Percentage (2006-2017) . 46Figure 34: Total New Non-Residential Floor Space by Sector (2008-2017) . 47Figure 35: Average Real Estate Prices, 2017 Q4 . 48Figure 36: Private apartment average rents ( ) by bedroom type, 2017 . 494WATERLOO REGION COMMUNTY PROFILE 2018
Region of Waterloo Economic DevelopmentFigure 37: Median household income for Waterloo Region, 2005 and 2015 . 50Figure 38: Total median household income in Southwestern Ontario, 2015. 51Figure 39: Go Train Map . 53Figure 40: GRT ridership, revenue hours, and municipal population . 54Figure 41: Toronto-Waterloo Corridor . 56Figure 42: Property tax rates in Waterloo Region . 59Figure 43: Average Total Tax and Contribution Rate for Small-Medium Companies in G7 Countries . 60Figure 44: Value of the Loonie . 61Figure 45: Cost of Research and Development Index . 62Figure 46: Various Incentive Programs . 63
CHAPTER 1:Demographics
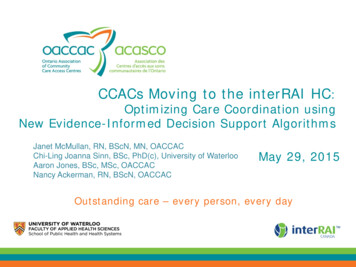
Region of Waterloo Economic Development1.1 General Population1.1.1 Population GrowthWaterloo Region is one of the largest and fastest growing regions in Ontario. This area has the10th largest population in Canada and the 4th largest in Ontario. Between 2011 and 2016,Waterloo Region’s growth rate was 5.5 per cent, which exceeded both provincial and nationalgrowth rates of 4.6 per cent and 5 per cent respectively. Waterloo Region also attracts a largenumber of students to study at its post-secondary institutions, resulting in a total year-endpopulation of 583,500. The Province of Ontario’s Growth Plan 1 projects that Waterloo Region’spopulation will grow by 185,000 people over the next 15 years. The high projected populationgrowth rate was one of the main reasons for the construction of the ION LRT, which aims toprovide efficient travel within the high density Central Transit Corridor.Figure 1: Projections of population gional Population300,000Places to Grow (initialforecast)200,000Places to Grow (new 03120362041Source: Region of Waterloo Planning & Analytics1Places to Grow; Growth Plan for the Greater Golden Horseshoe (2017)CHAPTER 1: DEMOGRAPHICS7
Region of Waterloo Economic Development1.1.2 Median AgeWaterloo Region’s population is younger than most municipalities in Canada. In 2016, theaverage age of an individual in Waterloo Region was 39.1 years old, which was lower than the41 year old average in both Ontario and Canada. The Region’s youthful population is anessential component of its innovative labour force.Figure 2: Average age in selected regions, 2016Geographic AreaPeel RegionWaterloo RegionToronto (City)Durham RegionOttawa (City)York RegionHalton RegionWellington CountyOntarioCanadaHamilton (City)Simcoe CountyNiagara RegionSource: Statistics Canada, 2016 Census ProfileAverage Age .843.81.2 LanguageIn total, the 2016 Census recorded over 120 mother tongues in Waterloo Region. English wasthe most prevalent mother tongue of people in the region, representing three out of fourresidents. However, there were also 129,930 people whose mother tongue was not English, anincrease of 9.6 per cent from 2011. German and Portuguese remained the top two mothertongues after English, representing three per cent (15,400 residents) and 1.9 per cent (9,780residents) of the total population respectively. Individuals with mother tongues other thanEnglish, notably Mandarin and Cantonese, are growing quickly, representing the shiftingdemographics of new waves of Canadians. While in 2011, Mandarin was the twelfth mostcommon mother tongue in Waterloo Region, by 2016, it had become the fourth mostcommon. 2282016 Region of Waterloo Census Bulletin #4 – LanguageWATERLOO REGION COMMUNTY PROFILE 2018
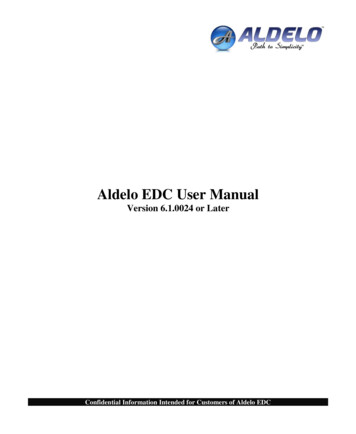
Region of Waterloo Economic Development1.2.1 Languages Spoken at HomeGenerally, an individual’s mother tongue will not necessarily be the same as the languagespoken most often at home. In Waterloo Region, 83 percent of individuals spoke English astheir primary home language, while the remaining population spoke a language other thanEnglish (12.4 percent), or a combination of English and a non-official language (4.2 percent). 3Less than half of the individuals with German or Portuguese mother tongues spoke theselanguages as their home language. Figure 3 shows mother tongue compared to home languagein Waterloo Region in 2011 and 2016.Figure 3: Mother tongue compared to home language in Waterloo Region, 2011 and 2016Source: 2016 Region of Waterloo Census Bulletin #4 – Language32016 Region of Waterloo Census Bulletin #4 – LanguageCHAPTER 1: DEMOGRAPHICS9
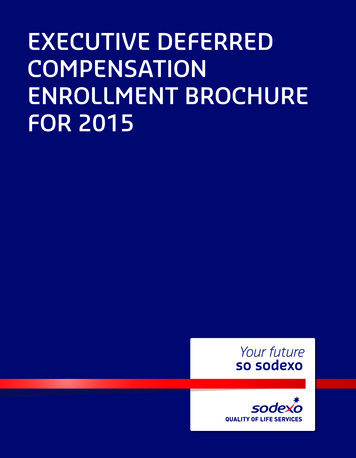
Region of Waterloo Economic Development1.3 Diversity1.3.1 Visible MinoritiesIn 2016, there were 100,025 individuals in Waterloo Region who identified themselves as avisible minority. In total, visible minorities made up 19.0 per cent of the total population. Thismarks a 6 per cent point increase compared to 2006. According to 2016 Census, WaterlooRegion had the 7th largest proportion of visible minorities in Ontario, and the second largestoutside of the GTA.4In Waterloo Region, over a quarter of the region’s visible minority population identified asSouth Asian. Following South Asian, the second and third most commonly reported visibleminority groups were Chinese (16 per cent of the visible minority population) and Black (15.1per cent of the visible minority population). Between 2006 and 2016, the number of peoplereporting these visible minorities increased substantially.Figure 4: Visible minority groups in Waterloo Region, 65,0000South st AsianSource: 2016 Region of Waterloo Census Bulletin #7 – Ethnic Origins, Visible Minorities and AboriginalPeoples4102016 Region of Waterloo Census Bulletin #7 – Ethnic Origins, Visible Minorities and Aboriginal PeoplesWATERLOO REGION COMMUNTY PROFILE 2018
Region of Waterloo Economic Development1.3.2 Immigrant PopulationWaterloo Region is increasingly attractive to international immigrants, with almost one in fourresidents born outside Canada. Between 2006 and 2016, the number of immigrants in WaterlooRegion increased by 13 per cent. In 2016, Europe was the most common birth place reported byimmigrants in Waterloo Region. Compared to past years, the numbers of European immigrantsliving in the region are declining. On the other hand, the numbers of immigrants born in Asiaare growing in numbers and make up over a third of the total immigrant population, comparedto just a quarter in 2006. 5 Figure 5 depicts the proportion of the region’s immigrant populationby place of origin.Figure 5: Place of birth for total immigrant population in Waterloo Region, 2016Source: 2016 Region of Waterloo Census Bulletin #8 – Mobility, Migration and Immigration52016 Region of Waterloo Census Bulletin #8 – Mobility, Migration and ImmigrationCHAPTER 1: DEMOGRAPHICS11
Region of Waterloo Economic Development1.4 Income Earners1.4.1 Low Income Measure (LIM)The LIM 6 is an income measure used by Statistics Canada to track families and individualsconsidered low income. LIM is defined as a fixed percentage of median adjusted householdincome. The adjusting is based on different family characteristics that change the needs of afamily. The Region of Waterloo has consistently had one of the lowest percentages of familiesbelow the LIM cut-off. Figure 6 below depicts the percent of all families in selected censusmetropolitan areas (CMAs) who are under the LIM cut-off (after-tax) from 2011 to 2015.Figure 6: Percentage of low income (after-tax) families by selected nCanada18.0%St. 0112012201320142015Source: Statistics Canada, CANSIM Table 111-0015Note: Axis for figure starts from 14.0%6The low-income measure that is used here is the Low Income Measure After Tax (LIM-AT) calculated based on 50per cent of the median after-tax household income.12WATERLOO REGION COMMUNTY PROFILE 2018
Region of Waterloo Economic Development1.4.2 Income DistributionFigure 7 depicts the distribution of after-tax income in 2015 for the income earners agedbetween 25 and 64 in Waterloo Region.Figure 7: Income distribution by age cohort in Kitchener-Cambridge-Waterloo, 201516.00%14.00%Percent of All Income Earners12.00%10.00%8.00%6.00%4.00%55 to 64 years45 to 54 years35 to 44 years2.00%25 to 34 years0.00%Source: Statistics Canada, CANSIM Table 111-0008CHAPTER 1: DEMOGRAPHICS13
Region of Waterloo Economic Development1.5 CrimeCrime rates have declined steadily since 2006 and rates are well below the Canadian average.Figure 8 below depicts the total criminal code violations (excluding traffic) and Figure 9 the totalviolent criminal code violations per 100,000 people for the time period of 2006 to 2016.Figure 8: Total Criminal code violations (excluding traffic) per 100,000 people 2007200820092010National ambridge-WaterlooSource: Statistics Canada, CANSIM Table 252-0051Note: Axis for figure starts from 4,000Figure 9: Total violent criminal code violations per 100,000 people 007200820092010National oSource: Statistics Canada, CANSIM Table 252-0051Note: Axis for figure starts from 70014WATERLOO REGION COMMUNTY PROFILE 2018
CHAPTER 2:WORKFORCE
Region of Waterloo Economic Development2.1 Labour Force Statistics2.1.1 Labour Force and Participation RateThe Kitchener-Cambridge-Waterloo’s labour force consisted of 303,400 people in 2017. Growthrates for the labour force are expected to be high in the medium to long term as strong growthand affordable living attract new residents and businesses to the area. Figure 10 below depictsthe region’s labour force, as well as the participation rate compared to the provincial andnational average. Participation rates in the Kitchener-Cambridge-Waterloo have consistentlybeen higher than Ontario and Canada’s rates since 2011, which means the region’s residentsare highly engaged in the workforce.Figure 10: Regional labour force and participation rates299,700300,000Labour Force ,00050.0%201120122013201420152016Participation Rate305,0002017Kitchener-Cambridge-Waterloo Labour ce: Statistics Canada, CANSIM Table 282-0129 & 282-0002Note: Axis for figure starts from 280,00016WATERLOO REGION COMMUNTY PROFILE 2018
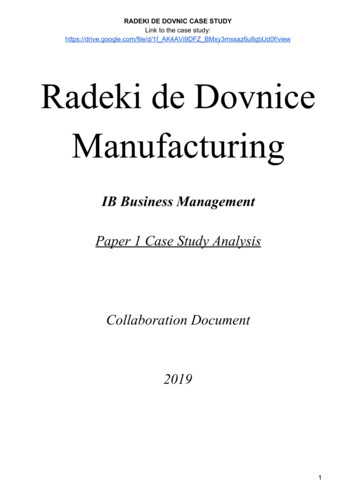
Region of Waterloo Economic Development2.1.2 Unemployment RateConsistent job growth and demand for the region’s highly skilled labour force has resulted inlow unemployment. In 2017, Kitchener-Waterloo-Cambridge CMA’s unemployment rate was5.1 per cent. The CMA’s unemployment rate dropped by almost half a per cent in 2017, and hasdropped by 4.6 per cent since the height of the recession in 2009. Figure 11 below depicts theunemployment rates for Kitchener-Cambridge-Waterloo, Ontario and Canada from 2011 to2017. Over this period, the CMA’s unemployment rate has remained below the provincial andnational rates.Figure 11: Unemployment Rate8.0Unemployment ario20162017CanadaSource: Statistics Canada, CANSIM Table 282-0129 & 282-0002CHAPTER 2: WORKFORCE17
Region of Waterloo Economic Development2.2 Highly Skilled Workforce2.2.1 Educational AttainmentAccording to the 2016 Census, over half of Waterloo Region residents aged 25 to 64 had acollege or university degree. From 2006 to 2016, the number of people with a college oruniversity qualification increased by 33,350 people or 26 per cent. Over the same period, thenumber of people without a high school diploma decreased by almost 18 per cent or by 7,180people. 7As Canada’s job market continues to evolve school graduates are more likely to pursuepostsecondary education to remain competitive in today’s economy. While in 2006, 31.7 percent of 25 to 34 year olds had a university education, and ten years later this had increased to36.5 per cent. Overall, young adults (aged 25 to 34) were more likely to have a universityeducation than any other age group.8Figure 12: Educational attainment by age cohort for Waterloo Region, 28%26%8%7%5%6%23%24%9%9%30%27%10%0%25 to 34 yearsNo certificate35 to 44 yearsHigh school diploma17%11%45 to 54 yearsTrades certificate or diploma55 to 64 yearsCollegeUniversitySource: 2016 Region of Waterloo Census Bulletin #9 – Employment and Education7,8182016 Region of Waterloo Census Bulletin #9 – Employment and EducationWATERLOO REGION COMMUNTY PROFILE 2018
Region of Waterloo Economic Development2.2.2 Major Field of StudyAs in 2006, young university graduates (aged 25 to 34) living in Waterloo Region in 2016 weremore likely to have degrees in social sciences, behavioural sciences or law than any otherdegrees (Figure 13). Between 2006 and 2016, the number of those with business, managementand public administration degrees increased more than the number of graduates in any otherfield. In 2016, there were 4,155 young graduates who had chosen this area of study, an increaseof 1,430 compared to 2006. Over this same decade, the number of graduates in health andrelated fields increased at a faster rate than for any other field, going from the eighth mostcommon degree in 2006 to fourth in 2016, an increase of 1,400 graduates. 9Graduates living in the Kitchener-Cambridge-Waterloo were more likely to have studied aScience, Technology, Engineering and Mathematics (STEM) subject than anywhere else inCanada, tied with Calgary. 10Figure 13: University field of study for individuals aged 25 to 34 with a Bachelor’s degree or above,2006 and 2016Number of graduates aged 25 to 346,0005,0004,0003,000200620162,0001,0000Source: 2016 Region of Waterloo Census Bulletin #9 – Employment and Education9 102016 Region of Waterloo Census Bulletin #9 – Employment and EducationCHAPTER 2: WORKFORCE19
Region of Waterloo Economic Development2.2.3 Tech Talent in Waterloo RegionWaterloo Region is home to two of the world’s largest quantum computing research facilities,the Mike & Ophelia Lazaridis Quantum-Nano centre at the University of Waterloo and theInstitutefor Quantum Computing, drawing talent from nearby major post-secondaryinstitutions. The incubators and innovation labs including Communitech, Velocity, theAccelerator Centre, the Innovation District and the Idea Quarter are hotspots for techcompanies in the area which help a large number of entrepreneurs
Region of Waterloo Economic Development 1.1.2 Median Age Waterloo Region's population is younger than most municipalities in Canada. In 2016, t he