Transcription
Slide 1CCACs Moving to the interRAI HC:Optimizing Care Coordination usingNew Evidence-Informed Decision Support AlgorithmsJanet McMullan, RN, BScN, MN, OACCACChi-Ling Joanna Sinn, BSc, PhD(c), University of WaterlooAaron Jones, BSc, MSc, OACCACNancy Ackerman, RN, BScN, OACCACMay 29, 2015Outstanding care – every person, every day
Slide 2Presenters: Janet McMullan, RN, BScN, MN, Clinical Program Lead, OACCAC Chi-Ling Joanna Sinn, BSc, PhD(c), School of Public Health and HealthSystems, University of Waterloo Aaron Jones, BSc, MSc, Health Data Analyst, Information Management, Nancy Ackerman, RN, BScN, Education Specialist, OACCACOACCACContributors: Gail Riihimaki, OT, MBA, Director, Client Services, HNHB CCAC Dr. John Hirdes, Professor and Home Care Research and Knowledge ExchangeChair, School of Public Health and Health Systems, University of Waterloo Nancy Curtin-Telegdi, MA, Clinical Educator, School of Public Health andHealth Systems, University of Waterloo
OutlineObjective: Learn about the progress of new evidence-informed clinical decision support algorithms for PersonalSupport and Long-term Care.Outline:1)2)3)4)Roll out of the Provincial Assessment SolutionPersonal Support AlgorithmDetermining Appropriateness of Care AlgorithmCRisis Identification and Situational Improvement Strategies(CRISIS) AlgorithmSlide 3
Slide 4BackgroundJanet McMullan, OACCACNancy Ackerman, OACCAC
Slide 5Transitioning to the interRAI HCAn evolution of assessment tools2002RAI HCwas firstintroduced inOntario2010interRAI CAand interRAI PCare introduced2017interRAI HCwill replacethe RAI-HC
Transitioning to the interRAI HCBetter supportpatient serviceplanningAccess to newand bling acoordinatedapproach tocareCompatibilityandstandardizationacross thehealthcaresectorAccess toupdatedinterRAIoutcome scalesRevisedassessment toincorporateclinicianfeedbackSlide 6
Moving Away from theRAI Aggregate ScoreSlide 7 RAI Aggregate Score was developed by CCACs to support CareCoordinators with decisions related to patient care planning.RAI Aggregate Score will not be available in theinterRAI HC.New decision support algorithms have been developed to promoteprovincial consistency by supporting decisions related to: allocation of personal support hours appropriateness of care needs for placement patient level of risk for immediate placement, andopportunities to modify risk through interventions.
RAI Aggregate ScoreSlide 8Every CCAC uses the RAI Aggregate Score differently Some CCACs use exact cut-offs by RAI Aggregate Score Service allocation amount by RAI Aggregate Score differ Service maximum amounts by RAI Aggregate Score differTable 2. Personal Support Guidelines CCAC BTable 1. Personal Support Guidelines CCAC ARAIScorePriorityAllocation ifnew referralAllocation ifon service0-10Low ormoderateAdmit towaitlistUp to 2hours/week11-16HighUp to 5hours/weekUp to 5hours/week17 Very highUp to 7hours/weekUp to 14hours/weekRAI ScorePriorityWaitlistAllocation1-6LowYesUp to 1hour/week7-10ModerateYesUp to 2.5hours/week11-13HighNoUp to 7hours/week14-16HighNoUp to 12hours/week17 Very highNoUp to 16hours/week
Task Group DevelopedSlide 9Collaborative effort across researchers, CCACs, and OACCAC – Education,Information Management, Technology, and Client Services Teamto address the need for new evidence-informed decision support algorithms.MembersGail Riihimaki, HNHB CCAC (Chair)Dr. John Hirdes, University of WaterlooIan Ritchie, NW CCACChi-Ling Joanna Sinn, University of WaterlooLaszlo Cifra, CE CCACNancy Curtin-Telegdi, University of WaterlooJennifer Wright, Central CCACLeslie Eckel, University of WaterlooValerie Armstrong, NSM CCACJenn Bucek University of WaterlooGayle Seddon, TC CCACHeather Binkle, OACCACAmy Mangone, NE CCACNancy Ackerman, OACCACAaron Jones, OACCACShelly Anne Hall, OACCACJanet McMullan, OACCAC
Development PrinciplesSlide 10 Patient needs for the purpose of resource allocation are clearlydistinguishable Clinical decision-making is equitable and consistent Decisions are fiscally responsible Decisions are evidence-informed and use the full range of toolsavailable Practical and simple to provide guidance for Care Coordinators
Decision-making andRole of the Care CoordinatorDevelop a patient-centered care plan based on:EvidenceClinicalExpertisePatientNeeds andPreferencesSlide 11
Slide 12Personal Support AlgorithmChi-Ling Joanna Sinn, University of Waterloo
OverviewSlide 13 The Personal Support algorithm provides aframework for allocating personal support Ranges from 1 to 6, where a higher group indicatesgreater need for personal support Developed using RAI-HC/interRAI HC andinterRAI CHA assessments in Ontario To support standard assessment and consistentservice levels across home and community care
Approach to Algorithm DevelopmentSlide 14 Grounded in: Clinical knowledge incorporate working groupfeedback from conception to implementation Existing practice use completed RAI-HCassessments Evidence apply rigorous statistical procedures andpursue face, convergent, and predictive validity Achieve balance between structure and flexibility indecision-making
Data Sources (RAI-HC) Unique RAI-HC assessments from 14 home careagencies in Ontario (Jan-Dec 2013) Excluded: hospital versions, received casemanagement or placement services only, fewer thanthree weeks of active service*, top 1% of personalsupport users (i.e., service maximums) Linked to actual services data Calculated weekly average of hours received within12 weeks of RAI-HC assessment N 128,169*Services include Nursing (visit/shift), Nutrition, PT, OT, SLP, Social Work, PSW, OtherSlide 15
Data Sources (interRAI CHA) Unique interRAI CHA assessments from threecommunity support agencies in Ontario(Jan-Dec 2013) N 1,985Slide 16
Slide 17Patient Attributes Associated withHours of Personal Support ReceivedPercent change in weeklyaverage personal support hours*200%“Average number of hours perweek changes by % for a oneunit/category increase in theindependent variable while allother variables are held 0%5%8% ADL and cognition scales were most stronglyassociated with more hours of personal support*Adjusted for CCAC
Developing Decision Trees Patient attributes were examined in decision trees Decision trees can identify attributes that contributeto personal support received for one group ofpatients, but not for another group E.g., IADL may only be a relevant factor for patients with lowADL needs, not high ADL needs This increases sensitivity to unique patient needs A number of decision tree options were exploredSlide 18
Selected Decision Tree*Note: The group will be calculated by software.Slide 19
Slide 20Selected Decision TreeThere are six levels,where 1 lowest need and6 highest need.*Note: The group will be calculated by software.
Slide 21Selected Decision TreeSelf-Reliance Index iscrosswalked from interRAI CAto RAI-HC/interRAI CHA and isthe first split.*Note: The group will be calculated by software.
Slide 22Selected Decision TreeThose who are “self-reliant”are in Group 1.*Note: The group will be calculated by software.
Slide 23Selected Decision TreeFor those who are “impaired”,the ADL Short scale is thesecond split.Lower personal support needs*Note: The group will be calculated by software.Higher personal support needs
Slide 24Selected Decision TreeAttributes can appearthroughout the tree or only incertain branches.*Note: The group will be calculated by software.
Slide 25EXAMPLE: Mrs. SmithIs she self-reliant or impaired?Impaired*Note: The patient level will be calculated by soft ware. This walkthrough is for illustration purposes only.
Slide 26EXAMPLE: Mrs. SmithWhat is her ADL Short score?0-3*Note: The patient level will be calculated by software. This walkthrough is for illustration purposes only.
Slide 27EXAMPLE: Mrs. SmithDoes she need supervision orany physical help in dressingupper body?Yes*Note: The patient level will be calculated by software. This walkthrough is for illustration purposes only.
Slide 28EXAMPLE: Mrs. SmithIs she impaired in dailydecision-making?No*Note: The patient level will be calculated by software. This walkthrough is for illustration purposes only.
Slide 29EXAMPLE: Mrs. SmithWhat is her IADL Capacityscore?0-3*Note: The patient level will be calculated by software. This walkthrough is for illustration purposes only.
Slide 30EXAMPLE: Mrs. SmithMrs. Smith falls in patientgroup 2 on the PersonalSupport algorithm*Note: The patient level will be calculated by software. This walkthrough is for illustration purposes only.
Do I Look at the Group or theBranch?Slide 31 Each group is a collection of branches that areMOST similar to each other and MOST differentfrom other groups Regardless of the exact attributes used, all patientswho fall in group 2 have similar need for personalsupport The group is the key piece of information
Slide 32Distribution of PatientsGroupNN 6%673275.7% The majority of patients belong to Groups 2 and 3
Slide 33Distribution of Personal Support HoursGroupHours per week N 13.116.365.7%11.31.96.312.014.820.6 Personal support hours increase within and betweengroups*All group means are significantly different from each other Hours are based on historical averages and do not necessarily reflect future allocation practices
Why This Model? Patient descriptions make sense This algorithm performs well in explainingvariability in personal support allocation anddifferentiating between groups Explained variance (or R2) Keep in mind that the current RUG-III/HC algorithmexplains 33.7% variance in total home care resourceuse (including informal hours)Slide 34
Slide 35Performance Over Time in OntarioPersonal SupportAlgorithmSampleR2RangeADL HierarchyR2(highest divided bylowest group means)Range(highest divided bylowest group means)Ontario 201330.8%32x26.2%6xOntario 201232.2%39x26.7%6xOntario 201131.4%36x25.5%5x Algorithm performs consistently over time Algorithm outperforms ADL Hierarchy in being ableto identify patients with the highest and lowestneeds for personal support
Slide 36Performance across Ontario % Algorithm performs well across all CCACs expected variation given different organizationalpractices
Slide 37Use in Clinical Practice:For Care Coordinators After completing theRAI-HC/interRAI HCassessment, the softwarewill electronically generatea group and range ofhours per week These numbers may beused as anchors to assistin assigning actual hours ofpersonal support HoursHours per week 10th50th90thPercentile(Lower range)Percentile(Median)Percentile(Upper .17.016.361.912.020.6Groupare based on historical averages and do not necessarily reflect future allocation practices
Slide 38Use in Clinical Practice:For Care Coordinators If your patient falls in group 2 on the algorithm: Decide whether the range is clinically reasonable Decide actual number of hours to allocate based on allsources of informationMedian1.7 hours/weekEvidenceClinicalExpertisePatientNeeds andPreferences0Lower range0 hours/week246Upper range5.2 hours/week810121416
Slide 39Use in Clinical Practice:For CCACs CCACs can use the groupsas a benchmarking tool forevaluating caseloads andcomparing to other CCACs HoursHours per week 10th50th90thPercentile(Lower range)Percentile(Median)Percentile(Upper .17.016.361.912.020.6Groupare based on historical averages and do not necessarily reflect future allocation practices
Use in Clinical Practice:For Home and Community Care A shared algorithm may be used to support Homeand Community-Based Care Coordination through: Coordinated access and intake On-going care coordinationSlide 40
Slide 41Distribution of Home andCommunity Care Patients50% 45.5%44.8%45%Expected distributionof both samples 40%35%28.6%30%28.2% 0%0.3%0%1CRAI-HC Sample234interRAI CHA Sample56 CCAC patients havegenerally higherpersonal supportneedsCSS patients havegenerally lowerpersonal supportneedsGroup 2 is the largestgroup for both CCACand CSS samples
Acknowledgments This work was supported by funding from HamiltonNiagara Haldimand Brant CCAC and the OntarioHome Care Research and Knowledge ExchangeChairSlide 42
Slide 43Long-Term Care Home Eligibilityand Priority CategoryAaron Jones, OACCAC
OverviewAppropriateness of Care Needs Algorithm Development Performance ImplicationsCRISIS Algorithm Development Performance UsesSlide 44
Ontario Long Term Care Homes ActCriteria for eligibility, long-stay79/10Slide 45(a) the person is at least 18 years of age.(b) the person is an insured person under the HealthInsurance Act(i) requires that nursing care be available on site 24 hours a day,(ii) requires, at frequent intervals throughout the day,assistance with activities of daily living, or(iii) requires, at frequent intervals throughout the day, on –sitesupervision or on –site monitoring to ensure his or her safety orwell being;the publicly-funded community -based servicesavailable to the person and the other caregiving,support or companionship arrangements availableto the person are not sufficient, in any combination,to meet the person’s requirements; and(e) the person’s care requirements can be met in a long termcare home.How can we determine which patients have eligible careneeds?
Current Placement Eligibility TreeSlide 46
Data Selection and Model DevelopmentSlide 47 Long-Stay Home Care referrals from August 2010 – July 2012 RAI-HC assessment within 45 days No previous LTCH referrals No hospital assessments N 88,492 Two-year follow-up for placement in a LTCH Modelled factors most predictive of placement A vs. B priority category also examined
New Placement Eligibility TreeSlide 48
Predictive Validity - MAPLe LevelsSlide 49 Line separation indicates differentiation in risk of placement
Predictive Validity - MAPLe LevelsSlide 50Moderate Subdivision The Moderate subdivisions are close to the High and Mild levels
Slide 51ImplicationsRAI-scoreNewAlgorithm% of Long-Stay Home Care Population with care needsappropriate for placement80.25%70.83%% of MAPLe Moderate Population with care needs appropriate forplacement77.17%53.97%% of patients found Eligible for LTCH Placement in last year thatdo not have care needs appropriate for placement0%*5.34%*Probable Change*Other than Exceptional Cases Reduction in % of patients appropriate for placement. 5% of eligible LTCH referrals in the last year would nothave been eligible on the basis of their care needs withinthe new definition.
Slide 52Long Term CareCRISIS AlgorithmAaron Jones, OACCAC
BackgroundCrisis Priority Category Intended to identify requiring immediate placement on thebasis of their needs and circumstances Dramatic variation assignment to crisis priority categoryacross CCACsGoals Improve provincial consistency Improve use of Crisis Priority Category to prioritize patientsbased on patient need and appropriatenessSlide 53
CRISIS AlgorithmCRisis Identification and Situation Improvement Strategies Identifies patient’s level of risk for immediate placementthrough the crisis priority category Identifies risk areas and identifies clinical assessmentprotocols (CAPs) that may be used to modify the situationthrough interventions to reduce patient risk and preventcrisis placementsIs a patient at risk for immediate placement?What are the risks?What can be done about it?Slide 54
Uses of the CRISIS AlgorithmSlide 55Guide care planning to avoid preventable crisis placementsSupport decision-making around the crisis priority categoryRank patients within the crisis categoryBenchmarking and comparative reporting
Data and DevelopmentSlide 56 Placement patients from April 2011 though December 2014 RAI-HC asessments closely linked to a priority No hospital assessments No previous LTCH placement N 18,375 90-day follow-up for crisis placement Modelled factors most predictive of crisis placement
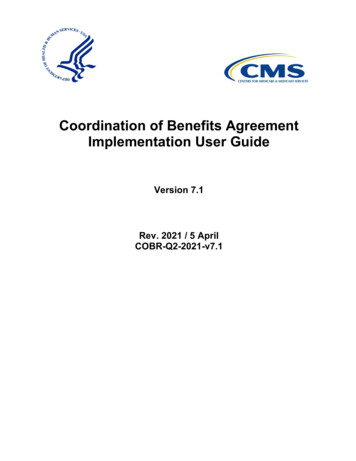
Two-Stage ProcessStep 1:Patients categorized into 7distinct clinical groupsAbusive Relationship CAPHigh ADL ImpairmentWanderingBehaviour, Delusions orHallucinationsCognitive ImpairmentModerate ADL ImpairmentMild ADL ImpairmentSlide 57Step 2:Patient attributes frominterRAI HC guide classificationinto 1 of 5 levels of risk
Step 1: Clinical CategoriesSlide 58Abusive Relationship CAPHigh ADL ImpairmentWanderingBehaviour, Delusions or HallucinationsCognitive ImpairmentModerate ADL ImpairmentMild ADL Impairment Patients fall into the firstcategory for which they meetcriteria. Lower categories representgenerally decreasing risk. Risk still varies dramaticallywithin categories.
Clinical Categories DefinitionsClinical CategoryAbusive Relationship CAPHigh ADL ImpairmentWanderingBehaviour, Delusions orHallucinationsCognitive ImpairmentModerate ADL ImpairmentMild ADL ImpairmentSlide 59CriteriaAny of K9a, K9b, K9d 1ADL Hierarchy 4-6E3a 1 or 2Any of E3b – E3e 1 or 2, or K3f 1or K3g 1B2a 3 or 4ADL Hierarchy 2-3ADL Hierarchy 0-1
Abusive RelationshipCAPStep 2: Level-of-Risk ClassificationAbusive Relationship CAP5HighCaregiver DistressModerateLow4Slide 60
Slide 61High ADL ImpairmentHigh ADL ImpairmentCognitiveDecision-MakingHighCaregiver DistressModerateLow4YesRecent Decline4NoHighCaregiver DistressModerateLow33,40,1,254
Slide 62Wandering5WanderingLive-in CaregiverNoYesHigh4Caregiver DistressLive-in CaregiverNo4YesModerateLow3YesRecent DeclineNo3
Slide 63Behaviour, Delusions,HallucinationsBehaviour, Delusions, HallucinationsYesDRS 6 w/Mood cent essHigh3ModerateLow2
Slide 64Cognitive ImpairmentCognitive giverDistressRecent DeclineNo3HighCaregiver DistressModerateLow2High4ModerateLow3
Slide 65Moderate ADL ImpairmentModerate ADLImpairmentCaregiver DistressHighModerateLowYes43Recent Decline3NoHighCaregiver DistressModerate2Low1
Slide 66Mild ADL ImpairmentMild ADL Impairment3HighCaregiver DistressModerateYesLowRecent Decline2No1
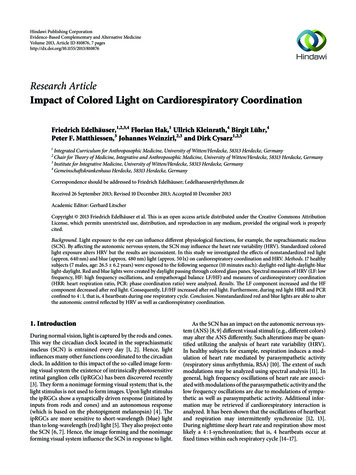
CRISIS AlgorithmSlide 67CRISIS5 - Very High4 – High3 – Moderate2 – Mild1 – LowThe Numbers 7 Clinical RiskCategories 33 Terminal Nodes 5 Levels of Risk
CRISIS AlgorithmSlide 68CRISIS5 - Very High4 – High3 – Moderate2 – Mild1 – LowThe Numbers 7 Clinical RiskCategories 33 Terminal Nodes 5 Levels of Risk
CRISIS AlgorithmSlide 69CRISIS5 - Very High4 – High3 – Moderate2 – Mild1 – LowThe Numbers 7 Clinical RiskCategories 33 Terminal Nodes 5 Levels-of-Risk
Patient ExampleSlide 70Patient Characteristics Aggressive BehaviourDeclined recently in self-sufficiencyDeliriumCaregiver is in high distressCRISIS Algorithm OutputsCRISIS Level-of-Risk:4-HighClinical Risk Category – Behaviour, Delusions, or HallucinationsKey CAPs to Modify Risk – Behaviour, Delirium
Predictive ValiditySlide 71Placement Population (Jan. 1 – Dec. 31 2014)90-Day Crisis Placement% Placed as Crisis within 90 0%13.19%10.00%5.00%5.28%2.00%0.00%123CRISIS Level45 The proportion of patients placed as a crisisincreases steadily across levels
Predictive ValiditySlide 72Placement Population (Jan. 1 – Dec. 31 2014) AUC (Area Under the Curve) 0.728 (0.686 – 0.780) by CCAC More predictive in CCACs with lower overall rates of placement
DistributionsSlide 73Placement Population (Jan. 1 – Dec. 31 2014)Clinical Category%Abusive Relationship CAP1.29%CRISIS%High ADL Impairment14.68%5 - Very High2.82%Wandering7.81%4 – High21.39%Behaviour, Delusions, Hallucinations17.50%3 – Moderate31.92%Cognitive Impairment13.21%Moderate ADL Impairment16.94%2 – Mild22.98%Mild ADL Impairment28.58%1 – Low20.89%Total100.00%Total100.00%
Important PointsCrisis placement is not always the best careoption for patients with a high CRISIS level. Itis important to consider interventions to modifyrisk of immediate placement, e.g., delirium.CRISIS Algorithm supports clinical decisionmaking and does not automate the process.CRISIS Algorithm is different from the MAPLe.Slide 74
Slide 75Next StepsJanet McMullan, OACCACNancy Ackerman, OACCAC
Next Steps Pilot Testing for user acceptance: Personal Support Algorithm – Early June 2015,Long Term Care Algorithms – Late June 2015,Final Report to PCSC – November 2015,Six CCACs participating – HNHB, MH, Central,Central West, Central East, North West. Review through interRAI processes. Consider opportunities for use with the interRAICHA. Finalize algorithms for use with transition tothe interRAI HC.Slide 76
Slide 77
Ian Ritchie, NW CCAC : Chi-Ling Joanna Sinn, University of Waterloo . Laszlo Cifra, CE CCAC : Nancy Curtin -Telegdi, University of Waterloo . Jennifer Wright, Central CCAC : Leslie Eckel, University of Waterloo . Valerie Armstrong, NSM CCAC : Jenn Bucek University of Waterloo . Gayle Seddon, TC CCAC : Heather Binkle, OACCAC . Amy Mangone, NE CCAC