Transcription
EP16: Missing Values in Clinical Research:Multiple Imputation3. Analysis & PoolingNicole ErlerDepartment of Biostatistics, Erasmus Medical CenterR n.erler@erasmusmc.nl
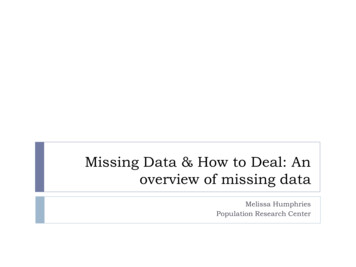
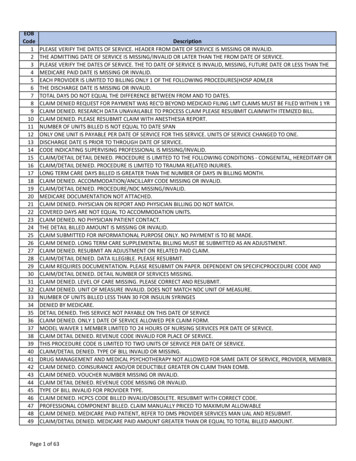
Analysis StepMultiple imputed .6.X42.0-1.4-1.0.1
Analysis StepAnalysis model of interest, e.g.,x1 β0 β1 x2 β2 x3 β3 x4 ε2
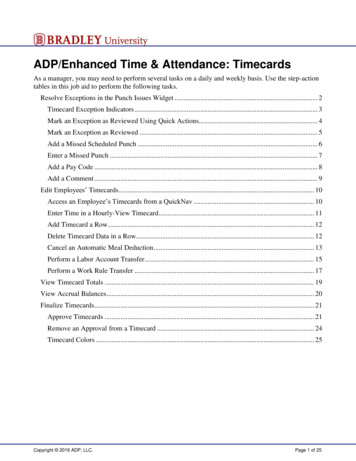
Analysis StepAnalysis model of interest, e.g.,x1 β0 β1 x2 β2 x3 β3 x4 εMultiple sets of results:est.seβ0 -0.15 0.220.16 0.02β1β2 -0.59 0.03β30.28 030.032
PoolingWhy pooling?Recall from Section 1:We need to represent missing values by a number of imputations.á m imputed datasets3
PoolingWhy pooling?Recall from Section 1:We need to represent missing values by a number of imputations.á m imputed datasetsFrom the different imputed datasets we get different sets of parameterestimates, each of them with a standard error, representing theuncertainty about the estimate.3
PoolingWhy pooling?Recall from Section 1:We need to represent missing values by a number of imputations.á m imputed datasetsFrom the different imputed datasets we get different sets of parameterestimates, each of them with a standard error, representing theuncertainty about the estimate.We want to summarize the results and describe how (much) theresults vary between the imputed datasets.3
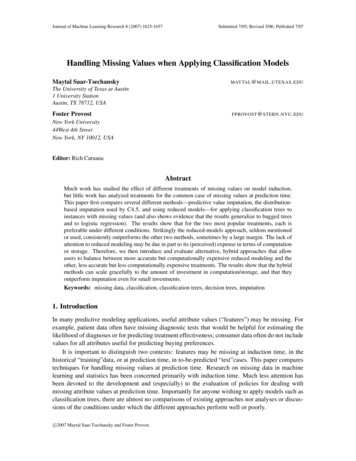
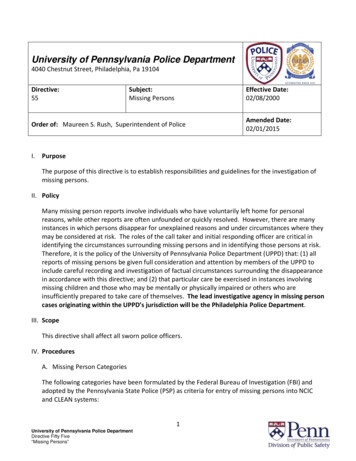
PoolingIn the results from multiply imputed data there are two types ofvariation/uncertainty:I within imputation (represented by the confidence intervals)I between imputation (horizontal shift between results)(Intercept)imp 3 imp 2imp 1x3 x2x4 parameter estimate & 95% confidence interval4
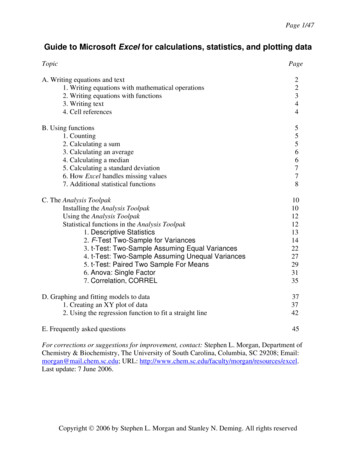
PoolingTo summarize the results, we can take the mean of the results from theseparate analyses. This is the pooled point estimate.(Intercept)imp 3 imp 2imp 1x3 x2x4 parameter estimate & 95% confidence interval5
PoolingTo summarize the results, we can take the mean of the results from theseparate analyses. This is the pooled point estimate.(Intercept)imp 3 imp 2imp 1x3 x2x4 parameter estimate & 95% confidence intervalBut does the same work for the standard error (or bounds of the CIs)?5
PoolingTo summarize the results, we can take the mean of the results from theseparate analyses. This is the pooled point estimate.(Intercept)imp 3 imp 2imp 1x3 x2x4 parameter estimate & 95% confidence intervalBut does the same work for the standard error (or bounds of the CIs)?The averaged CI’s (marked in red) seem to underestimate the totalvariation (within between).5
Rubin’s RulesThe most commonly used method to pool results from analyses ofmultiply imputed data was introduced by Rubin (1987), hence Rubin’sRules.Notation:m: number of imputed datasetsQ : quantity of interest (e.g., regr. parameter β) from -th imputationU : variance of Q (e.g., var(β) se(β)2 )Pooled parameter estimate:Q̄ m1 XQ̂ m 16
Rubin’s RulesThe variance of the pooled parameter estimate is calculated from thewithin and between imputation variance.Average within imputation variance:Ū m1 XÛ m 1Between imputation variance:B m T 1 XQ̂ Q̄Q̂ Q̄m 1 1Total variance:T Ū B B/m7
Rubin’s RulesConfidence intervals for pooled estimates can be obtained using thepooled standard error T and a reference t distribution with degreesof freedom 1ν (m 1) 1 rm 2,is the relative increase in variance that is due to thewhere rm (B B/m)Ūmissing values.The (1 α) 100% confidence interval is then Q̄ tν (α/2) T,where tν is the α/2 quantile of the t distribution with ν degrees offreedom.8
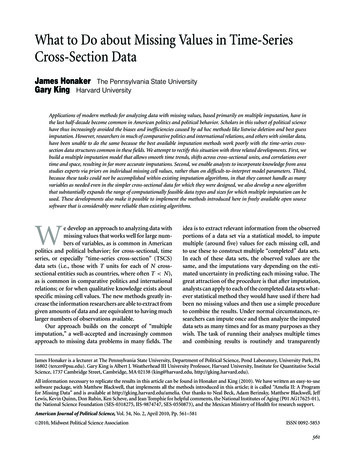
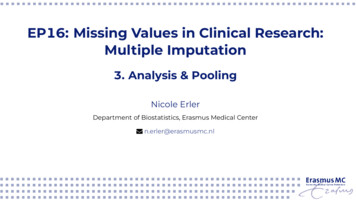
Rubin’s Rules(Intercept)imp 3 imp 2imp 1x3 x2x4 parameter estimate & 95% confidence interval9
Rubin’s Rules(Intercept)imp 3 imp 2imp 1x2x3 x4 parameter estimate & 95% confidence intervalThe corresponding p-value is the probability Pr F1,ν Q0 Q̄ 2 /T ,where F1,ν is a random variable that has an F distribution with 1 and νdegrees of freedom, and Q0 is the null hypothesis value (typically zero).9
ReferencesRubin, D. B. (1987). Multiple imputation for nonresponse in surveys.Wiley. https://books.google.nl/books?id 0KruAAAAMAAJ10
Multiple Imputation 3. Analysis & Pooling Nicole Erler Department of Biostatistics, Erasmus Medical Center R n.erler@erasmusmc.nl. Analysis Step Multiple imputed datasets: . I within imputation (represented by the confidence intervals) I between imputation (horizontal shift between results) l l l l l l l l l l l l (Intercept) x2 x3 x4 imp 1