Transcription
Hydrology for Urban land PlanningA Guidebook on the HydrologicEffects of Urban land Use
Hydrology for Urban land PlanningA Guidebook on the HydrologicEffects of Urban Land UseBy Luna B. leopoldGEOLOGICALSURVEYWashington 1968CIRCULAR554
United States Department of the InteriorGeological SurveyV. E. McKelvey, DirectorFirst printing 1968Second printing 1969Third printing 1972Fourth printing 1975Free on application fo the U.S. Geological Sutvey, National Center, Reston, Va. 22092
CONTENTSPagE'Planning procedures and hydrologic variables -----------------------------Availability of data and the technique of analysis --------------------------Effect of urbanization on increasing frequency of overbank flow -------------Local storage to compensate for peak flow increase ------------------------Sediment production --Effect of increased peak flows on sediment yield ----------------------------VVater quality --------Selected references -----1 '1111115'15'uILLUSTRATIONSFIGURES 1-8. Graphs showing:1. Hypothetical unit hydrographs relating runoff to rainfall,with definitions of significant parameters ---------2. Effect of urbanization on mean annual flood for a !-squaremile drainage area ------------------------------3. Flood-frequency curve for partial-duration series, WestBranch Brandyine Creek at Coatesville, Pa., basedon data for 1942, 1944-51 ------------------------4. Regional flood-frequency data for the Brandywine Creekbasin, Pennsylvania -----------------------------5. Flood-frequency curves for a 1-square-mile basin invarious states of urbanization --------------------6. Increase in number of flows per year equal to or exceedingoriginal channel capacity ( 1-square-mile drainagearea), as ratio to number of overbank flows beforeurbanization, for different degrees of urbanization7. Annual sediment production per square mile for urbanizedand natural areas -------------------------------8. Relation of sediment yield and discharge for an urban anda rural or unurbanized area ease in discharge as a result of urbanization in a 1-square-milearea ---III4
HYDROI.OGY FOR URBAN LAND PLANNING-A GUIDEBOOK ON THE HYDRC LOGICEFFECTS OF URBAN LAND USEBy LUNA B. LEOPOLDThis circular attempts to summarize existingknowledge of the effects of urbanization onhydrologic factors. It also attempts to expressthis knowledge in terms that the planner canuse to test alternatives during the planningprocess. Because the available data used inthis report are applied to a portion of theBrandywine Creek basin in Pennsylvania, thiscan be considered as a report on the basic hydrologic conditions of the Brandywine Creekbasin prior to the beginning of major urbanization. Because the available data are not yetadequate, this report can be considered as acompilation of tentative suggestions in theform of an explanatory, not a definitive,.handbook.opportunities offered by the principal physiographic characteristics of the area, especiallythe location of hillslopes, soils, and F reams.The existing pattern of land use and the accompanying distribution of woods and agriculture are parameters which over a pr.riod ofyears may actually change, albeit slowly. Roads,villages, industries, and other manm de features are more or less permanent an exerttheir greatest influence in their erect onfurther development, especially through landvalues.Of particular concern to the planner arethose alternatives that affect the hydrologicfunctioning of the basins. To be interpretedhydrologically, the details of the land-use pattern must be expressed in terms of hy irologicparame ers which are affected by land use.These parameters in turn become hydrologicvariables by which the effects of alternativeplanning patterns can be evaluated in hydrologic terms.The application of current knowledge of thehydrologic effects of urbanization to theBrandywine should be viewed as a forecast ofconditions which may be expected as urbanization proceeds. By making such forecasts inadvance of actual urban development, themethods can be tested, data can be extended,and procedures improved as verification becomes possible.There are four interrelated but separableeffects of land-use changes on the hydrology ofan area : changes in peak flow characteristics,changes in total runoff, changes in quality ofwater, and changes in the hydrologic antenities.The hydrologic amenities are what might becalled the appearance or the impressio whichthe river, its channel and its valleys, lea,.,es withthe observer. Of all land-use changes ffectingthe hydrology of an area, urbanization is byfar the most forceful.PLANNING PROCEDURES AND HYDROLOGICVARIABLESA planning document presented to a community for adoption must always be more suggestive than coercive. This is true not onlybecause the planner is unable to foresee theinnumerable complications of actual development, but also because there are many detailedalternatives which would accomplish generallysimilar results. The planner is particularlyconcerned with both the constraints and theRunoff, which spans the entire reg:men offlow, can be measured by number and }1y characteristics of rise in streamflow. Th many1
rises in flow, along with concomitant sediment water recharge and decreased low flows. Thus,loads, control the stability of the stream chan- increased imperviousness has the effect of innel. The two principal factors governing flow creasing flood peaks during storm periods andregimen are the percentage of area made im- decreasing low flows between storms.pervious and the rate at which water is transThe principal effect of land use on sedimentmitted across the land to stream channels. The comes from the exposure of the 1mil to stormformer is governed by the type of land use; the runoff. This occurs mainly when bare groundlatter is governed by the density, size, and char- is exposed during construction. It is wellacteristics of tributary channels and thus by the known that sediment production ir sensitive toprovision of storm sewerage. Stream channels land slope. Sediment yield from urban areasform in response to the regimen of flow of the tends to be larger than in unurb .nized areasstream. Changes in the regimen of flow, even if there are only small and widely scatwhether through land use or other changes, tered units of unprotected soil in the urbancause adjustments in the stream channels to area. In aggregate, these scattere if bare areasaccommodate the flows.are sufficient to yield considerable sediment.A major effect of urbanization is the introThe volume of runoff is governed primarilyby infiltration characteristics and is related to duction of effluent from sewage dirposal plants,land slope and soil type as well as to the type and often the introduction of raw sewage, intoof vegetative cover. It is thus directly related channels. Raw sewage obvioufly degradesto the percentage of the area covered by roofs, water quality, but even treated effluent constreets, 3nd other impervious surfaces at times tains dissolved minerals not extra eted by sewage treatment. These minerals act as nutrientsof hydrograph rise during storms.and promote algae and plankton growth in aA summary of some data on the percentagestream. This growth in turn alters the balanceof land rendered impervious by different dein the stream biota.grees of urbanization is presented by Lull andLand use in all forms affects vrater quality.Sopper (1966). Antoine (1964) presents thefollowing data on the percentage of impervious Agricultural use results in an increase of nutrients in stream water both from the excretionsurface area in residential properties:products of farm animals and from commerLot size oflmpcrviottscial fertilizers. A change from ag icultural useresidential areasurface area(sq ft)(percent)to residential use, as in urbanization, tends to6,000 00 -------------------------------40 reduce these types of nutrients, l' tt this tend15,000 -------------------------------------25 ency is counteracted by the widely scatteredpollutants of the city, such as oil and gasolineThe percentage decreases markedly as size product. , which are carried through the stormof lot increases. Felton and Lull ( 1963) esti- sewers to the streams. The net result is genmate in the Philadelphia area that 32 percent erally an adverse effect on water quality. Thisof the surface area is impervious on lots averag- effect can be measured by the balance anding 0.2 acre in size, whereas only 8 percent variety of organic life in the stream, by theof the surface area is impervious on lots averag- quantities of dissolved material, and by theing 1.8 acres.bacterial level. Unfortunately data describingAs volume of runoff from a storm increases, quality factors in streams from urban versusthe size of flood peak also increases. Runoff unurbanized areas are particularly lacking.volume also affects low flows because in anyFinally, the amenity value of the hydrologicseries of storms the larger the percentage of di- environment is especially affected by threerect runoff, the smaller the amount of water factors. The first factor is the stability of theavailable for soil moisture replenishment and stream channel itself. A channel, which isfor ground-water storage. An increase in total gradually enlarged owing to increased floodsrunoff from a given series of storms as a result caused by urbanization, tends to have unstableof imperviousness results in decreased ground- and unvegetated banks, scourf1 or muddy2
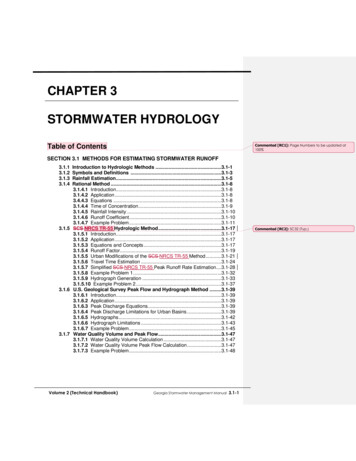
game fish give way to less desirable: species.Although lack of quantitative objectiv data onthe balance of stream biota is often a handicapto any meaningful and complete evaluation ofthe effects of urbanization, qualitative observations tend to confirm these conclusions.channel beds, and unusual debris accumulations. These all tend to decrease the amenityvalue of a stream.The second factor is the accumulation of artifacts of civilization in the channel and on theflood plain: beer cans, oil drums, bits of lumber,concrete, wire-the whole gamut of rubbish ofan urban area. Though this may not importantly affect the hydrologic function of thechannel, it becomes a detriment of what is herecalled the hydrologic amenity.IV'):X:u.0zLUa:::c:(a:::Iuc:( Hydrographof stream flowI0.u.IIILUCenter of massof runoffand of rainfallV')LUQ.One factor stating the relation bet·veen thestorm and the runoff is lag time. This is definedas the time interval between the center of massof the storm precipitation and the center ofmass of the resultant hydrograph. Lag time isa function of two basin parameters-the meanbasin slope and the basin length. Ther factorsempirically correlate with lag time if xpressedin the form of the basin ratio (basin length Ldivided by the square root of the mean basingradient, s). This basin ratio is also related todrainage area. As drainage area increases, thebasin length increases and the aver .ge valueof slope generally decreases. Thus:, naturalbasin characteristics can be translated intoflood-flow characteristics.1LULUu.TIME, IN HOURS--- uCD::Juz LagtimeII:X:IIIIV')ILU .!)a:::c:(u0after urbanizationII/:II/IIIIl\yoriginal\\TE HNIQUEBasic hydrologic data on both peak flow andvolume of runoff may be expressed in terms ofthe characteristics of the unit hydrograph, thatis, the average time distribution graplt of flowfrom a unit or standard storm. The unit hydrograph shows the percentage of the totalstorm runoff occurring in each succe ,sive unitof time. The standard storm may be:, for example, a typical storm which produced 1 inchof runoff (fig. 1). Such data are derived fromthe study of individual storms and the associated runoff graphs measured at gagingstations. Lag timetzzAVAILABILITY OF DATA AND THEOF ANALYSISAfter urbanization ILag time may be materially alterc.ri by theeffects of urbanization on the basin surface.Water runs off faster from streets and roofsthan from natural vegetated areas. This tendsto decrease the lag time. The construction ofartificial channels, especially storrr sewers,also decreases lag time. As the time requiredfor a given amount of water to run off shortens,the peak rate of runoff (flood peak) increases.TIME, IN HOURS-- Figure !.-Hypothetical unit hydrographs relatingrunoff to rainfall, with definitions ofsignificant parameters.The third factor is the change brought onby the disruption of balance in the streambiota. The addition of nutrients promotes thegrowth of plankton and algae. A clear stream,then, may change to one in which rocks arecovered with slime ; turbidity usually increases,and odors may develop. As a result of increasedturbidity and reduced oxygen content desirableIn addition to the basin ratio and lag time,the regimen of a stream, however, c;:-,n be described in many other ways, including flood3
basins, for partly sewered, and for completelysewered basins. As in most stud s the difficulty comes in translating these descriptiveterms to quantitative measures of urbanization.From data presented by Carter, values wereread for a basin ratio of 0.12 re')re enting a1-sq-mi area having an estimated length of 1.2miles and an average slope of 100 feet per mile.It was further assumed that in Czrter's study,"partly sewered" is equivalent t ' 50 percentsewered and 20 percent impervious. Theseconditions provide some of the d ta shown intable 1.frequency, flow duration, mean annual flood,discharge at bankfull stage, and frequency ofbankfull stage. This is evidenced in past studiesof the effects of urbanization on the hydrologyof an area. Many different techniques of relating rainfall to runoff have been used, alongwith various parameters to measure the degreeof urbanization. In order to evaluate our present knowledge, it is necessary to express theresults of these studies in some common denominator.Most reports on hydrologic effects of urbanization present the conclusions in a form whichis more useful to the hydrologist than to theurban planner. This circular will attempt tointerpret the hydrologic conclusions of thesestudies in terms that are meaningful to theplanner. Two forms of presentation will beused.Table !.-Increase in discharge as a result of urbanization in a 1-square-mile area[Discharge is mean annual flood; recurrence int rval is 2.3 years.Data are expressed as ratio of discharge aft, r urbanization todischarge under previous conditions. Data from James (1965) haveno superscript]1Percentage of areaserved by storm seweragePercentage of area made impervious0The :first is a slight modification of a methodpreviously used by several investigators, especially D. G. Anderson (1968) and L. D.James ( 1965) . The percentage of an areasewered is plotted against the percentage of thearea rendered impervious by urbanization;isopleth lines (lines of equal value of the ratio)on the graph show the ratio of peak dischargeunder urbanized conditions to the peak discharge under rural or unurbanized conditions.Such a graph will be different for differentdrainage area sizes and for different flow frequencies.0{1.020{1.1{80100Anderson (1968) .Martens (1966).Wilson ( 1966) . Carter ( 1961) .12The second method utilizes a relationship between the degree of urbanization and the frequency at which the original channel capacitywould be exceeded.31.6{8011.821.71.612.222.22.03 1.91.82.213.22.014.72.5201.41.3505011.221.31.31.74 2.112.85 3.76 2.01.61.913.62.02.534.23.214.72.8 Wiitala ( 1).6 Espey,Morgan,(1966).5.616.03.64and MaschAs an indication of the change in imperviousarea resulting from urbanization, Harris andRantz (1964) showed that an ar a near PaloAlto, Calif., changed from 5.7 percent to 19.1percent impervious in a 10-year r riod.Table 1 is an interpretation and summary ofthe effects of urbanization on peak dischargesbased on previous studies. Results of thestudies were interpreted and extrapolated to acommon denominator of 1 sq mi (square mile),a practical unit of size for planning.One of the most complete analyses of urbanization effects was made by D. G. Anderson(1968) in his study of the urbanization inFairfax County, Va., near the metropolitancomplex of the Nation's Capital. Anderson'sanalysis follows the procedure sugr-o.sted earlierby Carter, but Anderson includ d a largerarray of data from 64 gaging stations. Anderson closely confirmed the conclusio:'ls of Carter,but he :!arried the analysis furthe1· in a plot ofCarter (1961) developed a technique thatfollowed the reasoning previously used bySnyder (1938) and that showed lag time as afunction of basin characteristics. For 20streams in the vicinity of Washington, D.C.,Carter developed this relation for natural4
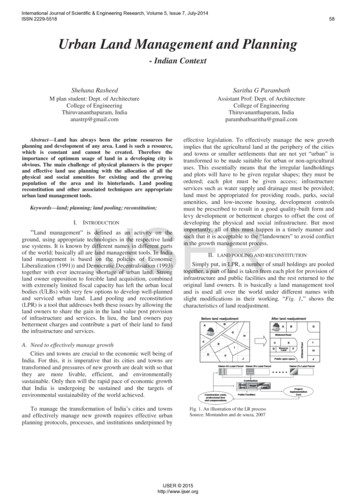
Espey, Morgan, and Masch (1966) analyzedrunoff data from urban and rural areas inTexas. To utilize this study, data vrere usedcorresponding to a basin length of f.500 feetand a slope of 0.02. It was also assmned fromhis desc:ription of the area that "urban" couldbe expressed as 50 percent sewered and 20percent impervious.the ratio of peak discharge to the mean annualflood for different percentages of basin imperviousness and for flood flows exceeding themean annual flood. For table 1, data fromAnderson's study were read directly from hisgraph at the 2.33-year recurrence interval andexpressed two separate conditions of sewerage.The first condition was expressed as "mainchannels natural, upstream drainage sewered";this was assumed to be 50 percent sewered. Thesecond condition was expressed as "completelysewered drainage basin" ; this was assumed tobe 100 percent sewered.James (1965) analyzed runoff dat . from a44-sq-mi basin south of Sacramento, Calif.,within which 12 sq mi had been urbanized.From the basic data on flow, he obt .ined empirical coefficients used to route a series ofsynthetic flows by using a mathemati al modelexpressed as a digital computer prog1·am. Theresults were plotted in a series of curues whichseparated the effects of flood frequency, drainage area, and degree of urbanization. Thoughthe derived curves do not present field data,they also were incorporated into table. 1.Wiitala (1961) presented data on urbanizedversus rural conditions for a medium-sizedwatershed in Michigan. His data were translated into a ratio of peak discharges and it wasassumed from his report that the urbanizedcondition represented 20 percent imperviousarea and 50 percent sewered area.Thus in table 1 are compiled, wit'! certainnecessary assumptions, the data for seven published and unpublished references vrhich report measurements of the effect of urbanization on peak flow. Although interrretationswere necessary to express the d gree ofurbanization in quantitative terms, there isconsiderable agreement among the data.Martens ( 1966) reported on three smalldrainage basins in and near Charlotte, N.C.Using flood-frequency curves from long-termrecords at gaging stations in the State, heconstructed a graph similar to that of Anderson; that is, ratio to mean annual flood forvarious degrees of basin imperviousness. Asbefore, the difficulty lies in ascertaining therelation of Martens' urbanized condition to thedegree sewered. In reading from Martens'graph for recurrence interval 2.33 years, it isassumed that the conditions he discussed include n0 sewerage and represent changes inimpervious area only.Wilson (1966) presented data on flood frequency for four drainage basins of 1.1 to 11.2sq mi near Jackson, Miss. He presented hisanalysis in the form of discharge of mean annual flood plotted against drainage area size,and he interpolated lines to represent the percentage of the basin having storm sewers andimproved channels. It is assumed that hisdescription "20 percent of basin with stormsewers and improved channels" would beequivalent to 20 percent impervious and 20percent sewered. Similarly, his value of 80percent was assumed to be 80 percent seweredand 80 percent impervious.0u.J ""u.J"' 40"" u.J !) 20zu.Ju"".u.JPERCENTAGE OF AREA IMPERVIOUSFigure 2.-Effect of urbanization on mean annualflood for a 1-square-mile drainage area.(Based on data from table 1.)5
catastrophic event is rare, and the storm ofordinary magnitude is frequent. hese eventscan be arranged in order of ma nitude andcounted. For example, all dischar events exceeding 400 cfs (cubic feet per second) can betabulated from the record at a stream-gagingstation and arranged in order of magnitude;the val11es in the array can be plotted as adischarge-frequency curve. This has been donefor the gaging station on West Branch Brandywine Creek at Coatesville, Pa., for 9 years ofrecord (fig. 3) . The theory and practice ofconstructing such flow-frequency c·1rves is wellknown. The plotting position or frequencyoften used is defined asData from table 1 have been transposed intothe graph shown in figure 2. The ratios of peakdischarge of urbanized to rural areas are presented for different percentages of sewerageand impervious area ; lines of equal values ofthe ratio are drawn through the data. Briefly,these data show that for unsewered areas thedifferences between 0 and 100 percent impervious will increase peak discharg·c on the average2.5 times. For areas that are 100 percentsewered, peak discharge for 0 percent impervious will be about 1.7 times the meanannual flood and the ratio increases to abouteight for 100 percent impervious areas. Figure2, then, reduces the basic data to the same unitsapplicable to a 1-sq-mi drainage basin and tothe mean annual flood.R n. lmwhere R is the recurrence interval in years, nis number of years of record, and n, is the rankof the individual event in the array.A basin produces big flows from large andintense storms and smaller flows from less intense but more frequent storms. The great orc:zI0uIILLIV')0::::LLI ILLILLIIu.uccIIII5000I:::::;)u:zI0LLI .!)0:::: C:I:u/V')c0 -D-'00.10.20.30.5//Ind2351020RECURRENCE INTERVAL, IN YEARSFigure 3.-Flood-frequency curve for partial-duration series, West Branch Brandywine Creek at Coatesville, Pa.,based on data for 1942, 1944-51.6
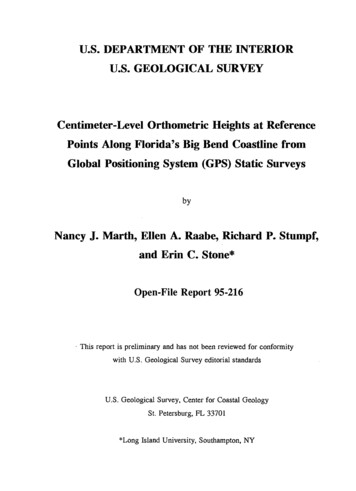
1 sq mi. The average annual flood is read fromthe upper graph of figure 4 as 75 cfs, and thelower graph is used to construct the fr quencycurve in figure 5 pertaining to a 1-sq-rr i basinmarked "unurbanized."Note in figure 3 that the largest flow in the9-year record was nearly 10,000 cfs. The number 50 printed on the graph means that therewere 50 flows equal to or exceeding 500 cfs.Once a year, on the average, a discharge valueof about 900 cfs will be equalled or exceeded.The arithmetic for the construction of thecurve is as follows :A slightly different result would be obtainedif, instead of using the peak flow for eachstorm, only the largest flow in each year wereincluded in the array. The principle involvedis similar. The arithmetic mean of the peakflows for the nine annual events is the "averageannual flood." The statistics of this array aresuch that the recurrence interval of this averageannual flood is the same regardless of the lengthof record, which specifically is 2.3 years. Thatis to say, a flood of that magnitude can be expected to be equaled or exceeded on an averageof once in 2.3 years, or 10 times in 23 years.Recurrenceinterval ofannual flood 1(years)Ratio tomean annualflood 1.11.52.02.35101 ecurrenceinterval durationseries 4(years)0.4.921.451.784.59.5Only the highest flood each year.From figure 4B.a Obtained by multiplying ratios by 75 cfs from figux·e 4A for adrainage area of 1 sq mi.4 All peaks during the year.The values in this columt' are mathematically related to those in the first.Studies of river channels have shown thatrivers construct and maintain channels whichwill carry without overflow a discharge somewhat smaller than the average annual flood. Infact the recurrence interval of the bankfullstage in most rivers is a flow having a recurrence interval of about 1.5 to 2 years.The graph marked "unurbanized" in figure5 is constructed on semilogarithmic paper fromthe data listed in the third and fourth columnsof the preceding table. The ordinate if the discharge, and the lower abscissa is the re. urrenceinterval in the duration series. An auxiliaryscale gives the average number of ftc ods in a10-year period (calculated as 10 yearf1 dividedby the recurrence interval). Thus, the flowexpected to occur once in 10 years ,.,ould beabout 145 cfs and the fifth largest would be 75cfs. The latter would also be the average valueof the largest flows each year during the 10year record and thus would be the "averageannual flood." It would plot, therefore, at anabscissa position approximately at 2. -year recurrence interval.Urbanization tends to increase the flood potential from a given basin. The channel thenwill receive flows which exceed its capacity notjust once in 1.5 to 2 years on the average butmore often. It is now proposed to estimate howmuch more often and to indicate the effect ofthis increased frequency on the channel itself.EFFECT OF URBANIZATION ON INCREASINGFREQUENCY OF OVERBANK FLOWTaking the East Branch of BrandywineCreek as an example, the flow-frequency curvecan be constructed for a typical subbasin having a 1-sq-mi drainage area. Figure 4A showsthe relation of average annual flood to drainagearea, and figure 4B shows the flood-frequencycurve for annual peaks for basins in theBrandywine area. The diagrams shown in figure 4 are similar to those published in thenationwide series of flood reports, U.S. Geological Survey Water-Supply Papers 1671-1689.The effect of urbanization on the averageannual flood is shown in figure 2, whh h showsthe increase in average annual flood for different degrees of urbanization as measur d by theincrease in percentages of impervious area andarea served by storm sewers. For conveniencethese are tabulated as follows:Percentageof areaaewered020405080100From these curves a discharge-frequency relationship is developed for a drainage area of7Percentageof areaimperviousRatio toaveragea"''nual flood0204050606011.52.32.74.24.4
0z0wuV')50000:::wQ.1-ww&.&.ual:::)u1000z000 ,500&.&., :::)zz wC) a::100w 50515010100500DRAINAGE AREA, IN SQUARE MILES2.5000 ,&.&., :::)zz 2.01.5wC) 0:::w 1.001-01- 0:::0.51.11.21.52 2.3356102030RECURRENCE INTERVAL, IN YEARSFigure 4.-Regional fl.ood-frequency data for the Brandywine Creek basin, Pennsylvania. A, R lationof average annual fl.ood to drainage area. B, Flood-frequency curve for annual peaks.8
AVERAGE NUMBER OF FLOWS IN A 10-YEAR PERIOD201052250Q:z0uLLJV)o:: :200LLJa.tLLJLLJu.uII:D150::Ju:z.0·t.e' ''LLJ(.!)o:: : (100 '(-v;,?J.X: '(\uV)Q500 ---------- -------- ---------L -------- ------ 0.20.51.02 2.3RECURRENCE INTERVAL, IN YEARS5Figure 5.-Flood-frequency curves for a 1-square-mile basin in various states of urbanization.figures 2 and 4.)910(De1.,;ved from
The average annual flood of 75 cfs was thenmultiplied by these ratios and plotted as shownin figure 5 at the 2.3-year interval. Thesevalues form the basis of a series of frequencycurves for combinations of sewered area andimpervious area. The shapes of the curves areguided by the principle that the most infrequentfloods occur under conditions that are not appreciably affected by imperviousness of thebasin.The most frequent flows are therefore increased by smaller ratios than would be theaverage annual flood. Also, the most frequentflows are decreased in number because lowflows from an urbanized area are not sustainedby ground water as in a natural basin. Thecurves representing urbanized cond tions therefore converge at low flow values.Obviously the frequency curves in figure 5are extrapolations based on minilr.al data andrequire corroboration or revision z additionalfield data become available.The flood-frequency curve under original( unurbanized) condition passes thr.,ugh a valueof 67 cfs at a recurrence interval of 1.5 years.At bankfull condition natural channels generally can carry the flow having that recurrenceinterval. If one assumes that this f·' w approximates the capacity of the natural rltannels, theintersection of the estimated curvE'q for different degrees of urbanization with t e dischargevalue of 67 cfs can be used to esti te the in-V")3: 60 .u. z Caloc:::LI.J4 0u.00t- Coc:::2Percentage sewered 20405080100Percentage impervious 2 0INONE40506060IMEASURE OF URBANIZATIONCOMPLETEFigure 6.-Increase in number of flows per year equal to or exceeding original channel capacit- (1-squaremile drainage area), as ratio to number of overbank flows before urbanization, for di1fereJJt degrees ofurbanization. (Derived from figure 5.)10
crease in number of flows equal to or exceedingnatural channel capacity. An auxiliary scale isshown at the top of figure 5 to facilitate this.For example, under natural conditions it isexpected that a 10-year record would showabout seven flows equal to or exceeding 67 cfs,or channel capacity. But if the average annualflood were increased 1.5 times (from 75 to 112cfs) corresponding to 20 percent sewered and20 percent impervious, the new frequency curveindicates that 14 flows of 67 cfs or greaterwould occur in a 10-year period, or a twofoldincrease in number of flows. Similarly, theratio of number of flows exceeding bankfullcapacity was read from the intersection of theother curves in figure 5 with the ordinate valueof 67 cfs to obtain the ratios plotted in figure 6.3. Check dams, ungated, built in hec1waterswales.4. Storage volumes in basements of largebuildings receiving water from P'lofs orgutters and emptying into naturalstreams or swales.5. Off channel storage volumes such as artificial ponds, fountains, or tanks.6. Small reservoirs in stream channels such asthose built for farm ponds.Various types of storage
their greatest influence in their erect on further development, especially through land values. Of particular concern to the planner are those alternatives that affect the hydrologic functioning of the basins. To be interpreted hydrologically, the details of the lan