Transcription
Assessing Your Data QualityAuditing your Google Analytics DataBrianClifton.com
ForewordThis document is chapter 4 from the book: “Assessing Your Data Quality”. Innon-technical terms it describes the entire manual process of building a dataquality audit of your Google Analytics setup.A little background In 2015 I published Successful Analytics: Gain Business Insights by ManagingGoogle Analytics. It was my fourth book about Google Analytics and dataquality. A major part of the work was to describe my audit method – that is,how to quantify your data quality and simplify its visualisation. The methoduses a weighted scorecard approach for the visualisation, and builds acompound metric, the Quality Index, as a measure of how close a setup is to abest practice implementation.As I hope you will discover, measuring your data quality is a game changer you will realise just what you can do (and more likely cannot do) with yourcurrent data. That said, manual audits are a laborious process. Wouldn’t it be alot more fun easier to automate it with some smart technology? And that ishow the idea of Verified Data was born.Thank you for downloading this document. If you found it useful please shareit with others and connect with me on LinkedIn.Brian CliftonBrianClifton.com
4Assessing Your Data Quality85
86 Assessing Your Data Quality Chapter 4A major hurdle that prevents analytics data being taken seriously withinan organization—by that I am referring to using web data to drive strategic thinking—is the perception that you are looking at noisy, irrelevant, orinaccurate data. A default Google Analytics installation answers only basicquestions about your website. That’s because without a best-practicesetup, all Google Analytics can tell you is the basics: How many visitorscame to our site? What pages did they look at? How long did they stay?Answers to those fundamental questions—and there are many ofthem—can be incredibly powerful. They allow you to understand howyour website performs through the eyes of your visitors. However, froma business point of view, non–data experts in your organization are leftwith the feeling of “So what?”: So what if visitors stay on our websitefor 3 minutes and this has increased by 10% over the past 12 months?What does this mean to the business and what should I do with thisinformation?To the business, such basic metrics are irrelevant. To get past this stageyou need to drill down into your data and answer the business questionsyour stakeholders are asking. Drilling down into your data means definingever-smaller segment sizes. As you do this, the error bars inherent withweb analytics get larger (irrespective of the tool used). Without a solidconfidence in your data, you can just end up looking at noise or, worse still,similar data points from different reports providing a conflicting story. Theanalytics project will stagnate.To minimize the noise and inaccuracy and maintain relevancy, you needto keep on top of your data quality. The process to do this is a health checkaudit of your data quality. In this chapter I show you how to perform suchan audit—without the need to look at code.DATA QUALITY HEALTH CHECKTo assess your Google Analytics data quality, create a health check auditreport. Use this report to examine and summarize aspects of your setup,weight them according to importance, and provide a single numeric representation of the quality of your data—your Google Analytics qualityscore (QS ).The health check audit report provides a succinct summary that captures the information most relevant to the analytics team. It articulateswhat is working correctly, what is missing from your current data setup,and where the problem areas are; and it lets you focus on which areas
Data Quality Health Check 87Error Bars and How to Minimize ThemAs with all data sets, web analytics has its error bars. Setup errors—for example, incorrect filter logic applied, or typos in thetracking code. You minimize these with regular health check audits, asdiscussed in this chapter. Incorrect deployment, such as the tracking code missing from certainpages. No tracking code deployed results in no data being collected.You minimize this with regular site scans to determine your trackingcode coverage, as discussed in this chapter. Visitors using multiple devices, such as desktop, laptop, tablet, andmobile phone. Unless your visitors routinely authenticate—log in toyour website—no analytics tool can associate the same visitor acrossmultiple devices. The only way to minimize this is to provide realvalue for visitors to log in—for example, applying a discount code onyour pricing, providing an exclusive members-only area, or providingaccess to an account representative or a dedicated support area. Deletion of cookies. Visitors always have the right to block or deletethe Google Analytics tracking cookies. If so, either data will not becollected (visitor blocked your cookie), or your visitor count is overinflated (visitor deleted your cookie).Until the Edward Snowden affair, the deletion of cookies by users wasconsidered relatively low—around 14% per month1 —and consistent.However, this may now change. You can minimize the problem by having a clear, easy-to-read, and accessible privacy policy on your website.This is not a trivial matter—most are overly long and full of legal jargonthere to protect the business rather than the visitor. Getting this right isa key aspect of building trust in your brand. See Chapter 7. Visitors who research online but prefer to purchase at a physical store.This has traditionally been a problem for web analytics tools, as themost important part of the digital trail is lost when the visitor goesoffline. However, with Google Analytics’ new protocol (Universal Analytics), this can be overcome. See Chapter 6. Differing processing time frames. A classic example is when paymentdetails received late on a Friday night are processed by your transaction system on a Monday morning. However, Google Analytics willshow this as revenue collected at the time of purchase (late on Fridaynight). There is not a lot that can be done to minimize this other than toallow for it when trying to reconcile numbers.
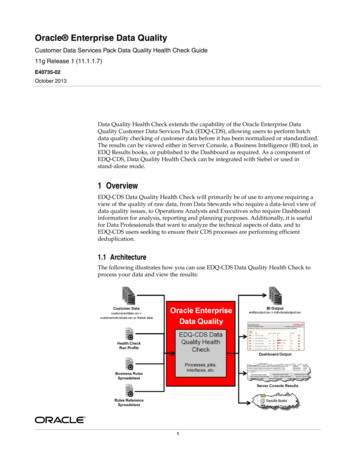
88 Assessing Your Data Quality Chapter 4to prioritize to meet the organization’s data requirements. Figure 4.1 is anexample of a first-page summary of the audit report. It’s aimed at seniormanagers in order to get an at-a-glance understanding of the current dataquality status.In Figure 4.1, first focus on the overall QS —the number in the last row.In this example the QS 13.8. This ranges on a scale from 0 to 100,where 100 represents a best-practice setup for your organization. Thedata quality in the example is not credible for analysis.The first priority therefore is to achieve a critical value—a score abovewhich you can perform basic analysis in confidence, which means thatthe information obtained is based on solid and reliable data. The exactScorecard SummaryJanuary 2014: 112,000 visitors, 157,000 visitsTime on site 3:08; pages per visit 3.75; bounce rate 45%;AdWords spend not linked to Google AnalyticsOperational since March 2011WeightStatusWeightedScore1Account setup and governance1.052Tracking code deployment1.0103AdWords data import1.004Site search tracking1.005File download tracking1.006Outbound link tracking1.007Form completion tracking1.008Video trackingN/A9Error page tracking0.5010Transaction tracking2.0011Event tracking (non-pageviews)1.0012Goal setup1.0013Funnel setup1.0014Visitor labeling1.0015Campaign tracking–1.0Quality score (QS ) out of 100–513.8Figure 4.1 Sample health check audit summary. Ideally, your quality score would be 100,a 100% complete best-practice implementation of Google Analytics. While that should bethe long-term aim, obtain a score of at least 50 before you attempt any in-depth analysis ofyour data.
Data Quality Health Check 89Be Transparent with Your Quality ScoreAs your organization will be making key strategic decisions based onyour data, you will want to be able to provide your QS to back it up. YourQS is the key metric that shows how reliable your data is. You shouldmonitor it regularly—see the section “Monitoring Your Quality Score”later in this chapter.critical score varies by organization. However, to simplify the process Iuse the following general rule: Until you achieve a QS of 50, don’t try todo any analysis. A value below 50 leaves too many holes and caveats inthe data.When you can demonstrate a high score—for example, QS 80—youand your peers will have the confidence in the data that you need to basestrategic decisions on it.Once you understand your quality score, look at the overall scorecard summary. The table summarizes the 15 key items that make up abest-practice implementation by showing the weight (importance), itsstatus (red, yellow, green), and the weighted score for each (weight status). Clearly you want to have many greens in the Status column and beable to explain the yellow and red items in the report’s supporting pages.Table 4.1 shows the values associated with the status colors.The weight for each of the 15 items in Figure 4.1 is a relative measureof the importance of tracking that particular item, with 0 representing noimportance and 1.0 representing the highest importance. A weight of 2.0is reserved for transaction tracking, because of its special importance. Foreach non-green item in Figure 4.1, consider its weight. This is your prioritylist for work to be done to improve your QS.Page 1 of the audit report (the scorecard summary) is the most important part of the report—as a manager, your focus is on this page. TheTable 4.1 Scorecard Status ValuesStatus ColorExplanationStatusValueGreenWorking as expected. No action required.YellowPartially working, or not working in an optimalway. Action required.105RedNot working or not implemented. Actionrequired.1
90 Assessing Your Data Quality Chapter 4Balanced Scorecard ApproachYou may be familiar with the balanced scorecard (BSC) approach—astrategy performance management technique developed in the 1990sand used by managers to keep track of activities within their control.2The health check audit report is based on the BSC technique.remaining pages of the report explain why items receive a yellow or redstatus value.You can download the full example audit report fromhttp://brianclifton.com/example-audit.BUILDING YOUR HEALTH CHECK SCORECARDThe health check audit report is built by the analytics team and is typicallyfour to five pages long (including the summary page shown in Figure 4.1).Most, but not all, of the table items will be applicable to you. Mark othersas “not applicable” rather than removing them from the table. For example, video tracking (row 8 in Figure 4.1) is not applicable to this fictitiousclient website. I explicitly state this in order to indicate that video trackinghas been investigated and considered not applicable. If that item weremissing, it would raise the question, “Have we considered everything?”For large sites with thousands of pages, the precise content and featurescan easily be forgotten. Therefore, it is good practice to make a formalassessment.Following the scorecard summary page, the supporting pages expandon why each item received the score it has in bullet point form. For itemsthat receive a green status, no further detail is required. Therefore, thereport focuses on the yellow and red tracking items. The information presented should be concise and succinct—that is, in note form. The intention is to help point the person responsible for the specific tracking itemin the right direction. Each item should be no more detailed than the following example:Item 5: File download tracking A google.com search reveals we have 5,000 PDF files located in thesearch engine’s index (they can be found by Google). However, no file download tracking is in place.
Building Your Health Check Scorecard 91An alternative could be the following: A google.com search reveals we have 5,000 PDF files, 200 ZIP filesand 100 XLS documents located in the search engine’s index (theycan be found by Google). However, only PDF files are currently tracked, and a meaningful filename is not reported.In both examples, the justification for tracking is stated followed by thecurrent tracking situation.Weighting Your ScoresAs described in Chapter 3, the weighting of items to track is a balance oftwo considerations: Is the activity an important part of the visitor’s journey? How important is the activity to the business?The weighting is relative, on a scale from 0 to 1.0, with 1.0 indicatingthe most important level. There is one exception to this rule—if you havean e-commerce website, weight transaction tracking is 2.0. That is, if youare collecting revenue directly on your website, it is super important to getthis tracked correctly in Google Analytics.For the range of weights, I use five possible values: 0.0, 0.25, 0.5, 0.75,1.0 (and 2.0 for transactions only):0.0Not required. This could be, for example, clicking on images within a carousel.(Why websites bother with carousel images is a mystery to me. The userexperience is very poor.)0.25Nice-to-know metrics, but the business is not asking for these at present.Examples include clicks on certain links, such as outbound links, or widgetusage.0.5Somewhat important to know, but not a business priority at present. Forexample, error messages. These are important if you are launching a newwebsite or rolling out a redesign. But for day-to-day operations, errors aredealt with by the web development team and are usually logged separately toGoogle Analytics.0.75Important metrics though not top priority. For example, these could be socialsharing of content while the business is still figuring out its social strategy.1.0A key part of the visitor’s journey and an important engagement for the business. For example, any action that results in a visitor providing their personalinformation to you, such as a lead generation form submission.2.0Vital metrics. Generally used for transaction tracking only.
92 Assessing Your Data Quality Chapter 4The analytics team is responsible for producing the scorecard report.My approach is for the team to make the initial assessment of the weightsfor each tracking item. They answer the first question: Is the activity animportant part of the visitor’s journey? This sets the stage for the rest ofthe organization to understand what your website visitors experience.The document then becomes the basis for further discussions with yourstakeholders—the rest of the business that has invested in the analyticsproject. The follow-up discussion assesses the second question: Howimportant is the activity to the business? The purpose is to fine-tune andfinalize the importance of each weighting. This is a straightforward process and should be accomplished within one or two meetings.Calculating Your Quality ScoreThe weighted score is the last table column of Figure 4.1. The calculation isthe weight of the item multiplied by its status value (taken from Table 4.1):weighted score weight status valueA few examples using Figure 4.1, illustrate how straightforward this is:Item 1, Account setup and governance: The weighted score is1.0 5 5.Item 2, Tracking code deployment: The weighted score is 1.0 10 10.Item 3, AdWords data import: The weighted score is 1.0 0 0.Your QS is calculated as the sum of your weighted scores divided by thetotal of the weights representing a perfect score:QS sum of weighted scoressum of weights status value for greenAgain, this is straightforward. The sum of weights status value forgreen is the sum of weights multiplied by 10. Using the example in Figure 4.1, this is 14.5 10 145.0. Therefore, QS 20 / 145 13.8.SCORECARD ITEMS—WHAT TO ASSESSFor each row of Figure 4.1, what needs to be checked, why, and how?Most of this process concerns asking questions about what data ispresent in your reports, or what settings are configured in your GoogleAnalytics account.
Scorecard Items—What to Assess 93There is no specific order for the items to assess, and this is deliberate. Starting with having a Google Analytics account and deploying thetracking code across your pages (items 1 and 2) makes sense. However,the remaining items are not ranked by importance. This is because whenviewing data and tracking code, it is easy for even expert eyes to glazeover. What determines if the tracking works correctly or not can be subtle. The random ordering of items in the scorecard forces the assessorto crosscheck reference points and is therefore a self-check for suchsubtleties.For this reason, I recommend that only one person be responsiblefor the status assessment. They should be comfortable with HTML,JavaScript, and the architecture of your websites. This person should beon the analytics team, not someone from IT.Aren’t These Tracked by Default?Regardless of how a visitor arrives at your website, as long as you havedeployed your tracking code, Google Analytics will track by default the visit,the visitor (the same visitor may make several visits), and the pages viewedby your visitors. That is a simple yet powerful data set that allows morethan 100 visually rich reports to be automatically built for you. These show The time and date visitors arrive, and from which countries andcities— accurate to approximately a 25-mile (40 km) radius. The number of times they have come: are they a first-time visitor ora repeat visitor, and if so, how many times did they come before? What drove them to visit you: which search engine did they use,which social website or other website was involved in bringing youyour visitors? The content visitors view: which pages are popular, how much timeis spent on each page and on your entire website?However, counting how many visits, where the vistors came from, andwhat pages they looked at is still a small piece of the data pie. It tells youalmost nothing about engagement—whether your visitors achieve anything worthwhile to them, or how close they get to becoming a customeror repeat customer. It tells you nothing about your visitor value—that is,are you receiving high-value visitors or low-value ones? And it tells younothing about which pages are important to your visitors—the pages thatare most influential or persuasive—versus pages that just waste yourvisitors’ time.
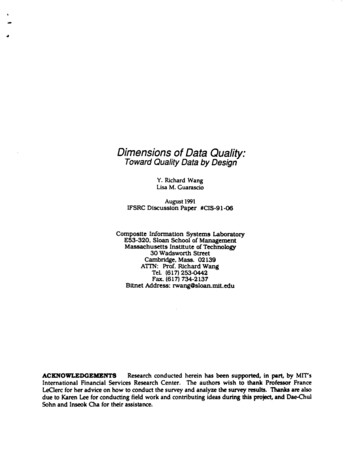
94 Assessing Your Data Quality Chapter 4Check in Real TimeThe real-time reports of Google Analytics are a subset of reports thatshow you what’s happening on your site—as it happens. Visit data isprocessed within a few seconds of the visitor’s arriving on your site. Hereis an example.Search boxA real-time report showing an up-to-the-second view of where visitors are coming fromI use real-time reports to test what data is being reported on. The technique is to show real-time data for only your own visit—that, is while youare auditing your website. In this way you can see what data is being sentto Google Analytics (if any) that corresponds to your action.Open two browser windows—one for your Google Analytics real-timereporting, one for your website. To isolate yourself from all other visitor traffic, visit your website with the addition of two extra campaigntracking parameters in the URL. For example, www.example.com?utmsource test&utm medium test will be displayed in your real-time reports,as shown in table row 7 above. If you do not see the test row in your table,use the search box. By clicking on test in the Medium column (row 7), youcan automatically segment your data in Google Analytics. That is, youisolate just that visitor traffic. As this URL is unique to you, it correspondsto your actions.Now you can navigate the real-time reports and only view your owndata. In your other browser window, click around your website viewingdifferent pages. Assuming you have the basic Google Analytics trackingcode in place, you will see the page URLs you have clicked on appear inthe real-time content report.Determining whether an action is tracked at all and how is the basis formany of my tracking tests within the scorecard.
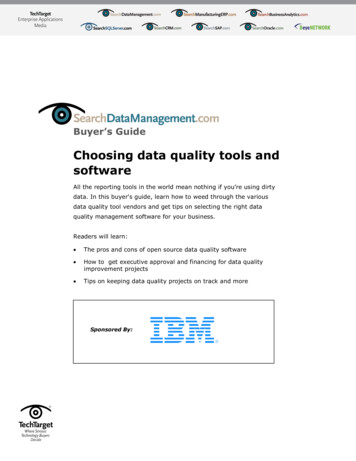
Scorecard Items—What to Assess 95Items 3 through 15 of the scorecard cover the collection of data pointsrequired to get a more informative picture of your visitors’ experiences.1. Account SetupThe first row of the scorecard summary table, Google Analytics AccountSetup, concerns your Google Analytics account governance and includesthe following three areas:Account StructureGoogle Analytics is not a relational database. You cannot simply throwdata into a big pot and then figure out the data relationships later. How youcollect your data determines its structure. You can manipulate your datastructure within your account setup using filters.What to assess: Are you excluding visits from your own staff? These visits couldrepresent a significant proportion of your total traffic, and they arenot from your target audience. If tracking your own staff visits isimportant, create a separate report set for them. Are you excluding visits from your third-party agencies? Is there a backup report set to protect you if something should gowrong with your data? Is there a testing report set allowing you to experiment with changesbefore applying them to the main data set? Are any content filters applied and, if so, are they valid and working? Is the number of report sets (referred to as views in Google Analytics)reasonable and manageable for your organization? What other filters are present that are manipulating the data?Where to check: In order to make your assessment, you need adminaccess to your Google Analytics account. Within the Administration area(Figure 4.2a), check what views are available and what filters (Figure 4.2b)are being applied to your data.People and AccessWho has access to your data? This includes people both in your organization and in external third parties (agencies, consultancies, developers,partners, resellers, affiliates, and so forth). Similarly, who has the rightto change the setup? As is the case with your bank account, your data isconfidential and should only be viewable by authorized people.
96 Assessing Your Data Quality Chapter 4abFigure 4.2 The Google Analytics Administration area for a report set: (a) assessing differentreport sets (views); (b) assessing applied filtersWhat to assess: How many people have access to your data? What level of access do people have? View-only access, or fulladmin rights to change anything? How many admin users are there? This should be limited to a verysmall subset of users who have experience with Google Analyticsadministration and take full responsibility for their actions. The totalnumber of account administrators should be as small as possible,and the requirement of being an administrator should be justified foreach individual. As a rule of thumb, I red-flag any account with morethan ten administrators.Where to check: To make your assessment, you need admin accessto your Google Analytics account. Within the Administration area shownin Figure 4.2, select the User Management menu item and review thepeople listed and their associated permission levels.Content and InformationDocumenting your setup (building a health check audit report is partof this), and understanding what type of data is being collected, is animportant part of good governance. For example, Google Analyticshas some restrictions on the type of data and volume of data you can
Scorecard Items—What to Assess 97send it. These are covered in its terms of service (US version here:www.google.com/analytics/terms/us.html 3 ).What to assess: What is the volume of data being sent to Google Analytics? Thisincludes all pageview, event, and transaction data. The free versionof Google Analytics is limited to 10 million data hits per month. ForPremium users, the standard limit is 1 billion data hits per month. Is personally identifiable information (PII) being collected? This is ared flag. No PII can be reported in Google Analytics. If it is, you riskyour account being closed down. (Note: I am specifically referring tothe collection of PII by Google Analytics. Collecting visitor PII in yourcontact database is fine, so long as this is done with the consent ofyour visitors.) Is there any documentation explaining the data collection methodologies employed? That is, has a scorecard audit been delivered previously, and does an implementation guidelines document exist (seeChapter 3)? Is there a suitable privacy statement on your website explaining howyour organization collects and processes visitor data?Where to check: To assess your total data volume, access your reportsand enter the Behavior section (Figure 4.3). The overview report (a) listsyour pageview volume for the past 30 days—the default date window.Add this number to the total number of events tracked, obtained from theEvents Overview report (b). This number should be less than 10 millionacbFigure 4.3 The Google Behavior report area: (a) pageviews; (b) events; (c) page content
98 Assessing Your Data Quality Chapter 4for a 30-day period in order to stay within the free Google Analytics termsof service. If not, consider the options discussed in Chapter 2 for thisscenario.PII can end up in your Google Analytics reports a number of differentways—for example, via transaction tracking, custom dimensions (knownin older versions of Google Analytics as custom variables), event tracking,and pageview tracking. Any method of collecting PII breaks the GoogleAnalytics terms of service. If someone has consciously made the decisionto track PII in your Google Analytics account, then your situation is prettydire. You must close the offending web property and all report sets for it,delete it (losing all previous data), and start again without collecting PII.Even without making a conscious decision to track PII, it is possible toinadvertently collect it using Google Analytics—see the sidebar “How PIIGets into URLs.” To assess this, review your Site ContentAll Pagesreport (Figure 4.3c). This report contains a list of all page URLs viewed byyour visitors. Conduct a table search for any possible PII collected in thevisited URLs. Typically this is for potential field names such as “name,”“email,” or “address.” Searching for the email @ symbol is also a good wayto bubble up any potential email addresses captured.If PII is present in your reports, you must close the offending web property, delete it, and start again without collecting PII.How PII Gets into URLsIf you collect personal information via a web form, ensure your developers use the POST method for form submission. This ensures theinformation contained in the form is not visible in your page URLs (forbest-practice privacy reasons, you should also send the informationencrypted via https).If form submission data is not transmitted via the POST method, anyform field information is appended to the page URL as a query parameter.The page URL is what Google Analytics tracks by default. Hence if PII ispresent in your URLs, this will appear in your Google Analytics reports.An example URL could be/form/subscribed.php?name Brian%20Clifton&email brian@brianclifton.comApart from bad practice, losing the trust of your visitors, and breakingthe Google Analytics terms of service, passing around personal information on the Internet in clear text form is likely to get you into trouble withthe data protection authorities of the countries you operate in.See Chapter 7 for a detailed discussion about PII and privacy.
Scorecard Items—What to Assess 992. Tracking Code DeploymentThe Google Analytics tracking code (GATC) is the JavaScript snippet ofcode (typically a dozen or so lines) that you paste into the header area ofall your pages. Without this tracking code present, no data collection cantake place. In addition, a patchy deployment of the GATC—that is, somepages tracked, some not—leads to unexpected results, often the doublecounting of visitors.What to assess: Is the tracking code working—that is, collecting data? Is cross-domain tracking required and implemented? This is whena visitor traverses more than one website that you own. This canbe a subdomain (www.example.com blog.example.com) or a fulldomain change (www.product-site.com www.support-site.com). What version of the tracking code is running? Since the launch ofGoogle Analytics, there have been three versions of the trackingcode. The latest, launched in late 2013, is named analytics.js. It iscommonly referred to as Universal Analytics. How is the tracking code placed on your pages—using code snippets or via a TMS? If a TMS, which vendor and who is responsiblefor it? What proportion of your website pages can be tracked? Your targetis 100%. That is, at the very least your GATC should be deployed onall of your public-facing website pages. After all, if your organizationhas gone to the trouble to produce content, you should be trackingit. Otherwise, consider culling the page.Where to check: Checking the GATC is the most technical part of thehealth check audit. To perform the check, you could manually review yourweb page HTML source code on a sample of pages. However, that is alaborious task and is prone to human error. Instead, there are a number oftools that can simplify the task and that offer ways to automatically detecterrors and issues for you.Google Analytics Debugger—official Google Chrome extension Loads the debug version of the GATC for all websites you browse.It prints useful information to the developer console that can tell you whenyour analytics tracking code is set up incorrectly. It provides a detailedbreakdown of each tracking beacon sent to Google Analytics. Free to use.(I use this oogle-analytics-debugger
100 Assessing Your Data Quality Chapter 4Google Tag
how to quantify your data quality and simplify its visualisation. The method uses a weighted scorecard approach for the visualisation, and builds a compound metric, the Quality Index, as a measure of how close a setup is to a best practice implementation. As I hope you will discover, measuring your data quality is a game changer -