Transcription
GeoVision Analysis SupportingTask Force Report: BarriersAn Analysis of Non-Technical Barriers toGeothermal Deployment and PotentialImprovement ScenariosKatherine Young, Aaron Levine, Jeff Cook,Donna Heimiller, and Jonathan HoNational Renewable Energy LaboratoryNREL is a national laboratory of the U.S. Department of EnergyOffice of Energy Efficiency & Renewable EnergyOperated by the Alliance for Sustainable Energy, LLCThis report is available at no cost from the National Renewable EnergyLaboratory (NREL) at www.nrel.gov/publications.Contract No. DE-AC36-08GO28308Technical ReportNREL/TP-6A20-71641May 2019
GeoVision Analysis SupportingTask Force Report: BarriersAn Analysis of Non-Technical Barriers toGeothermal Deployment and PotentialImprovement ScenariosKatherine Young, Aaron Levine, Jeff Cook,Donna Heimiller, and Jonathan HoNational Renewable Energy LaboratorySuggested CitationYoung, K.; Levine, A.; Cook, J.; Heimiller, D.; Ho, J. (2019). GeoVision AnalysisSupporting Task Force Report: Barriers—An Analysis of Non-Technical Barriersto Geothermal Deployment and Potential Improvement Scenarios. Golden, CO:National Renewable Energy Laboratory. sti/71641.pdf.NREL is a national laboratory of the U.S. Department of EnergyOffice of Energy Efficiency & Renewable EnergyOperated by the Alliance for Sustainable Energy, LLCTechnical ReportNREL/TP-6A20-71641May 2019This report is available at no cost from the National Renewable EnergyLaboratory (NREL) at www.nrel.gov/publications.National Renewable Energy Laboratory15013 Denver West ParkwayGolden, CO 80401303-275-3000 www.nrel.govContract No. DE-AC36-08GO28308
NOTICEThis work was authored by the National Renewable Energy Laboratory, operated by Alliance for SustainableEnergy, LLC, for the U.S. Department of Energy (DOE) under Contract No. DE-AC36-08GO28308. Fundingprovided by the U.S. Department of Energy Office of Energy Efficiency and Renewable Energy GeothermalTechnologies Office. The views expressed herein do not necessarily represent the views of the DOE or the U.S.Government. The U.S. Government retains and the publisher, by accepting the article for publication, acknowledgesthat the U.S. Government retains a nonexclusive, paid-up, irrevocable, worldwide license to publish or reproducethe published form of this work, or allow others to do so, for U.S. Government purposes.This report is available at no cost from the National RenewableEnergy Laboratory (NREL) at www.nrel.gov/publications.U.S. Department of Energy (DOE) reports produced after 1991and a growing number of pre-1991 documents are availablefree via www.OSTI.gov.Cover Photos by Dennis Schroeder: (clockwise, left to right) NREL 51934, NREL 45897, NREL 42160, NREL 45891, NREL 48097,NREL 46526.NREL prints on paper that contains recycled content.
GeoVision Barriers Analysis SummaryHomeForwardThis report describes research and analysis performed in support of the U.S. Department of Energy Geothermal TechnologiesOffice for its Geothermal Vision Study. A summary of the study is captured in DOE’s report, GeoVision: Harnessing the HeatBeneath Our Feet (DOE 2018) and included ground-breaking, detailed research on geothermal technologies. The study projectsand quantifies the future electric and nonelectric deployment potentials of these geothermal technologies within a range ofscenarios in addition to their impacts on U.S. jobs, the economy, and environment. Coordinated by the U.S. Department of EnergyGeothermal Technologies Office, the Geothermal Vision Study development relied on collecting, modeling, and analyzing robustdata sets through seven national laboratory partners that were organized into eight technical task force groups. These task forcesand their respective principal leading national laboratory are listed in Table F-1. The table also provides a guide to the finalresearch documents produced by each GeoVision task force. In most cases, these were prepared as laboratory reports, and theyare referenced accordingly. Consult these external reports for detailed discussions of the topics contained within, which form thebasis of the GeoVision analysis.Table F-1. Guide to Technical Research Documents Providing the Basis of the GeoVision AnalysisGeoVision Task ForceLead National LaboratoryReport Number/CitationExploration and ConfirmationLawrence Berkeley NationalLaboratoryLBNL-2001120(Doughty et al. 2018)Potential to PenetrationNational Renewable EnergyLaboratoryNREL/TP-6A20-71833(Augustine et al. 2018)Thermal Applications: Direct UseNational Renewable EnergyLaboratoryNREL/TP-6A20-71715(McCabe et al. 2018)Thermal Applications: Geothermal Heat PumpsOak Ridge NationalLaboratoryORNL/TM-2017/502(Liu et al. 2018)Reservoir Maintenance and DevelopmentSandia National LaboratoriesSAND2017-9977(Lowry et al. 2017a)Hybrid SystemsIdaho National LaboratoryINL/EXT-17-42891(Wendt et al. 2018)Institutional Market Barriers (this report)National Renewable EnergyLaboratoryNREL/PR-6A20-71641(Young et al. 2018)Social and Environmental ImpactsLawrence Berkeley NationalLaboratoryNREL/TP-6A20-71933(Millstein et al. 2018)3
GeoVision Barriers Analysis SummaryHomeAcknowledgmentsACKNOWLEDGMENTSThe authors wish to thank Donna Heimiller for developing all of the GIS work andmaps used in this analysis, Chad Augustine for developing the multiple supply curves,and Jonathan Ho for running the ReEDS analyses. We would also like to thank the BETmembers, including Charlene Wardlow (Ormat), David Batts (EMPSi), Dwight Carey(EMA), Laurie Hietter (Panorama Environmental), Paula Blaydes (Blaydes andAssociates), Pierre Audinet (World Bank), Ben Matek and Karl Gawell (GEA), CaseyStrickland (U.S. DOE), Lorenzo Trimble (BLM), Jeff Jones (USFS), and all others whoprovided comment and input during the development of this analysis, including ColinWilliams (USGS), Andy Sabin (Navy GPO), Randy Peterson and Josh Nordquist (Ormat),Scott Nichols (U.S. Geothermal), Daniel Fleishmann (ENEL Green Power), Andy VanHorn (Van Horn Consulting), and the DOE Geothermal staff and GeoVisionary Team fortheir feedback and guidance throughout the process. We also thank the NRELcommunications and review team, including Rob Leland, Dan Bilello, Jaquelin Cochran,Jeffrey Logan, Eric Lantz, and Linh Truong.4
GeoVision Barriers Analysis CSPCXdGeoDoDDOIEAEGSEIAEPActESAEXDRAnnual Technology Baselinebusiness-as-usualbarriers expert teamU.S. Bureau of Land ManagementBarrier Technology ImprovementCalifornia Environmental Quality ActCalifornia Public Utilities Commissionconcentrating solar powercategorical exclusionDistributed Geothermal Market DemandModelU.S. Department of DefenseU.S. Department of Interiorenvironmental assessmentenhanced geothermal systemU.S. Energy Information AdministrationEnergy Policy Act of 2005environmentally sensitive areaexploration/confirmation drillingFITsfeed-in-tariffsGEAGeothermal Energy AssociationGeoRePORT Geothermal Resource PortfolioOptimization and Reporting TechniqueGETEMGeothermal Electricity TechnologyEvaluation ModelGHMAgeneral habitat management areaGPONavy Geothermal Program OfficeGTODepartment of Energy’s GeothermalTechnologies OfficeGVS P2PElectric Sector Potential to PenetrationICOinstallation commanding officersIMLUCCInteragency Military Land UseCoordinating CommitteeIRTImproved Regulatory TimelineITCinvestment tax creditJEDIJobs and Economic Development ImpactLCOElevelized cost of energy5
GeoVision Barriers Analysis SummaryHomeAcronymsACRONYMS (cont.)LTPPMOUMWMWekWeMWhMMBTUNAWSNEPANF EGSNOINRELNVNMO&MPDEPEISPHMAPPAPPLong Term Procurement Planningmemorandum of understandingmegawattmegawatt electrickilowatt electricmegawatt hoursone million British Thermal UnitsNaval Air Weapons StationNational Environmental Policy Actnear-field enhanced geothermal systemNotice of IntentNational Renewable Energy LaboratoryNewberry Volcano National Monumentoperations and maintenancepre-drilling explorationProgrammatic Environmental ImpactStatementpriority habitat management areapower purchase agreementpower roduction tax creditphotovoltaicsrenewable energyRegional Energy Deployment SystemModelrenewable portfolio standardsSocio-Economic Assessment ToolState Historic Preservation OfficestimulationTechnical Assessment Tooltemperature gradient holeU.S. Geological Surveyvariable renewable energywell-field drilling6
GeoVision Barriers Analysis SummaryHomeKey Messages Flat line in geothermal deployment in recent years may be due to institutional/soft-cost (and not technicalcost) barriers. Overcoming these barriers could lead to increased deployment slopes. The geothermal resource supply curve is decreasing due to growing environmental and land-userestrictions. Technology improvements and mitigation techniques may be able to reduce the impact theserestrictions have on future geothermal development. Permitting and land access challenges can impact accessibility and development timeframes, severelyimpacting deployment potential. Modeling suggests these challenges reduce deployment by more than50% in the BAU case and by 15% in the Barrier Technology Improvement (BTI) case. Well-designed policies and incentives can drive deployment:oSet-asides – Historical set-asides have allowed for deployment of non-economically competitivetechnologies (e.g., solar); the model demonstrates similar impact if geothermal set-asides wereimplemented.oTax credits – Historical PTC has driven deployment of (cost-competitive) wind. Geothermal projecttimelines are too long to take advantage of this structure (as implemented). Historical oil and gastax credits are exploration related and help to lower upfront risk.oRD&D funding – Historical (worldwide) government research funding in solar has helped drivereduction of solar LCOE, raise social acceptance of solar, and encourage policy/incentivedevelopment for increased solar deployment. Historical high geothermal budgets (e.g., 1980s)drove similar increases in geothermal deployment.7
GeoVision Barriers Analysis SummaryHomeKey Messages (continued) Benefits of geothermal (e.g., economics, jobs, land use) relative to other technologiessuggest states and communities would benefit from increased geothermal deployment. Local and federal economic paybacks are high compared to other renewables, so states thatsupport development of geothermal will have greater economic benefit:o Local, full-time, living wage jobs Federal, state, and local annual royalties back intocommunities—if developed on state or federal lando High O&M spending into local communities Federal and state taxes, so geo generationproduces more tax income for states and federal government. Environmentally friendly – low greenhouse gas emissions, small footprint, low water use,etc. The geothermal industry could benefit from improved, targeted marketing and advocacy toimprove the community, market, and socio-political acceptance of geothermal development.8
GeoVision Barriers Analysis SummaryHomeContentsTo use the links in this slide deck, view in presentation mode1 Background2 Methodology3 Comparison Scenarios1.1 GeoVision Study1.2 Previous Barriers Analyses and Tools2.1 Barriers Analysis: GeoRePORT2.2 Market Deployment: GETEM and ReEDs2.3 Barriers Expert Team3.1 Business as Usual3.2 Disruptive Technology4 Individual Barriers Analyses4.1 Land Access4.2 Permitting4.3 Market4.4 Transmission4.1.1 Overview4.1.2 Sub-Attributes1. Cultural and Tribal2. Environ. Sensitive Areas3. Biological Resources4. Land Ownership5. Federal/State Leasing6. Military Installation4.1.3 Influence on Potential4.1.4 Improvement Scenarios1. Low (Forest Service Funding)2. Disruptive (Mitigation Design)4.2.1 Overview4.2.2 Sub-Attributes1. Regulatory Framework1a. Federal1b. State2. Environmental Review3. Ancillary Permits4.3.1 Overview4.3.2 Sub-Attributes1. Market Demand2. Price of Electricity3. Policies4. Incentives4.3.3 Influence on Potential4.3.4 Improvement Scenarios1. Renewables (State RPS)2. Baseload (policy, incentive)3. Geothermal (policy,incentive)4. Market Conditions (high NG)4.4.1 Overview4.4.2 Sub-Attributes1. Distance to Transmission2. Interconnection Costs3. Transmission Costs4.1.5 Market DeploymentModeling4.2.3 Influence on Potential4.2.4 Improvement Scenarios1.Low (Centralized Office)2.Disruptive (CX for Ex Drilling)4.2.5 Market DeploymentModeling4.4.3 Impact to Development5 Cumulative Barriers Analysis6 Additional Barriers7 Summary & Next Steps5.1 Combination Scenarios6.1 Social Acceptance6.2 Logistics6.3 Cost of Time7.1 Roadmap9
HomeGeoVision Barriers Analysis Summary1.1 DOE GeoVision StudyIn 2015, the DOE Geothermal Technologies Office (GTO) began a vision study (GeoVision) toconduct analysis of potential growth scenarios across multiple market sectors (e.g., geothermalelectric generation, commercial and residential thermal applications) for 2030 and 2050.The work was divided into task forces led by GTO team members. The research for one taskforce, institutional barriers, is being led by the National Renewable Energy Laboratory (NREL).The institutional barriers task force is charged with analyzing non-technical barriers that createdelays, increase risk, or increase the cost of project development. These non-technical barriersinclude land access, permitting, access to transmission, and market conditions that may createchallenges in developing a power purchase agreement (PPA).In 2016, we analyzed the barriers to deployment and the impact on available resources. Theseimpacts were modeled in the Regional Energy Deployment System (ReEDs) model toestimate future geothermal deployment under these business-as-usual (BAU) conditions.In 2017, we developed potential improvement scenarios and ran these scenarios in the ReEDsmodel to understand the potential impact these improvements could have on geothermaldeployment.This presentation includes the results of these analyses and lists potential activities forincreasing geothermal deployment in the United States.10
GeoVision Barriers Analysis SummaryHome1.2 Previous Barriers Analyses & ToolsNon-Technical Barriers ofGeothermal Projects Developed system that allows for evaluation and analysis of the economic, legal, and administrativeconditions in countries for implementation of geothermal energy projects. No details were provided describing the system or the analysis, but authors reported that it yielded nontechnical (and non-geological) barriers that substantially inhibit further development of the geothermalmarket and, correspondingly, the investment volume. Conclusion: Systematic analysis of non-technical conditions is important in identifying barriers that canhave a substantial impact on the economic success of a project.U.S. Department ofEnergy’s Regulatory andPermitting InformationDesktop (RAPID) Toolkit Web-based, interactive database with two main tools:o Regulatory and Permitting database describing the process for developing geothermal projects in theUnited States and in 12 western stateso National Environmental Policy Act of 1969 (NEPA) database that catalogued NEPA-related environmentalanalysis for geothermal projects.Geothermal Permittingand NEPA Timelines Analysis of timelines for specific types of environmental analysis for leasing and permitting under NEPA. Details total number of times a geothermal project may need to complete the NEPA review process duringproject development and how long those reviews may take for each type of permit. Identifies factors that increase NEPA review timelines and discusses proven and potential strategies forlowering the amount of time necessary to navigate the NEPA process.Doubling GeothermalGeneration Capacity by2020: A Strategic Analysis Reviews 6.4 GW of geothermal projects in development in the United States from 2012-2015 as reportedby the Geothermal Energy Association (GEA). Estimates foresee that these projects have the potential tomore than double the 3.8 GW of current geothermal capacity in the United States. Identifies which projects were likely to come online by 2020 (784 MW) and which had too many barriers tobe completed so quickly. Over half of the projects analyzed are in early stages of development and therefore still face barriers ofdevelopment risk and uncertainty outside specific barriers explored in analysis. Largest barriers identified include market barriers (PPA acquisition), permitting (including land access),transmission, and financing. Only 5.3% (177 MW) show the resource to be the main barrier slowing or preventing development.Imolauer and Ueltzen (2015)http://openei.org/wiki/RAPIDYoung et al. (2014)Wall and Young (2016)11
HomeGeoVision Barriers Analysis Summary2.1 GeoRePORT OverviewThe GeoRePORT System: Was developed to address the need of the GTO to track and measure the impact of research,development, and deployment funding for GTO-funded geothermal projects. Is particularly useful for describing early-stage exploration projects. Is unique in providing a detailed system forreporting both the resource grade and theproject readiness level. The analysisconducted for GeoVision discusses onlyresource grade and not project readinesslevels. Is comprised of three assessment tools:Geological, Technical, and Socio-Economic.The GeoVision analysis focuses on use of thesocio-economic grade assessment tool toanalyze institutional barriers. Each of the assessment tool’s resourcegrades are divided into attributes and subattributes that describe the characteristicsthat contribute to feasibility of projectdevelopment (see figure).12
GeoVision Barriers Analysis SummaryHome2.1 Using GeoRePORT for Barriers AnalysesBOX 1: Example SUB-ATTRIBUTESThe Land Access attribute has sixsub-attributes:1. Cultural and tribal resources2. Environmentally sensitive areas3. Biological resources4. Land ownership5. Federal and state lease queue6. Proximity to military installation The Socio-Economic Assessment Tool (SEAT) encompassesfour attributes: Land Access, Permitting, Transmission, andMarket. Each of these attributes include sub-attributes (see box 1). Each sub-attribute has definitions of grades (see box 2),which, when combined, provide a character grade for eachattribute. Each sub-attribute is given a weight, and the total attributeweighted sum is calculated.BOX 2: Example SUB-ATTRIBUTE GRADESA geothermal project may be reported with one of the following Biological Resources Sub-Attribute Grades:A. No biological resource issues present in the areaB. Manageable biological resource issues (nearby species of concern); developers may expect a 3-6 monthregulatory staff reviewC. Biological concerns, such as nearby migratory birds, bald/golden eagles, and or endangered or threatenedspecies, or if the resource is located in a Sage Grouse General Habitat Management Area (GHMA);developers may expect a 6-12 month regulatory staff review and resolutionD. Difficult biological issues, such as a Sage Grouse Priority Habitat Management Areas (PHMA); not likely toresolve, 1-2 years or longer if resolution possible.E. Project is located in a Sage Grouse PHMA Focal Area13
GeoVision Barriers Analysis SummaryHome2.1 Using GeoRePORT for Barriers AnalysesSTEP 1: Identify market barriers (subattributes) and weight them according toimpactSTEP 2: Develop grading system for the marketattribute and each sub-attributeSTEP 3: Collect and/or develop data to createmaps of each sub-attributeEXAMPLES: Figures 4-7EXAMPLE: Policy Sub-Attribute GradesGradesDescriptionAFeed-in tariff for geothermal (standard offercontracts)BCDESTEP 4: Combine all attributes into a singleattribute summary mapInterconnection set-aside or RPS or statepurchase requirement specific forgeothermalState renewable purchasing requirementsor RPS - not preferential to a particularrenewableState purchasing requirements or RPS - withpreferential consideration or set-asides fornon-geothermal renewablesNo policies beneficial to renewables (NoRPS)STEP 5: Identify thresholds (unallowed,significant barrier) for each sub-attributeSTEP 6: Estimate potential geothermaldeployment for various market scenariosEXAMPLE: Table 4EXAMPLE: Table 5RPSEXAMPLE: Figure ade(s)FlaggedGrade(s)MarketDemand----D, EPrice cenariosPotential improvement scenarioBAU Deployment based on currentmarket conditions (currentpolicies/incentives).SCENARIO 1:Renewables Increased State renewablestandardsSCENARIO 2:Baseload Baseload set-aside, or Baseload tax incentive, or Integration charge for VREsSCENARIO 3:Geothermal Geothermal set-aside, or Geothermal tax incentive14
GeoVision Barriers Analysis SummaryHome2.2 Market Deployment AnalysesSTEP 1STEP 2STEP 3STEP 4Supply Curves Demand DataTransmission DataTechno-EconomicAssessmentConstruction TimelineData FinanceDataINPUTSCost DataResource AssessmentEtc .Deployment CurvesMODELSGETEMEXCELReEDsJEDI, IMPLAN, OthersTechno-EconomicAssessmentSupply CurvesDeployment CurvesEconomic, Environmentand Energy SecurityOUTPUTSIMPACTS:STEP 5: Repeat for improvement scenarios15
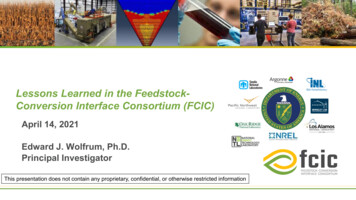
GeoVision Barriers Analysis SummaryHome2.2 GETEM Tool OverviewThe Geothermal Electricity Technology Evaluation Model (GETEM) is an Excelbased tool used to estimate the levelized cost of energy (LCOE) for definablegeothermal scenarios.GETEM inputs wereutilized in the GeoVisionto develop supply curvesfor deployable geothermalresources.Overnight Capital Costs (2015US /kWe)GETEM only considerselectric power generationand does not provideassessment capabilitiesfor geothermal direct-useor geothermal heatpumps.Example supply curves developed using GETEM alNF-EGS 35,000 30,000 25,000 20,000 15,000 10,000 5,000 005,00010,00015,00020,000Available Capacity (MWe)For more information about GETEM, see: tricity-technology-evaluation-model16
HomeGeoVision Barriers Analysis Summary2.2 ReEDs Tool OverviewThe Regional Energy Deployment System (ReEDS) is a long-term capacity-expansionmodel for the deployment of electric power generation technologies and transmissioninfrastructure throughout the contiguous United States (NREL 2018b).ReEDS models future capacity installations on grids for the contiguous United Statesbased on projections of electricity demand and the cost of developing new generationcapacity within and among regions. ReEDS is an optimization routine, and it selectscapacity additions among the available electricity generating technologies that minimizesystem costs within the model constraints and requirements. This requires the samedegree of knowledge about the cost and availability of all the electricity generationtechnologies included in the model. ReEDS also needs supply curves for all thesetechnologies. For GeoVision, the Annual Technology Baseline (ATB) was used (NREL2018a). The ATB is a set of input assumptions updated annually by NREL to support andinform electric section analysis in the United States. Finally, ReEDS requires projectionsof electricity demand and fuel prices. These come from the Standard Scenarios, whichare also updated annually by NREL. The GeoVision study assumes the NREL mid-casescenario for all modeling runes, unless otherwise noted. This scenario uses the middle,i.e., most likely, projections for technology costs, fuel costs, electricity demand, andother trends. GeoVision used the 2016 version of the ATB (Cole et al. 2016a) and the2016 version of the Standard Scenarios (Cole et al. 2016b).For more information about ReEDs, see: http://www.nrel.gov/analysis/reeds/17
HomeGeoVision Barriers Analysis Summary2.3 Barriers Expert Team (BET) ActivitiesFor the institutional barriers analysis for GeoVision, we assembled a barriers expert team(BET) of geothermal experts from industry and federal agencies to provide regular, scheduledinput and review of our methodology and results through monthly meetings and documentreview.The BET reviewed the following analysis activities in progression: Creation of the socio-economic attributes and sub-attributes to reflect the non-technicalbarriers faced by the geothermal industry. SEAT grading system, including for each sub-attribute a descriptive, objective qualifier forletters A to E, with E reflecting the most difficult barrier for the sub-attribute. Grading from A to E for each attribute that reflects the weighted sums of the sub-attributesto reflect the most difficult barrier for the attribute. Collection and/or creation of data to map each sub-attribute for the United States. Identification of specific thresholds for sub-attributes, if applicable, which would currentlymake a project unallowed and blacked them out on the map. For example, for theBiological Resources sub-attribute described above, any area mapped as a grade E wasdetermined to be currently unallowed for project development and was blacked out on theBiological Resources grade map.18
HomeGeoVision Barriers Analysis Summary2.3 Barriers Expert Team (BET) Activities (continued) Identification of criteria for decision making on projects, including specific situations currentlyconsidered a significant barrier or that might raise flags for project development. For example, all of thedevelopers we interviewed said they would consider Sage Grouse PHMAs (grade D) to be a significantbarrier to geothermal development. Assignment of weights to each of the sub-attributes based on the sub-attributes’ contributions todevelopment barriers. Sub-attributes that had the potential to cause significant barriers (e.g., biologicalresources) were given higher weights than those that caused less significant barriers (e.g., landownership). Combination of the sub-attribute maps into four attribute maps (land access, permitting, transmission,and market) using the BET-defined sub-attribute weights. The attribute maps reflect all of the areaswhere development was unallowed for the summed attribute grade. All maps are available onGeothermal Prospector (https://maps.nrel.gov/geothermal-prospector) and the Geothermal DataRepository (https://gdr.openei.org). Collection of costs for each grade of the sub-attribute to calculate the total costs for the four socioeconomic attributes to determine whether specific socio-economic cost thresholds alone would make ageothermal project economically unfeasible. Assessment of the amount of geothermal resource potentially impacted by each attribute estimated byoverlaying each of these attribute and sub-attribute maps over United States Geological Survey (USGS)maps of identified and undiscovered geothermal resource potential in the United States.The combination of maps, cost data, and USGS resource potential were used to review and modify, ifnecessary, the inputs to GETEM runs conducted for the GeoVision Study’s market penetration analysis.19
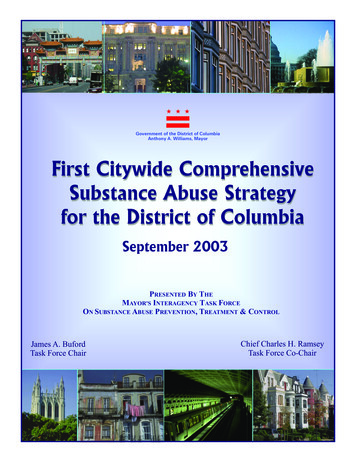
GeoVision Barriers Analysis SummaryHome3.1 Comparison Scenario: Business as UsualThe first step in the GeoVision market penetration analysis is to establish the baseline: Ifbusiness were to continue as usual (i.e., without improvements in cost or efficiencies)—a.k.a. business as usual or BAU case—what would the geothermal deployment in theUnited States look like between now and 2050?Overnight Capital Costs (2015US /kWe)ReEDs Model Input: BAU Supply Curve alNF-EGS 35,000 30,000 25,000 20,000 15,000 10,000 5,000 005,00010,00015,000Available Capacity (MWe)20,000The supply curve shownincludes several types ofgeothermal resources,including identifiedhydrothermal,undiscoveredhydrothermal, near-fieldenhanced geothermalsystems (EGS), and deepEGS. The lowest-costresources to deploy arehydrothermal andundiscovered, followed bya steep incline in cost (atabout 30 GW) indeveloping EGS.20
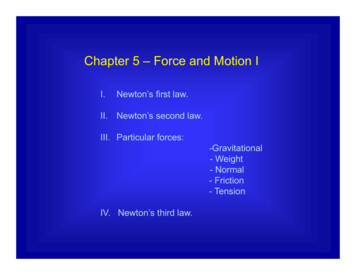
GeoVision Barriers Analysis SummaryHome3.1 Comparison Scenario: Business as UsualReEDs Model Output: BAU Deployment Curve7,000In the BAU scenario, wesee identifiedhydrothermal resourcesbeing developedthrough 2020, thenundiscovered resourcesdeveloped through2050, for a totaldeployment of 5.9 GWe.This corresponds to anincrease in geothermaldeployment of 3.5 GWeover the next 40 years.Undiscovered Hydrothermal6,000Identified HydrothermalGeothermal Capacity Modeled Year21
GeoVision Barriers Analysis SummaryHome3.2 Comparison Scenario: Disruptive TechnologiesThe next step in the GeoVision market penetration analysis is to develop a supply curveassuming potential disruptive technology improvements and then analyze the expectedchange in deployment if these improvements occurred—what would the newgeothermal deployment in the United States look like between now and 2050?ReEDs Model Inputs: Barriers Analysis Technology Improvement (BTI) Supply Curve180000Geothermal Capital Cost ( /kW)The improved technology caseincludes improvements indrilling costs, explorationsuccess, and EGS technologiesamong other things (see P2Pappendix for details) but doesnot include any improvementsto non-technical barriers.BAU160000BarriersTechImprovement (BTI) 0001200001000008000060000This BAU and BTI will be usedas the comparison cases tomeasure potentialimprovements due to variousbarrier 00Geothermal Capacity (GW)22
GeoVision Barriers Analysis SummaryHome3.2 Comparison Scenario: Disruptive TechnologiesReEDS Model Output: Improved Technology Deployment Curve60,000The baseline BTI casedeploys 48,515 MW ofgeothermal power. This is42,480 MW over the BAUcase (5,936 MW).50,000BAU 03020352040204560,0002050Deep EGSNear-field EGS50,000The baseline BTI case deploys:3.9 GW of identified hydrothermal,3.7 GW of undiscovere
data sets through seven national laboratory partners that were organized into eight technical task force groups. These task f orces and their respective principal leading national laboratory are listed in Table F- 1. The table also provides a guide to the final research documents produced by each GeoVision task force.