Transcription
Chapter 2TheorTheoryy ofConsumer BehaviourIn this chapter, we will study the behaviour of an individualconsumer. The consumer has to decide how to spend her incomeon different goods1. Economists call this the problem of choice.Most naturally, any consumer will want to get a combination ofgoods that gives her maximum satisfaction. What will be this ‘best’combination? This depends on the likes of the consumer and whatthe consumer can afford to buy. The ‘likes’ of the consumer arealso called ‘preferences’. And what the consumer can afford to buy,depends on prices of the goods and the income of the consumer.This chapter presents two different approaches that explainconsumer behaviour (i) Cardinal Utility Analysis and (ii) OrdinalUtility Analysis.Preliminary Notations and AssumptionsA consumer, in general, consumes many goods; but for simplicity,we shall consider the consumer’s choice problem in a situationwhere there are only two goods2: bananas and mangoes. Anycombination of the amount of the two goods will be called aconsumption bundle or, in short, a bundle. In general, we shalluse the variable x1 to denote the quantity of bananas and x2 todenote the quantity of mangoes. x1 and x2 can be positive or zero.(x1, x2) would mean the bundle consisting of x1 quantity of bananasand x2 quantity of mangoes. For particular values of x1 and x2, (x1,x2), would give us a particular bundle. For example, the bundle(5,10) consists of 5 bananas and 10 mangoes; the bundle (10, 5)consists of 10 bananas and 5 mangoes.2.1 UTILITYA consumer usually decides his demand for a commodity on thebasis of utility (or satisfaction) that he derives from it. What isutility? Utility of a commodity is its want-satisfying capacity. Themore the need of a commodity or the stronger the desire to have it,the greater is the utility derived from the commodity.Utility is subjective. Different individuals can get different levelsof utility from the same commodity. For example, some one who1We shall use the term goods to mean goods as well as services.The assumption that there are only two goods simplifies the analysis considerably and allows usto understand some important concepts by using simple diagrams.22020-21
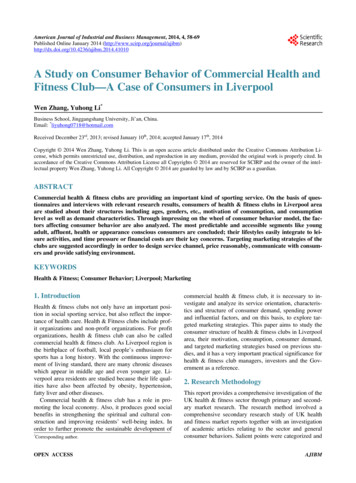
likes chocolates will get much higher utility from a chocolate than some onewho is not so fond of chocolates, Also, utility that one individual gets from thecommodity can change with change in place and time. For example, utility fromthe use of a room heater will depend upon whether the individual is in Ladakhor Chennai (place) or whether it is summer or winter (time).2.1.1 Cardinal Utility AnalysisCardinal utility analysis assumes that level of utility can be expressed innumbers. For example, we can measure the utility derived from a shirt and say,this shirt gives me 50 units of utility. Before discussing further, it will be usefulto have a look at two important measures of utility.Table 2.1: Values of marginal and total utility derived from consumptionof various amounts of a commodityUnitsTotal Utility123456121822242422Marginal Utility126420-22020-219Theory of ConsumerBehaviourMeasures of UtilityTotal Utility: Total utility of a fixed quantity of a commodity (TU) is the totalsatisfaction derived from consuming the given amount of some commodity x.More of commodity x provides more satisfaction to the consumer. TU dependson the quantity of the commodity consumed. Therefore, TUn refers to total utilityderived from consuming n units of a commodity x.Marginal Utility: Marginal utility (MU) is the change in total utility due toconsumption of one additional unit of a commodity. For example, suppose 4bananas give us 28 units of total utility and 5 bananas give us 30 units of totalutility. Clearly, consumption of the 5th banana has caused total utility to increaseby 2 units (30 units minus 28 units). Therefore, marginal utility of the 5th bananais 2 units.MU5 TU5 – TU4 30 – 28 2In general, MUn TUn – TUn-1, where subscript n refers to the nth unit of thecommodityTotal utility and marginal utility can also be related in the following way.TUn MU1 MU2 MUn-1 MUnThis simply means that TU derived from consuming n units of bananas isthe sum total of marginal utility of first banana (MU1), marginal utility of secondbanana (MU2), and so on, till the marginal utility of the nth unit.Table No. 2.1 and Figure 2.1 show an imaginary example of the values ofmarginal and total utility derived from consumption of various amounts of acommodity. Usually, it is seen that the marginal utility diminishes with increasein consumption of the commodity. This happens because having obtained someamount of the commodity, the desire of the consumer to have still more of itbecomes weaker. The same is also shown in the table and graph.
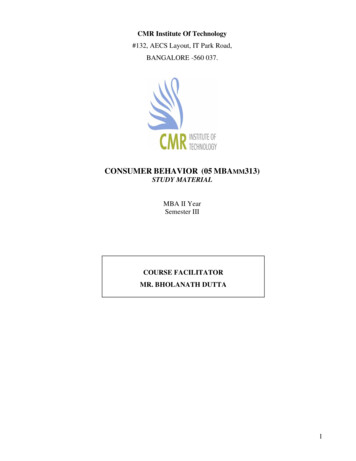
Notice that MU3 is less thanMU2. You may also notice thattotal utility increases but at adiminishing rate: The rate ofchange in total utility due tochange in quantity of commodityconsumed is a measure ofmarginal utility. This marginalutility diminishes with increasein consumption of thecommodity from 12 to 6, 6 to 4 The values of marginal and total utility derivedand so on. This follows from the from consumption of various amounts of alaw of diminishing marginal commodity. The marginal utility diminishes withutility. Law of Diminishing increase in consumption of the commodity.Marginal Utility states thatmarginal utility from consuming each additional unit of a commodity declinesas its consumption increases, while keeping consumption of other commoditiesconstant.MU becomes zero at a level when TU remains constant. In the example, TUdoes not change at 5th unit of consumption and therefore MU5 0. Thereafter,TU starts falling and MU becomes negative.IntroductoryMicroeconomics10Derivation of Demand Curve in the Case of a Single Commodity (Law ofDiminishing Marginal Utility)Cardinal utility analysis can be used to derive demand curve for a commodity.What is demand and what is demand curve? The quantity of a commodity thata consumer is willing to buy and is able to afford, given prices of goods andincome of the consumer, is called demand for that commodity. Demand for acommodity x, apart from the price of x itself, depends on factors such as pricesof other commodities (see substitutes and complements 2.4.4), income of theconsumer and tastes and preferences of the consumers. Demand curve is agraphic presentation of various quantities of a commodity that a consumer iswilling to buy at different prices of the same commodity, while holding constantprices of other related commoditiesand income of the consumer.Figure 2.2 presents hypotheticaldemand curve of an individual forcommodity x at its different prices.Quantity is measured along thehorizontal axis and price is measuredalong the vertical axis.The downward sloping demandcurve shows that at lower prices, theindividual is willing to buy more ofcommodity x; at higher prices, she iswilling to buy less of commodity x. Demand curve of an individual forTherefore, there is a negative commodity xrelationship between price of acommodity and quantity demanded which is referred to as the Law of Demand.An explaination for a downward sloping demand curve rests on the notionof diminishing marginal utility. The law of diminishing marginal utility statesthat each successive unit of a commodity provides lower marginal utility.2020-21
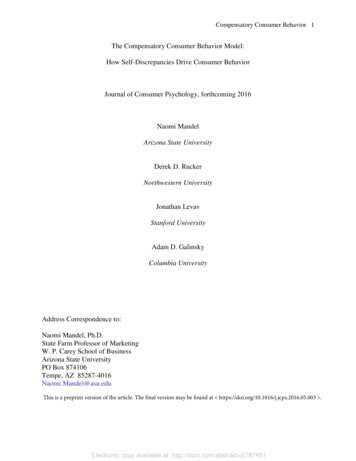
Therefore the individual will not be willing to pay as much for each additionalunit and this results in a downward sloping demand curve. At a price of Rs. 40per unit x, individual’s demand for x was 5 units. The 6th unit of commodity xwill be worth less than the 5th unit. The individual will be willing to buy the 6thunit only when the price drops below Rs. 40 per unit. Hence, the law ofdiminishing marginal utility explains why demand curves have a negative slope.constant. So, MRS Y / X 3.One can notice that, in the table 2.2, as we increase the quantity of bananas,the quantity of mangoes sacrificed for each additional banana declines. In otherwords, MRS diminishes with increase in the number of bananas. As the number3 Y / X Y / X if ( Y / X ) 0 Y / X if ( Y / X ) 0MRS Y / X means that MRS equals only the magnitude of the expression Y / X . If Y / X 3 / 1 it means MRS 3.2020-2111Theory of ConsumerBehaviour2.1.2 Ordinal Utility AnalysisCardinal utility analysis is simple to understand, but suffers from a majordrawback in the form of quantification of utility in numbers. In real life, wenever express utility in the form of numbers. At the most, we can rank variousalternative combinations in terms of having more or less utility. In other words,the consumer does not measure utility in numbers, though she often ranksvarious consumption bundles. This forms the starting point of this topic – OrdinalUtility Analysis.A consumer’s preferences over the set of available bundles can often berepresented diagrammatically. Wehave already seen that the bundlesavailable to the consumer can beAplotted as points in a twodimensional diagram. The pointsrepresenting bundles which give theconsumer equal utility can generallybe joined to obtain a curve like theone in Figure 2.3. The consumer issaid to be indifferent on the differentbundles because each point of thebundles give the consumer equalutility. Such a curve joining all pointsrepresenting bundles among which Indifference curve. An indifference curve joinsthe consumer is indifferent is called all points representing bundles which arean indifference curve. All the points considered indifferent by the consumer.such as A, B, C and D lying on anindifference curve provide the consumer with the same level of satisfaction.It is clear that when a consumer gets one more banana, he has to foregosome mangoes, so that her total utility level remains the same and she remainson the same indifference curve. Therefore, indifference curve slopes downward.The amount of mangoes that the consumer has to forego, in order to get anadditional banana, her total utility level being the same, is called marginal rateof substitution (MRS). In other words, MRS is simply the rate at which theconsumer will substitute bananas for mangoes, so that her total utility remains
Table 2.2: Representation of Law of Diminishing Marginal Rate of SubstitutionCombination Quantity of bananas (Qx) Quantity of Mangoes (Qy) MRSA115-B2123:1C3102:1D491:1of bananas with the consumer increases, the MU derived from each additionalbanana falls. Similarly, with the fall in quantity of mangoes, the marginal utilityderived from mangoes increases. So, with increase in the number of bananas,the consumer will feel the inclination to sacrifice small and smaller amounts ofmangoes. This tendency for the MRS to fall with increase in quantity of bananasis known as Law of Diminishing Marginal Rate of Substitution. This can beseen from figure 2.3 also. Going from point A to point B, the consumer sacrifices3 mangoes for 1 banana, going from point B to point C, the consumer sacrifices2 mangoes for 1 banana, and going from point C to point D, the consumersacrifices just 1 mango for 1 banana. Thus, it is clear that the consumer sacrificessmaller and smaller quantities of mangoes for each additional banana.Shape of an Indifference CurveIt may be mentioned that the law of Diminishing Marginal Rate of Substitutioncauses an indifference curve to be convex to the origin. This is the most commonshape of an indifference curve. But in case of goods being perfect substitutes4,the marginal rate of substitution does not diminish. It remains the same. Let’stake an example.Table 2.3: Representation of Law of Diminishing Marginal Rate of nQuantity of fiveRupees notes (Qx)Quantity of fiveMRSRupees coins (Qy)A18-B271:1C361:1D451:1Here, the consumer is indifferent for all these combinations as long as the totalof five rupee coins and five rupee notes remains the same. For the consumer, ithardly matters whether she gets a five rupee coin or a five rupee note. So,irrespective of how many five rupee notes she has, the consumer will sacrificeonly one five rupee coin for a five rupee note. So these two commodities areperfect substitutes for the consumer and indifference curve depicting these willbe a straight line.In the figure.2.4, it can be seen that consumer sacrifices the same number offive-rupee coins each time he has an additional five-rupee note.4Perfect Substitutes are the goods which can be used in place of each other, and provide exactlythe same level of utility to the consumer.2020-21
Monotonic PreferencesConsumer’s preferences areassumed to be such that betweenany two bundles (x1, x2) and (y1, y2),if (x1, x2) has more of at least one ofthe goods and no less of the othergood compared to (y1, y2), then theconsumer prefers (x1, x2) to (y1, y2).Preferences of this kind are calledmonotonic preferences. Thus, aconsumer’s preferences aremonotonic if and only if betweenany two bundles, the consumerprefers the bundle which has moreof at least one of the goods and noless of the other good as comparedto the other bundle.Features of Indifference Curve1. Indifferencecurveslopesdownwards from left to right:An indifference curve slopes downwardsfrom left to right, which means that inorder to have more of bananas, theconsumer has to forego some mangoes.If the consumer does not forego somemangoes with an increase in number ofbananas, it will mean consumer havingmore of bananas with same number ofmangoes, taking her to a higherindifference curve. Thus, as long as theconsumer is on the same indifferencecurve, an increase in bananas must becompensated by a fall in quantity ofmangoes.Indifference Map. A family ofindifference curves. The arrow indicatesthat bundles on higher indifference curvesare preferred by the consumer to thebundles on lower indifference curves.Slope of the Indifference Curve. Theindifference curve slopes downward. Anincrease in the amou
Consumer Behaviour In this chapter, we will study the behaviour of an individual consumer. The consumer has to decide how to spend her income on different goods1. Economists call this the problem of choice. Most naturally, any consumer will want to get a combination of goods that gives her maximum satisfaction. What will be this ‘best’ combination? This depends on the likes of the consumer and what