Transcription
Tourism Economics, 2008, 14 (4), 769–789A comparison of three economic impactmodels for applied hospitality andtourism researchMARK A. BONNDedman School of Hospitality, College of Business, Florida State University, 1 ChampionsWay, UCB, Room 4104, Tallahassee, FL 32306-2543, USA. E-mail: mbonn@cob.fsu.edu.JULIE HARRINGTONCenter for Economic Forecasting and Analysis, Florida State University, Tallahassee,FL, USA.This study examines the differences between three economic impactmodels: the capacity utilization model (CUM), Regional EconomicModels, Inc (REMI) and the impact analysis for planning (IMPLAN)model with a view to providing insights into their applicability forhospitality and tourism educators and researchers. Four databaseshave been used to compare the results concerning total output,income and employment. The results were most dissimilar for the‘income’ variable. The difference in income lies in the fact that thethree models estimated income in three different ways. The CUMestimated ‘payroll’, REMI estimated ‘disposable personal income’ andIMPLAN estimated ‘value added’. Due to the different incomemeasurements, REMI’s income estimates were the highest, while theCUM’s were the lowest. This study does not strive to recommend oneeconomic impact model over another; however, it does examine thebehaviour of the respective models concerning various data sets anddescribes the underlying characteristics of the models.Keywords: economic impact; tourism models; IMPLAN; REMI;capacity utilization model (CUM)Tourism contributes significantly to the US economy as it impacts a wide rangeof business sectors and augments employment and payroll income. During2003, total tourism-related direct and indirect employment was 5.4 million and2.5 million, respectively (Kuhbach and Herauf, 2005). The tourism industry’sThe authors would like to thank the Apalachee Regional Planning Council and the Tampa RegionalPlanning Council for providing the opportunity to use the region-specific REMI software for theirrespective counties.
770TOURISM ECONOMICSvalue added grew 4.5% to US 285 billion, which represented 2.6% of the GDPfor the period 2001–2003 (Kuhbach and Herauf, 2005). Moreover, tourismprovides tremendous benefits for federal, state and local governments in theform of taxes (for example, excise, sales, income and property taxes). In 2004,the industry generated an estimated US 100 billion in taxes based on US 546.4billion of direct sales from tourism (Travel Industry Association of America,2005 – personal communication with Dr Tien Tian).The economic impacts of tourism are frequently analysed using economicimpact modelling software. The objective of this paper is to compare threeeconomic impact models (the capacity utilization model (CUM), RegionalEconomic Models, Inc (REMI) and the impact analysis for planning (IMPLAN)model) using four visitor survey expenditure databases. The study also examinesprevious tourism economic impact studies (from 1990 to current) to determinemethodologies pertaining to CUM, REMI and IMPLAN.In doing so, the State of Florida was selected to provide data sets for analysisof the economic impact models. Florida was selected because tourism is thenumber one industry, due primarily to its natural resources, a favourableclimate, an immense shoreline, theme parks, professional and major universitysports, major airports and cruise industry ports, cultural events and retirementcommunities. The number of Florida tourists reached a record 76.8 million in2004 and is projected to grow to 89 million by 2010 (Visit Florida, 2006).Currently, 1.3 million Florida jobs are related directly or indirectly to tourismand are projected to grow to between 1.5 and 1.8 million by 2010. The 2005Florida Visitor Study reported that the state collected US 3.7 billion intourism/recreation sales taxes in 2005; that is, US 62 billion was infused intothe state’s economy during the year through tourist expenditures. The studyalso noted that tourism expenditures supported 948,700 jobs in 2005 (VisitFlorida, 2005). Tax revenues accounted for about 20% of the total tax revenues(in sales and use taxes) collected (Baker and Aydin, 2005).Literature review of economic impact modelsThere have been various studies relating to the economic impact estimation oftourism spanning the past 20 years; however, few articles exist that comparethe performance of those models. Following is a literature review of several ofthe studies that have examined economic impact modelling and performancewith respect to the tourism industry. Stynes (1999) conducted numerous studiesthat focused on the economic impacts of tourism. He outlined severalapproaches that researchers might employ, including four typical approaches:(a) subjective estimates that rely on expert opinion; (b) secondary data, inaggregate form, using existing estimates tailored to the situation; (c) secondarydata, in disaggregate form, allowing a finer resolution to fit the situation; and(d) primary data and/or formal models, usually involving visitor surveys andregional economic models. It is the latter issue of economic impact modellingthat this paper will address. Archer (1984) described the sources available toacquire data and the necessary processes to adapt these data for use in input–output (I/O) modelling. He noted that a local or regional consumer expendituresurvey was rarely available and was both expensive and time-consuming. However,
Three economic impact models771this study was able to utilize those ‘expensive and time-consuming’ data setssince the local verifiable survey data was collected based on a series of personalinterviews using the randomized sampling design. Hence, this would serve tostrengthen the ability of this paper to allow more accurate comparisons of CUM,REMI and IMPLAN.Ryan (2003) discussed the economic impacts of tourism and economic impactmodels. He pointed out that while I/O analysis further refined the basicmultiplier processes, the transference to service (in particular, tourism sectors)was hampered by the lack of definition with regards to the tourism industry.There are no SIC or NAICS codes assigned solely to the tourism sector.Currently, there are only two NAICS codes pertaining to two tourism-relatedsectors:1 Convention and Visitor’s Bureau and Administration of GeneralEconomic Programmes. As can be surmised, the tourism sector is still not fullydefined by NAICS.A seminal work, and highly quoted tourism economics text, Economics ofOutdoor Recreation (Clawson and Knetsch, 1971), discussed the economic impactof outdoor recreation, including tourism, on local areas. Although the book didnot cover economic impact modelling per se, it provided an economic impactfoundation for the calculation of multipliers and procedures regardingexpenditure surveys.In Travel, Tourism, and Hospitality Research: A Handbook for Managers andResearchers (1994a,b,c), Frechtling provided an overview of Archer and Owens’sad hoc model (developed individually for each area studied). He recommendedusing the ad hoc model and the I/O approach, depending on the budget availableand the expertise of the researchers. Frechtling suggested that IMPLAN wasa cost-effective way to measure total tourism impacts on an area’s economy. Inconclusion, he advocated that the time had come to progress beyond measurement issues and begin to draw conclusions that could be applied broadly topublic marketing, planning and development decision making.In 2001, The Connecticut Center for Economic Analysis (CCEA) performedan economic impact study of Connecticut’s travel and tourism industry usingREMI. They employed a mix of survey methods to calculate a reliable estimateof total tourism-related economic activities in Connecticut. They examined 8counties and 11 tourism ‘districts’. Their results revealed that, in relative terms,Connecticut’s travel and tourism industry employed a larger fraction of workersthan manufacturing or financial, insurance and real estate (FIRE).Rickman and Schwer compared the REMI and IMPLAN economic modelsin 1993 and 1995a,b. To date, their studies are the only ones that exist, theexception being a paper by Perlich (2005), that describe the differences betweenREMI and I/O. Crihfield and Campbell (1992) and Deller (1992) ultimatelyfound that, based on the structural differences in the REMI and IMPLANmodels, differences did not affect the multiplier estimates significantly. In their1995b study, Rickman and Schwer examined how multipliers compared amongvarious versions of the models. They found that there was a tendency forIMPLAN to overestimate the regional purchase coefficients (RPCs) in theservice sectors, such as in resource-based and tourist-based economies. It wasdiscussed, however, that this would be easy to remedy based on the user’s abilityin IMPLAN to alter or adjust RPCs. However, this limitation could result inunintentional underestimation because it is arbitrary and non-scientific.
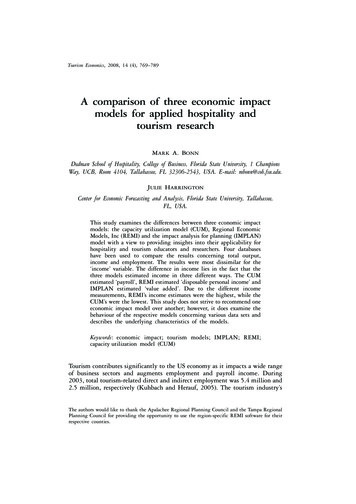
772TOURISM ECONOMICSDescription of modelsThe capacity utilization model (CUM)The capacity utilization model (CUM) was developed originally in 1990 byHenry Fishkind for economic analysis of tourism in the State of Florida. Fishkindand Associates conducted numerous tourism studies in Florida and other states.One of those studies was summarized in the Central Florida Visitor IndustryReport in 1989. With respect to tourism, the CUM quantifies the economicimpact (labour and fiscal) that tourism has on the local economy. The basicassumption of CUM is that it uses the hotel/motel industry as a baseline. In orderto measure the capacity of the tourism sector, the model uses the hotel/motelindustry as a baseline and obtains total numbers of rooms available and occupancyrate information from a national industry reporting service, Smith Travel Research.2 Additionally, surveys of local lodging properties for each of the fourstudies were conducted to determine occupancy rate, average daily rate andhistorical occupancy during the specific time of the event and estimates of totalnumbers of rooms sold to event attendees. This information was compared withthe Smith Travel information to provide an increased accuracy. The models alsoused the following information based on survey instruments: estimates of averageparty size for those using hotel and motel accommodations, the average triplength in nights for those staying in hotels/motels and the proportion of visitorswho stay in hotel/motels versus those staying with friends and relatives, incampgrounds, condominiums, as well as visitors coming just for the event andspending no evenings in the area. Visitor expenditures (hotels, transportation,entertainment and food, etc) were also obtained through the survey.Using the CUM to estimate the total number of visitors is especially valuablewhen the event is open access and visitor numbers cannot be obtained by thetotal number of tickets sold. The CUM has been used by Bonn and Bell (1998and 2003) to estimate economic impact, recreational (use) value and visitornumbers associated with natural springs and artificial and natural reefs. Thesestudies involved 21 Florida counties over a six-year period. Economic impactis measured by the direct and indirect output and employment created byvisitors, as well as total wages paid to visitor industry employees and thegeographic distribution of the paid salaries. The CUM does not address inducedimpacts. Multipliers in this model for Tampa, Florida and Tallahassee, Florida,were obtained using the US Department of Commerce database on countymultiplier statistics. A multiplier of 1.5 was provided and used to estimate thetotal output (that is, direct expenditures (Table 1) 1.5 total output).3 Directemployment and wages were estimated using the latest statistics published byEconomic Census, the US Census Bureau (Economic Census, 2002). For the twoevents and two quarterly databases studied in this article, the 1997 EconomicCensus was used and updated using the Consumer Price Index (that is, CPI)for inflation. Figure 1 outlines the theoretical framework for the calculation ofeconomic impact estimates in the CUM.The REMI modelREMI 2002 is a widely used dynamic integrated I/O and econometric model.REMI is based on neoclassical theory and was founded in 1980. The model’s
Three economic impact modelsOn site visitor surveydata collectionSmith Travel Research:hotel/motel occupancydateDirect employmentcreated by visitorsEconomic census lateststatistics773CUM development:percentage of hotel/motel visitors; party size;length of stay; per party spending;occupancy dataTotal visitorestimateTotal direct visitorspending estimateTotal visitor direct economic impactMultipliersDirect wages paid tovisitor industry employeesTotal visitor direct & indirect economicimpactFigure 1. CUM economic impact analysis framework.structure incorporates inter-industry transactions and endogenous final demandfeedbacks. The basic assumption of REMI is that the model is based ontheoretical structural restrictions rather than individual econometric estimatesbased on single time-series observations for each region. It has much in commonwith the computable general equilibrium (CGE) models. It does, however, differfrom the CGE models in that the REMI model does not require markets toclear continuously (Treyz, 1993). REMI is used extensively to measure proposedlegislative and other programme and policy economic impacts across the privateand public sectors of the state by the Florida Joint Legislative ManagementCommittee, Division of Economic and Demographic Research, the FloridaDepartment of Labor and other state and local government agencies. In addition, itis the chosen tool to measure these impacts by a number of universities andprivate research groups that evaluate economic impacts across the state andnation. Figure 2 provides a baseline for the calculation of economic impactestimates in REMI.REMI shares two underlying assumptions with mainstream economic theory:households maximize their utility and producers maximize their profits. Itincludes hundreds of equations that describe cause-and-effect relationships inthe economy, extending beyond an I/O model.The REMI used for this analysis (version 8.0) was developed specifically bycounty for the state of Florida and included 23 sectors. For the Tallahassee area,the county model comprised Leon, Jefferson, Gadsden and Wakulla counties.For the Tampa area, Hillsborough, Pinellas, Pasco and Manatee counties wereexamined. REMI’s principal advantage is that it is a dynamic I/O econometric
774TOURISM ECONOMICS(1) OutputState and local governmentspendingConsumptionOutputInvestment(3) DemographicMigrationParticipationrateReal disposable incomeExports(2) Labour & ockEmployment(5) Market SharesDomesticmarketshareInternationalmarket shareLabour/outputratio(4) Wages, Prices & CostsEmployment opportunityHousing priceCompensationConsumer pricedeflatorCompositecompensation rateReal compensationrateProduction costsComposite pricesFigure 2. REMI economic impact analysis framework.model and can be used to forecast both direct and indirect economic effects overmultiple-year time frames. However, the model is not county specific, whichcould lead to unnecessarily inflated results. Other I/O models are used primarilyfor static or single-year analysis. REMI uses three sources of employment, wageand salary data: the Bureau of Economic Analysis (BEA) employment, wage andpersonal income series, ES 202 establishment employment and wage and salarydata, and county business patterns (CBPs) data published by the Bureau of theCensus. The industries are based on the North American IndustrialClassification System (NAICS).IMPLAN modelThe impact analysis for planning, or IMPLAN, model, in contrast to REMI,is solely an I/O model. The theoretical framework is input–output, developedby Wassily Leontief, for which he received the Nobel Prize in 1973. The basicassumption of the IMPLAN model is that the fundamental information inI/O analysis involves the flow of products from each industrial sector (producer)to each of the industrial sectors considered as consumers. This information iscontained in an inter-industry transactions table. The rows of the table representthe distribution of the producer’s output throughout the economy. The columnsrepresent the composition of inputs required by an industry to produce itsoutput. There are additional columns that depict ‘final demand’, or sales, by
Three economic impact modelsCommodities775IndustriesFinalUse matrixPCE low incomePCE medium incomePCE high income(Absorption matrix)TotalcommodityoutputS&L gov’t pur/non-edS&L gov’t pur/edMake matrixFinal paymentsEmployee compensationIndirect business taxProprietary incomeOther property type income(By-product matrix)(Market share matrix)Total industry outlayTotalindustryoutputInventory purchasesCapital formationForeign exportsDomestic exportsS&L gov’t salesFed gov’t salesInventory salesCompetitive imports matrixNon-competitive imports matrixFed gov’t pur/non-milFed gov’t pur/milCompetitive imports matrixTotal commoditysupplyNon-competitive imports matrixFinal demand totalsFigure 3. IMPLAN economic impact analysis framework.Source: IMPLAN Central NRCS Economists Workshop (MIG, Inc, 1997).each sector to final markets for their production. The additional rows are termed‘value added’, which comprise the other non-industrial inputs to production,such as labour. IMPLAN was founded in 1993 as an extension of tworesearchers’ work at the University of Minnesota and involving collaborativework with the US Forest Service Land Use Planning Unit in Colorado. It isnon-survey based and its structure illustrates that of I/O models found in theregional science literature. Figure 3 provides a baseline for the calculation ofthe economic impact estimates in IMPLAN.Key I/O assumptions used in IMPLAN(1) Constant returns to scale production function (that is, linear).(2) Homogeneous sector output.(3) No input substitution.(4) No supply constraints.(5) Other IMPLAN considerations:(a) Technology and trade relations are assumed.(b) Need to account for price changes.(c) Need to account for structural changes.(d) Employment increase or decrease causes immediate in or outmigration (that is, full employment).Similar to REMI, IMPLAN assumes a uniform national production technologyand uses the RPC approach to regionalize the technical coefficients. IMPLAN2002 Florida county-level was used for the economic analysis for this research.This newer version now has 509 sectors instead of 528 and includes theconversion from SIC to NAICS codes. The primary sources of employment andearnings data are CBPs data and BEA data.Table 1 provides a summary of the three economic impact models.
776TOURISM ECONOMICSTable 1. Comparison of the three models.aCharacteristicsREMII.TypeConjoined input–output Regional input–and behaviour modeloutputII.General modelcharacteristicsBase yearReference modelOpen/closedSector ntechniqueProduct mixConsumptionTrade patternsV.VI.Impacts measuredOutputEmploymentIncomeSpecial featuresVII. ComputerrequirementsVIII. CostsPurchase modelIMPLANCUMDerived from labourforce economics,linear equationIndividual tourismarrivals1980National A matrixOpen19931975, updated in 1990sNational A matrixBoth49350923 (county) or 70 sector User choice(state) or 169 (state)Unlimited anddependent on surveyvariable numbersUser choiceKeep at a disaggregatedlevelBLS Regional ConsumerExpenditure SurveysRegional purchasecoefficientsKeep at a disaggregated levelAdjusted usingRPCsRegional purchasecoefficientsKeep at a disaggregatedlevelAdjusted usingmultipliersMultipliers can beinput into the model(from other source)YesYesYesEconomic GeographyTransight20/20 Policy Insight,BizDevYesYesYesCounty Data,Zip Code,Level DataYesYesYesTourism andhospitality industryspecificIBM PC or mainframeIBM PC ormainframeIBM PCVariable; many optionsand pricing schemesavailable (for example,US 46,000) for primarylicence (70 sector stateof Florida andUS 69,000 169 sector)and US 6,900 forsecondary licence forstate of Florida modelUS 540 software FreeState totalspackages US 500–US 2,650 state(including counties)Individual stateUS 350Zip Code LevelFile US 425
Three economic impact models777Table 1 continued.CharacteristicsCustomizedsimulationOther optionsIX.X.DataTime periodXI.WebsiteREMIIMPLANCUMAvailableLeasing models areavailableSecondaryDynamic, 50 years ormorehttp://www.remi.com/AvailableAvailable on requestCustomized modelsSecondaryStatic, one fishkind.com/Note: aExcerpted from ‘Analyzing the economic impact of transportation projects using RIMS II,IMPLAN and REMI’, Dr Tim Lynch, Director, Center for Economic Forecasting and Analysis (2000).Prepared for Office of Research and Special Programs, US Department of Transportation, Washington,DC. Supported by a grant from the US Department of Transportation, University Research InstituteProgramme.Overview of Florida tourism expenditures databasesDuring 2003–2004, researchers based in Florida collected survey data duringtwo special events: the Southwest Airlines Gasparilla Pirate Fest (Gasparilla)and the University of Miami versus Florida State University Football GameWeekend (Miami vs FSU). Also, data were collected for two quarterly researchprojects involving visitors to Florida destinations within specific counties:Tampa (Hillsborough County) and Tallahassee (Leon County), Florida. Datawere collected based on a series of personal interviews for each of the two eventsencompassing three days. Additionally, data were collected over the course ofthree months for each of the two quarterly databases. The following discussionis a detailed explanation on methodologies for each of the two events and thetwo quarterly databases that were used in the economic impact analysiscomparisons.Gasparilla 2004The Southwest Airlines Gasparilla Pirate Fest is an open access mega-event thatis held in Tampa, Florida. The annual event consists of a day parade thattraverses an eight-mile route along what may be the longest contiguous sidewalkin the USA. On-site surveys were conducted based on a randomized samplingdesign. Surveyors were stationed at specific points on both sides of the paraderoute. Every third adult was approached for qualification as a non-resident. Ifthe third adult was a local resident, then the next adult was approached fornon-resident qualification purposes. This process continued until non-residentparade attendees were identified. In this study, Gasparilla visitors were definedas those who were non-Hillsborough County residents. Ultimately, 300 Gasparillavisitors provided data suitable for this analysis.
778TOURISM ECONOMICSUniversity of Miami versus Florida State University Football WeekendDuring the weekend of 11 October 2003, the University of Miami versusFlorida State University Football Game attracted approximately 82,000individuals to the Doak Campbell Stadium through ticket sales. A significantnumber of tickets were purchased by local residents, including students, andwere therefore omitted from the analysis. On-site surveys were conducted basedon a randomized sampling design. Surveyors were stationed at specific datacollection points around the stadium. Additionally, surveys were conducted atrandomly selected lodging properties within the county. Every third adult wasapproached for qualification as a non-resident. If the third adult was a localresident, then the next adult was approached for non-resident qualificationpurposes. This process continued until non-resident attendees were identified.In this study, visitors were defined as those who were non-Leon Countyresidents. A total of 284 usable data were collected during the eventweekend.Tallahassee, Florida: Q1 2004Visitors to Tallahassee (Leon County, Florida) were interviewed personally aspart of a comprehensive destination marketing research project. During randomdays, sites and times, visitors were screened randomly using random numbersto qualify them as non-residents. Once qualified as non-residents of LeonCounty, visitors were asked to respond to a survey related to their on-site (mostrecent) travel experience. Information pertaining to economic expenditures,party size, length of stay, demographics, activities pursued during this trip,primary destination for this visit and many other dimensions were representedon the survey instrument. More than 500 (N 515) usable surveys werecollected for the analysis.Tampa, Florida: Q1 2004Visitors to Tampa (Hillsborough County, Florida) were interviewed personallyas part of a comprehensive destination marketing research project. The surveymethodology was identical to the Tallahassee Q1 study. A total of 1,538 surveyswere identified as suitable for the analysis.Economic impact methodologyThis paper describes the impact of tourism on the economy of Florida countiesusing three economic impact models (CUM, REMI and IMPLAN).Comparisons were conducted using the results from these three economic impactmodels and examined the increase in employment and economic outputgenerated by tourism activities specific to the counties’ economies. The neteconomic stimulus from tourism was estimated by summing tourismexpenditures based on survey data for four economic activities and events:
Three economic impact models779Gasparilla, Miami vs FSU Football Game, the Tallahassee quarterly and theTampa quarterly visitor survey. Direct expenditures were divided into thefollowing for each of the four databases: lodging, event admission fees,restaurants, evening entertainment, shopping, ground transportation, groceriesand all other. These expenditures were then used as inputs for the three Floridaregional I/O models, which included cross-linkages among every sector of theFlorida economy. As tourists/visitors expend dollars, further demand for goodsand services across other sectors of the Florida economy are generated. Directtourism spending creates a secondary ‘multiplier’ cycle of spending that furtherincreases income, jobs and total state economic activities, referred to as stateoutput. This analysis measures those direct and indirect economic increasesflowing from tourism dollars based on the four expenditure databases. Itdoes not quantify the intangible benefits generated by the presence oftourism to the local economy for issues such as improved transportation, healthcare, historical environment or cultural amenities, among others.Measured economic impacts include increases in: (a) total output; (b) income;and (c) employment. Short-term economic impacts are the net changes inregional output, earnings and employment that are due to new dollars enteringa region from a given enterprise or economic event. In this study, the enterpriseis tourism and the region is specific Florida counties. The effects of expendituresexternal to Florida (termed leakages) were not included in the impactestimates.As part of our modelling strategy, actual tourism expenditures were used tocalculate the economic impact (Table 2). The various tourism directexpenditures (for example, lodging, event admission fees, restaurants, shopping,ground transportation, groceries and all other) were disaggregated by specificeconomic sectors to calculate the economic impacts (Figure 4).Table 2. Amount of tourism expenditure by economic database/event for Gasparilla,Miami versus FSU Football Weekend, Tallahassee, Q1 and Tampa, Q1.Spending categoryby value(US million)Attraction feesEvening entertainmentEvent admission feesGroceriesGround transportationLodgingOther itemsRestaurantsShoppingSports activitiesTotal expenditureGasparillaMiamivs 162.4795.8022.00754.25Note: aEvents (US 22.8 was included with admission fees).
780TOURISM ECONOMICSFigure 4. Percentage of tourism expenditures by economic database/event forGasparilla, the Miami versus FSU Home Football Game Weekend, Tallahassee,Q1 and Tampa, Q1.
Three economic impact models781Model assumptionsThis paper provides estimates of the direct, indirect and induced effects oftourism expenditures on the economies of two Florida counties. The modelassumptions are:(1) The base model assumes a constant rate of growth for the economy.(2) The expenditure approach model uses actual tourism expenditures (bycategory: lodging, shopping, etc) multiplied by total estimated number ofvisitors.(3) The total number of visitors estimated by the CUM is valid and is usedin the REMI and IMPLAN models.(4) The total tourism expenditures by database are: Gasparilla – US 21.83million; FSU–Miami Game – US 10.07 million; Tallahassee Q1 –US 224.45 million; and Tampa Q1 – US 754.25 million. Results areexpressed in terms of impact on total output, income and employment.Model limitations(1) A limitation of the base model assuming a constant rate of growth for theeconomy is that there are multipliers associated with each sector; forexample, if one sector grows by X amount, then the whole economy growsby X times the sector multiplier. Hence, theoretically, growth in any sectorcan result in an arbitrary high level of growth in the corresponding wholeeconomy, which may not be the case. REMI has three options forsimulating the growth rate of an economy; historical observed (the defaultchoice), anticipatory fed and Keynesian approaches.(2) The expenditure approach model uses actual tourism expenditures (bycategory: lodging, shopping, etc) multiplied by total estimated number ofvisitors. Spending estimates are based on a representative sample of thetourist population, which encompass a wide array of tourist type, locationand seasonal varia
Dedman School of Hospitality, College of Business, Florida State University, 1 Champions Way, UCB, Room 4104, Tallahassee, FL 32306-2543, USA. E-mail: mbonn@cob.fsu.edu. . In Travel, Tourism, and Hospitality Research: A Handbook for Managers and Researchers (1994a,b,c), Frechtling provided an overview of Archer and Owens s