Transcription
EconomicReportto theGovernorP R E P A R E DU T A HB YE C O N O M I CT H EC O U N C I L2021A collaborative endeavor ofDavid Eccles School of BusinessGovernor’s Office of Management and Budget
PrefaceThe Utah Economic Report to the Governor servesas the preeminent source for data, research, andanalysis about the Utah economy. This 2021version marks 33 consecutive years of publication.The report provides timely and relevant data andanalysis about economic indicators, as well as afocus on critical industries in the state of Utah. Theimproved economic understanding and literacyhelps decision-makers make economicallyinformed decisions and helps Utah to prosper.Utah Economic Council and CollaboratorsThe Utah Economic Council prepares and overseesthe report’s contents and publication, under thesponsorship and partnership of the Governor’sOffice of Management and Budget, the DavidEccles School of Business, and the Salt LakeChamber. This partnership brings together thestrengths of government, academia, and businessinto a single report, providing a valuable economicasset to the community.More detailed information about the findings ineach chapter can be obtained by contacting theauthoring entity, which is referenced at thebeginning of each chapter.Data Used in This ReportData in this report are subject to error arising froma variety of factors, including sampling variability,reporting errors, incomplete coverage, nonresponse, imputations, and processing error.Contact the authoring entity for information aboutsources, limitations, and appropriate use of thedata included in this report.Data for States and CountiesThis report focuses on state and countygeographies, but also includes some sub-countydata. For information about data for a differentlevel of geography than shown in this reportcontact the contributing entity.Electronic AccessVisit the Kem C. Gardner Policy Institute’s websiteat www.gardner.utah.edu for a digital version ofthis report.Suggestions and CommentsThe Utah Economic Council encouragessuggestions and comments about the report.Send feedback to the Kem C. Gardner PolicyInstitute, 411 East South Temple Street, Salt LakeCity, Utah 84111 or by email at gardnerinstitute@eccles.utah.edu.The contents of this report come from a multitudeof sources. The authors source each table andfigure and generally provide data for the mostrecent year or period available as of midNovember 2020. Readers will often encounter aquarter or more of lag time before economic databecome final. Readers can refer to noted sourceslater in 2021 for final data.2021 ECONOMIC REPORT TO THE GOVERNORi
Authors and ContributorsThe 2021 Economic Report to the Governor ispublished by the Utah Economic Council, a jointventure between the Salt Lake Chamber, the DavidEccles School of Business, and the Governor’s Officeof Management and Budget. Under the guidance ofthe Utah Economic Council, economists,researchers, and analysts from a variety of entitiesprepare the Economic Report to the Governor.This report was edited and reviewed byKem C. Gardner Policy Institute and GOMB staff.Utah Economic CouncilPhil Dean, Governor’s Office of Managementand Budget, Co-ChairJuliette Tennert, Kem C. Gardner PolicyInstitute, Co-ChairKjersten Adams, EconomistWes Curtis, Southern Utah UniversityJohn Gilbert, Utah State UniversityNatalie Gochnour, David Eccles School ofBusiness/Salt Lake ChamberLeslee Katayama, Utah State Tax CommissionMark Knold, Utah Department ofWorkforce ServicesDoug MacDonald, EconoWestThomas Maloney, University of UtahCarrie Mayne, Utah System of Higher EducationDarin Mellott, CBREMichael Parker, Ivory HomesPeter Reichard, Utah FoundationKate Rubalcava, Utah Nonprofits AssociationRobert Spendlove, Zions BankDavid Stringfellow, Office of the UtahState AuditorNate Talley, Governor’s Office of Managementand BudgetAndrea Wilko, Utah Legislative FiscalAnalyst OfficeJames Wood, Kem C. Gardner Policy InstituteKem C. Gardner Policy InstituteDavid Eccles School of BusinessUniversity of Utah411 East South Temple StreetSalt Lake City, UT 84111(801) 585-5618gardner.utah.eduShannon Simonsen, Editor-in-ChiefMax BacklundMallory BatemanAndrea BrandleyJohn DownenDejan EskicMichael HogueThomas HolstJennifer LeaverLevi PaceJennifer RobinsonJoshua SpolsdoffLaura SummersJuliette TennertJames WoodChapters: Overview, Demographics, Real Estateand Construction, Tourism and Travel, Health Care,and Economic Regions.Governor’s Office of Management and BudgetState Capitol Complex350 North State Street, Suite 150Salt Lake City, UT 84114-2210(801) 538-1027gomb.utah.govPhil DeanNate TalleyMiranda Jones CoxGovernor’s Office of Economic Development60 E S Temple Suite 300Salt Lake City, UT 84111(801) 538-8680business.utah.govChapter: Economic Developmentii2021 ECONOMIC REPORT TO THE GOVERNOR
Utah Defense Alliance450 Simmons Way #400Kaysville, UT 84037utahdefensealliance.comCBRE222 Main Street, 4th FloorSalt Lake City, UT 84101(801) 869-8000cbre.usKevin SullivanDarin MellottChapter: DefenseChapter: National and Utah OverviewUtah Department of Agriculture and Food350 N Redwood Rd.Salt Lake City, UT 84116ag.utah.govDepartment of Natural Resources—Utah Geological Survey1594 West North Temple, Suite 3110Salt Lake City, UT 84114(801) 537-3300geology.utah.govCaroline HargravesChapter: AgricultureMichael Vanden BergAndrew RupkeStephanie MillsUtah Foundation150 South State Street, Suite 444Salt Lake City, UT 84111(801) 355-1400utahfoundation.orgChapters: Energy and MineralsDepartment of Workforce Services140 East 300 SouthSalt Lake City, UT 84111(801) 526-9458jobs.utah.govShawn TeigenLogan LoftisJared StaheliChapter: Social IndicatorsMark KnoldChapter: Employment, Wages, and Labor ForceEconomic Development Corporation of Utah201 South Main Street, Suite 2150Salt Lake City, UT 84111(801) 328-8824edcutah.orgChapter: Economic DevelopmentOffice of the Utah State AuditorEast Office Building, Suite E310Utah State Capitol ComplexSalt Lake City, UT 84114(801) 538-1025auditor.utah.govDavid StringfellowChapter: Price Inflation and Cost of LivingUtah Legislative Fiscal Analyst OfficeHouse Building, Suite W310Utah State Capitol ComplexSalt Lake City, UT 84114(801) 538-1034le.utah.govAndrea WilkoChapter: Gross Domestic Product by StateUtah Nonprofits Association4900 South Highland Drive, Suite BHolladay, Utah 84117(801) 596-1800utahnonprofits.orgBrandy StrandKate RubalcavaCollin MosquitoChapter: Nonprofit Sector2021 ECONOMIC REPORT TO THE GOVERNORiii
Utah State Board of Education250 East 500 SouthSalt Lake City, UT 84114(801) 538-7500schools.utah.govPatrick LeeJill CurryDale FrostKirin McInnisUtah System of Higher EducationBoard of Regents BuildingThe Gateway60 South 400 WestSalt Lake City, UT 84101(801) 321-7121higheredutah.orgCarrie MayneTrisha DugovicChapter: Public EducationChapter: Higher EducationUtah State Tax Commission210 North 1950 WestSalt Lake City, UT 84134(801) 297-3900tax.utah.govWorld Trade Center Utah60 S Temple #300Salt Lake City, UT 84111(801) 532-8080wtca.org/world-trade-center-utahEric CropperLeslee KatayamaJacoba LarsenChapters: Utah Taxable Sales,State Tax CollectionsUtah State UniversityEconomics and Finance DepartmentJon M. Huntsman School of Business3565 Old Main HillLogan, Utah 84322(435) 797-2314usu.eduChapter: ExportsZions BankOne South Main StreetSalt Lake City, UT 84133(801) 844-7000zionsbank.comRobert SpendloveDrew MaggeletChapter: Personal IncomeJohn GilbertJace JonesThomas MartineauAmanda OrtegaChapter: Exportsiv2021 ECONOMIC REPORT TO THE GOVERNOR
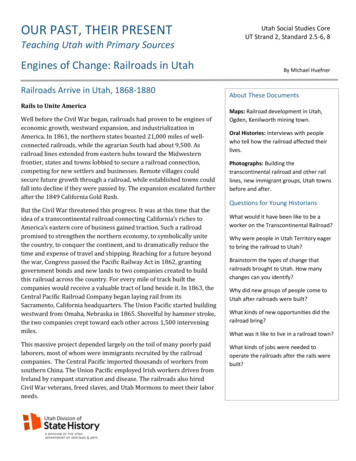
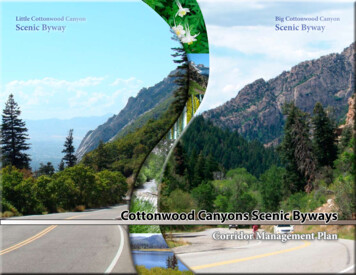
Utah’s Economic RegionsRegional centerSource: Kem C. Gardner Policy Institute2021 ECONOMIC REPORT TO THE GOVERNORv
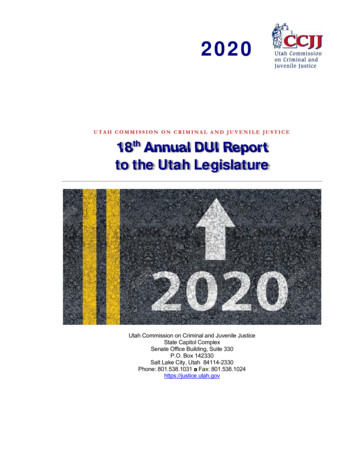
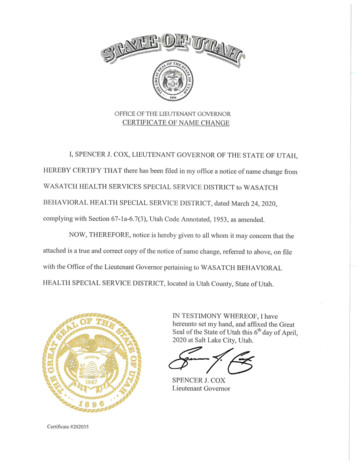
Economic Indicators for Utah and the United States, December 2020UNITS2018ACTUAL2019ACTUALPERCENT CHANGE2020ESTIMATE2021FORECAST18 -1919 - 2020 - 210.3%0.3%1.8%DEMOGRAPHICSU.S. July 1st PopulationMillions327328329335Utah July 1st %Utah Net MigrationThousands23.22525.3257.8%1.2%-1.2%Utah %U.S. Nonfarm Employment (BLS)Millions148.9150.9142.6147.41.3%-5.5%3.4%U.S. Unemployment Rate (BLS)Percent3.9%3.7%8.2%6.4%EMPLOYMENT AND WAGESU.S. Total Nonfarm Wages (BLS)Billion Dollars8,8949,3099,2869,8414.7%-0.2%6.0%U.S. Average Annual Pay S. Personal Income (BEA)Billion Dollars17,85218,55219,91719,4313.9%7.4%-2.4%Utah Nonfarm Employment h Unemployment Rate (DWS)Percent3.1%2.6%4.9%4.0%Utah Total Nonfarm Wages (DWS)Million Dollars72,27077,40082,02088,5207.1%6.0%7.9%Utah Average Annual Pay (DWS)DollarsUtah Personal Income (BEA)Million 156,896170,732173,4135.8%8.8%1.6%PRODUCTION AND SALESU.S. Real Gross Domestic ProductBillion Chained 201218,68819,09218,41519,0912.2%-3.5%3.7%U.S. Real ExportsBillion Chained 20122,5502,5472,2342,456-0.1%-12.3%9.9%U.S. Retail SalesBillion Dollars6,0056,2166,1906,6173.5%-0.4%6.9%Utah Exports (NAICS, Census)Million Dollars14,39017,33917,63820,05220.5%1.7%13.7%Utah All Taxable SalesMillion Dollars64,96368,92372,89477,4756.1%5.8%6.3%REAL ESTATE AND CONSTRUCTIONU.S. Private Residential InvestmentBillion Dollars7988078709341.1%7.8%7.4%U.S. Nonresidential StructuresBillion Dollars6316505875633.0%-9.7%-4.1%U.S. Purchase-only Home Price Index1991Q1 1002602732893065.0%5.9%5.9%Utah Dwelling Unit -2.4%Utah Residential Permit ValueMillion Dollars5,1525,8006,3306,15012.6%9.1%-2.8%Utah Nonresidential Permit ValueMillion Dollars2,1662,5962,3342,00019.9%-10.1%-14.3%Utah Purchase-only Home Price Index1991Q1 1004725075585887.4%10.1%5.4% Per Barrel64.957.038.746.0-12.2%-32.1%18.9%ENERGY PRODUCTION AND PRICESWest Texas Intermediate Crude OilUtah Coal ProductionMillion Tons13.814.313.514.53.6%-5.6%7.4%Utah Coal Prices Per Short Ton36.338.036.035.04.7%-5.3%-2.8%Utah Crude Oil ProductionMillion Barrels37.136.93233.5-0.5%-13.3%4.7%Utah Oil Prices Per Barrel56.948.333.037.0-15.1%-31.7%12.1%Utah Natural Gas Production SalesBillion Cubic Feet250218190185-12.8%-12.8%-2.6%Utah Natural Gas Prices Per MCF2.772.522.75-9.7%-20.0%37.5%Utah Copper Mined ProductionMillion Pounds466410330380-12.0%-19.5%15.2%Utah Copper Prices Per Pound32.552.62.9-15.0%2.0%11.5%2.0%1.2%2.7%PRICES, INFLATION, AND INTEREST RATESU.S. CPI Urban Consumers1982-84 100251256259266U.S. Federal Funds RateEffective Rate1.832.160.380.1U.S. 3-Month Treasury BillsDiscount Rate1.942.060.370.1U.S. 10-Year Treasury NotesYield (%)2.912.140.850.930-Year Fixed Mortgage RatePercent4.543.943.183.09Sources: Utah Economic Council, State of Utah Revenue Assumptions Working Group, IHS Markit, U.S. Census Bureau, and Kem C. Gardner Policy Institute.vi2021 ECONOMIC REPORT TO THE GOVERNOR
Table of ContentsOverview . . . . . . . . . . . . . . . . . . . . . . . . . . . . . . . . . . . . . . . . . . . . . . . . . . . . . . . . . . . . . . . . . . . . . . . . . . . . . . . . . . . . . . . . . . . XIIIEconomic Indicators1. Demographics. . . . . . . . . . . . . . . . . . . . . . . . . . . . . . . . . . . . . . . . . . . . . . . . . . . . . . . . . . . . . . . . . . . . . . . . . . . . . . . . . . 12. Measuring Economic Diversity. . . . . . . . . . . . . . . . . . . . . . . . . . . . . . . . . . . . . . . . . . . . . . . . . . . . . . . . . . . . . . . . . . 313. Employment, Wages, and Labor Force. . . . . . . . . . . . . . . . . . . . . . . . . . . . . . . . . . . . . . . . . . . . . . . . . . . . . . . . . . . 354. Personal Income . . . . . . . . . . . . . . . . . . . . . . . . . . . . . . . . . . . . . . . . . . . . . . . . . . . . . . . . . . . . . . . . . . . . . . . . . . . . . . . 435. Gross Domestic Product by State . . . . . . . . . . . . . . . . . . . . . . . . . . . . . . . . . . . . . . . . . . . . . . . . . . . . . . . . . . . . . . . 496. Utah Taxable Sales . . . . . . . . . . . . . . . . . . . . . . . . . . . . . . . . . . . . . . . . . . . . . . . . . . . . . . . . . . . . . . . . . . . . . . . . . . . . . 537. Tax Collections. . . . . . . . . . . . . . . . . . . . . . . . . . . . . . . . . . . . . . . . . . . . . . . . . . . . . . . . . . . . . . . . . . . . . . . . . . . . . . . . . 578. Exports . . . . . . . . . . . . . . . . . . . . . . . . . . . . . . . . . . . . . . . . . . . . . . . . . . . . . . . . . . . . . . . . . . . . . . . . . . . . . . . . . . . . . . . . 639. Price Inflation and Cost of Living. . . . . . . . . . . . . . . . . . . . . . . . . . . . . . . . . . . . . . . . . . . . . . . . . . . . . . . . . . . . . . . . 7110. Social Indicators . . . . . . . . . . . . . . . . . . . . . . . . . . . . . . . . . . . . . . . . . . . . . . . . . . . . . . . . . . . . . . . . . . . . . . . . . . . . . . . 7511. Economic Development. . . . . . . . . . . . . . . . . . . . . . . . . . . . . . . . . . . . . . . . . . . . . . . . . . . . . . . . . . . . . . . . . . . . . . . . 7912. Public Education. . . . . . . . . . . . . . . . . . . . . . . . . . . . . . . . . . . . . . . . . . . . . . . . . . . . . . . . . . . . . . . . . . . . . . . . . . . . . . . 8313. Higher Education . . . . . . . . . . . . . . . . . . . . . . . . . . . . . . . . . . . . . . . . . . . . . . . . . . . . . . . . . . . . . . . . . . . . . . . . . . . . . . 99Industries14. Agriculture. . . . . . . . . . . . . . . . . . . . . . . . . . . . . . . . . . . . . . . . . . . . . . . . . . . . . . . . . . . . . . . . . . . . . . . . . . . . . . . . . . . .10915. Real Estate and Residential Construction. . . . . . . . . . . . . . . . . . . . . . . . . . . . . . . . . . . . . . . . . . . . . . . . . . . . . . . 11316. Nonresidential Construction. . . . . . . . . . . . . . . . . . . . . . . . . . . . . . . . . . . . . . . . . . . . . . . . . . . . . . . . . . . . . . . . . . . 11717. Energy. . . . . . . . . . . . . . . . . . . . . . . . . . . . . . . . . . . . . . . . . . . . . . . . . . . . . . . . . . . . . . . . . . . . . . . . . . . . . . . . . . . . . . . . 11918. Minerals. . . . . . . . . . . . . . . . . . . . . . . . . . . . . . . . . . . . . . . . . . . . . . . . . . . . . . . . . . . . . . . . . . . . . . . . . . . . . . . . . . . . . . 13119. Tourism and Travel. . . . . . . . . . . . . . . . . . . . . . . . . . . . . . . . . . . . . . . . . . . . . . . . . . . . . . . . . . . . . . . . . . . . . . . . . . . . 13520. Defense . . . . . . . . . . . . . . . . . . . . . . . . . . . . . . . . . . . . . . . . . . . . . . . . . . . . . . . . . . . . . . . . . . . . . . . . . . . . . . . . . . . . . . 13921. Health Care. . . . . . . . . . . . . . . . . . . . . . . . . . . . . . . . . . . . . . . . . . . . . . . . . . . . . . . . . . . . . . . . . . . . . . . . . . . . . . . . . . . 14522. Economic Regions . . . . . . . . . . . . . . . . . . . . . . . . . . . . . . . . . . . . . . . . . . . . . . . . . . . . . . . . . . . . . . . . . . . . . . . . . . . . 15923. Nonprofit Sector. . . . . . . . . . . . . . . . . . . . . . . . . . . . . . . . . . . . . . . . . . . . . . . . . . . . . . . . . . . . . . . . . . . . . . . . . . . . . . 165FIGURESDemographics1.1 State of Utah Components of Population Change . . . . . . . . . . . . . . . . . . . . . . . . . . . . . . . . . . . . . . . . . . . . . . . 31.2 Utah Population Growth by County: 2019-2020 . . . . . . . . . . . . . . . . . . . . . . . . . . . . . . . . . . . . . . . . . . . . . . . . . 31.3 U.S. Dependency Ratios: 1970-2060. . . . . . . . . . . . . . . . . . . . . . . . . . . . . . . . . . . . . . . . . . . . . . . . . . . . . . . . . . . . . 41.4 Utah Dependency Ratios: 1970-2060. . . . . . . . . . . . . . . . . . . . . . . . . . . . . . . . . . . . . . . . . . . . . . . . . . . . . . . . . . . . 41.5 Utah Population and Growth Projections by Decade: 2015-2065. . . . . . . . . . . . . . . . . . . . . . . . . . . . . . . . . 51.6 Annual Rate of Change: July 1, 2019 to July 1, 2020. . . . . . . . . . . . . . . . . . . . . . . . . . . . . . . . . . . . . . . . . . . . . . 51.7 Total Fertility for Utah and the United States . . . . . . . . . . . . . . . . . . . . . . . . . . . . . . . . . . . . . . . . . . . . . . . . . . . . 6Measuring Economic Diversity2.1 Hachman Index for States, 2019. . . . . . . . . . . . . . . . . . . . . . . . . . . . . . . . . . . . . . . . . . . . . . . . . . . . . . . . . . . . . . . .332.2 Hachman Index for Utah Counties, 2019 . . . . . . . . . . . . . . . . . . . . . . . . . . . . . . . . . . . . . . . . . . . . . . . . . . . . . . . 342021 ECONOMIC REPORT TO THE GOVERNORvii
Employment, Wages, and Labor Force3.1 Annual Average Job Growth Rate for Utah and the United States. . . . . . . . . . . . . . . . . . . . . . . . . . . . . . . .363.2 Year-over Annual Unemployment Rate for Utah and the United States. . . . . . . . . . . . . . . . . . . . . . . . . . 373.3 Utah Employment Comparison for Select Industries, Year-over change, April 2020 andOctober 2020. . . . . . . . . . . . . . . . . . . . . . . . . . . . . . . . . . . . . . . . . . . . . . . . . . . . . . . . . . . . . . . . . . . . . . . . . . . . . . . . . 373.4 Employment Percent Change by State, Year-over, April 2020. . . . . . . . . . . . . . . . . . . . . . . . . . . . . . . . . . . . 383.5 Utah Employment Percent Change by County, Year-over, April 2020. . . . . . . . . . . . . . . . . . . . . . . . . . . . . 39Personal Income4.1 Utah Per Capita Income as Percent of U.S. Per Capita Income. . . . . . . . . . . . . . . . . . . . . . . . . . . . . . . . . . . . 454.2 Utah vs. U.S. Total Personal Income Growth. . . . . . . . . . . . . . . . . . . . . . . . . . . . . . . . . . . . . . . . . . . . . . . . . . . . . 45Gross Domestic Product by State5.1 Percent of Gross Domestic Product by Industry, 2019. . . . . . . . . . . . . . . . . . . . . . . . . . . . . . . . . . . . . . . . . . . 505.2 Utah vs. United States Real Gross Domestic Product Growth. . . . . . . . . . . . . . . . . . . . . . . . . . . . . . . . . . . . 50Utah Taxable Sales6.1 Percent Change in Utah Taxable Sales by Component . . . . . . . . . . . . . . . . . . . . . . . . . . . . . . . . . . . . . . . . . . 55Tax Collections7.1 Unrestricted General and Education Fund Revenues. . . . . . . . . . . . . . . . . . . . . . . . . . . . . . . . . . . . . . . . . . . . 597.2 Actual and Inflation-Adjusted Unrestricted Revenues. . . . . . . . . . . . . . . . . . . . . . . . . . . . . . . . . . . . . . . . . . . 597.3 Sales and Use Taxes, Income Tax, and All Other Unrestricted Revenues. . . . . . . . . . . . . . . . . . . . . . . . . . 60Exports8.1 Utah Merchandise Exports. . . . . . . . . . . . . . . . . . . . . . . . . . . . . . . . . . . . . . . . . . . . . . . . . . . . . . . . . . . . . . . . . . . . . 658.2 Utah Merchandise Exports of Top Ten Export Industries. . . . . . . . . . . . . . . . . . . . . . . . . . . . . . . . . . . . . . . . . 658.3 Utah Merchandise Exports to Top Ten Purchasing Countries . . . . . . . . . . . . . . . . . . . . . . . . . . . . . . . . . . . . 668.4 Utah Monthly Exports: With and Without Gold . . . . . . . . . . . . . . . . . . . . . . . . . . . . . . . . . . . . . . . . . . . . . . . . . 66Price Inflation and Cost of Living9.1 Cumulative Percent Change in Consumer Price Index (CPI) this Decade . . . . . . . . . . . . . . . . . . . . . . . . . 729.2 Consumer Price Index (CPI) Year-over-Year Price Change and Relative Value of a Dollar. . . . . . . . . . . 72Social Indicators10.1 Share of Population Age 25 Years or Older with a Bachelor’s Degree or Higher, 2003-2018 . . . . . . . 77Economic Development11.1 Economic Development Project Summary . . . . . . . . . . . . . . . . . . . . . . . . . . . . . . . . . . . . . . . . . . . . . . . . . . . . . 8211.2 Economic Development Tax Incentive Fund Project Summary . . . . . . . . . . . . . . . . . . . . . . . . . . . . . . . . . . 82Public Education12.1 Utah Public Education Enrollment, FY 1985–FY 2022 . . . . . . . . . . . . . . . . . . . . . . . . . . . . . . . . . . . . . . . . . . . 8512.2 Percent Change in Public Education Enrollment, FY 1985–FY 2022. . . . . . . . . . . . . . . . . . . . . . . . . . . . . . 8512.3 Largest Enrollment by District, FY 2021. . . . . . . . . . . . . . . . . . . . . . . . . . . . . . . . . . . . . . . . . . . . . . . . . . . . . . . . . 8612.4 Largest Enrollment Growth by District, FY 2020–FY 2021. . . . . . . . . . . . . . . . . . . . . . . . . . . . . . . . . . . . . . . . 8612.5 Kindergarten Enrollment and Five Years Prior Births, 2000–2021 . . . . . . . . . . . . . . . . . . . . . . . . . . . . . . . . 8712.6 U.S. FY 2019 Projection and Utah Current Expenditures per Pupil in Enrollment, FY 2002–FY 2020. . 8712.7 Current Expenditures per Pupil, by State FY 2017. . . . . . . . . . . . . . . . . . . . . . . . . . . . . . . . . . . . . . . . . . . . . . . 8812.8 Current Expenditures as a Percentage of Personal Income, by State FY 2017. . . . . . . . . . . . . . . . . . . . . 8812.9 Utah Total Enrollment and Current Expenditures per Pupil by District, FY 2019. . . . . . . . . . . . . . . . . . .89viii2021 ECONOMIC REPORT TO THE GOVERNOR
Agriculture14.1 Average Annual Price Received in Major Utah Agriculture Sectors. . . . . . . . . . . . . . . . . . . . . . . . . . . . . . 11114.2 Farmers’ Share of Food Spending . . . . . . . . . . . . . . . . . . . . . . . . . . . . . . . . . . . . . . . . . . . . . . . . . . . . . . . . . . . . . 111Energy17.1 Utah’s Crude Oil Production, Pipeline Imports, and Refinery Plotted with Wellhead Price,2000-2020 . . . . . . . . . . . . . . . . . . . . . . . . . . . . . . . . . . . . . . . . . . . . . . . . . . . . . . . . . . . . . . . . . . . . . . . . . . . . . . . . . . . 12417.2 Utah’s Petroleum Product Production and Consumption. . . . . . . . . . . . . . . . . . . . . . . . . . . . . . . . . . . . . . . 125.17.3 Utah’s Natural Gas Production and Consumption. . . . . . . . . . . . . . . . . . . . . . . . . . . . . . . . . . . . . . . . . . . . . . 12617.4 Utah’s Coal Production, Consumption, and Exports. . . . . . . . . . . . . . . . . . . . . . . . . . . . . . . . . . . . . . . . . . . . 12617.5 Utah’s Electricity Net Generation and Consumption . . . . . . . . . . . . . . . . . . . . . . . . . . . . . . . . . . . . . . . . . . . 129Minerals18.1 Total Value of Utah’s Annual Metallic and Industrial Mineral Production . . . . . . . . . . . . . . . . . . . . . . . . 13318.2 Value of Utah’s Annual Base Metal Production. . . . . . . . . . . . . . . . . . . . . . . . . . . . . . . . . . . . . . . . . . . . . . . . . 13318.3 Value of Utah’s Annual Precious Metal Production. . . . . . . . . . . . . . . . . . . . . . . . . . . . . . . . . . . . . . . . . . . . . 13418.4 Value of Utah’s Annual Industrial Mineral Production. . . . . . . . . . . . . . . . . . . . . . . . . . . . . . . . . . . . . . . . . . 134Tourism and Travel19.1 Accommodations Taxable Sales, 2010-2019. . . . . . . . . . . . . . . . . . . . . . . . . . . . . . . . . . . . . . . . . . . . . . . . . . . 13619.2 Utah National Park and Skier Visits, 1983-2019. . . . . . . . . . . . . . . . . . . . . . . . . . . . . . . . . . . . . . . . . . . . . . . . . 136Defense20.1 Military and Federal Civilian Defense Employment in Utah, 1990-2019. . . . . . . . . . . . . . . . . . . . . . . . . 14020.2 Defense Share of Total Employment in Utah, 1990-2019 . . . . . . . . . . . . . . . . . . . . . . . . . . . . . . . . . . . . . . . 14120.3 Compensation per Utah Job, Defense versus Non-Defense, 1990-2019. . . . . . . . . . . . . . . . . . . . . . . . . 14120.4 Total DoD and VA Prime Contracts and Grants Performed in Utah, 2005-2019 . . . . . . . . . . . . . . . . . . 142Health Care21.1 Utah’s Scores on America’s Health Rankings Categories, 2020. . . . . . . . . . . . . . . . . . . . . . . . . . . . . . . . . . 14821.2 Share of Utah Students Grades 9-12 Who Are Overweight or Obese, 1999 vs. 2019. . . . . . . . . . . . . . 14821.3 Utah COVID-19 Cases by Age and Gender, December 1, 2020. . . . . . . . . . . . . . . . . . . . . . . . . . . . . . . . . . 14921.4 Share of Hospitalized COVID-19 Cases in Utah with Pre-Existing Health Conditions. . . . . . . . . . . . . 14921.5 Utah COVID-19 Hospitalization Rate Per 1,000 Cases by Race and Ethnicity, December 1, 2020. . 15021.6 Utah COVID-19 Cases per 1,000,000 Population by State, December 1, 2020 . . . . . . . . . . . . . . . . . . . 15021.7 Percent of Utah’s Population with Health Insurance by Coverage Type, 2019. . . . . . . . . . . . . . . . . . . . 15121.8 Utah Uninsured Rates Age 18 or Older by Race and Ethnicity, 2017-2019 Average. . . . . . . . . . . . . . 15121.9 Utah Uninsured Rates Among Children by Race and Ethnicity, 2019 . . . . . . . . . . . . . . . . . . . . . . . . . . . 15221.10 Utah Life Expectancy by Race and Ethnicity, 2014-2018 Average. . . . . . . . . . . . . . . . . . . . . . . . . . . . . . 152Economic Regions22.1 Utah’s Economic Regions. . . . . . . . . . . . . . . . . . . . . . . . . . . . . . . . . . . . . . . . . . . . . . . . . . . . . . . . . . . . . . . . . . . . . 161Nonprofit Sector23.1 Number of Utah Tax Exempt Nonprofit Organizations . . . . . . . . . . . . . . . . . . . . . . . . . . . . . . . . . . . . . . . . . 16723.2 Utah’s Nonprofit Sector by Combined Revenues, Income, and Assets. . . . . . . . . . . . . . . . . . . . . . . . . . . 16723.3 Utah Tax Exempt Nonprofit Organization Assets. . . . . . . . . . . . . . . . . . . . . . . . . . . . . . . . . . . . . . . . . . . . . . . 16823.4 Utah’s Nonprofit Sector by Income Group. . . . . . . . . . . . . . . . . . . . . . . . . . . . . . . . . . . . . . . . . . . . . . . . . . . . . 16823.5 Utah’s Nonprofit Sector by IRS Subsection Designation. . . . . . . . . . . . . . . . . . . . . . . . . . . . . . . . . . . . . . . . 16923.6 Utah’s Nonprofit Sector by NTEE Codes. . . . . . . . . . . . . . . . . . . . . . . . . . . . . . . . . . . . . . . . . . . . . . . . . . . . . . . 1692021 ECONOMIC REPORT TO THE GOVERNORix
TABLESDemographics1.1 Utah Population Estimates by Components of Change . . . . . . . . . . . . . . . . . . . . . . . . . . . . . . . . . . . . . . . . . . 71.2 Utah Population Projections by Components of Change. . . . . . . . . . . . . . . . . . . . . . . . . . . . . . . . . . . . . . . . . 81.3 Utah Demographic Projections by Selected Age Groups. . . . . . . . . . . . . . . . . . . . . . . . . . . . . . . . . . . . . . . . . 91.4 Utah Population Estimates by County. . . . . . . . . . . . . . . . . . . . . . . . . . . . . . . . . . . . . . . . . . . . . . . . . . . . . . . . . . 101.5 U.S. Census Bureau National and State Population Estimates. . . . . . . . . . . . . . . . . . . . . . . . . . . . . . . . . . . . 111.6 Rankings of States by Selected Age Groups as a Percent of Total Population: July 1, 2019 . . . . . . . . 121.7 Dependency Ratios by State: July 1, 2019 . . . . . . . . . . . . . . . . . . . . . . . . . . . . . . . . . . . . . . . . . . . . . . . . . . . . . . 141.8 Total Fertility Rates for Utah and the United States. . . . . . . . . . . . . . . . . . . . . . . . . . . . . . . . . . . . . . . . . . . . . . 151.9 Components of Population Change Annual Rates: July 1, 2019 to July 1, 2020. . . . . . . . . . . . . . . . . . . 161.10 Housing Units, Households, and Persons Per Household by State . . . . . . . . . . . . . . . . . . . . . . . . . . . . . . . 171.11 County Population by Race and Ethnicity in Utah: July 1, 2019. . . . . . . . . . . . . . . . . . . . . . . . . . . . . . . . . . 181.12 Total Population by City. . . . . . . . . . . . . . . . . . . . . . . . . . . . . . . . . . . . . . . . . . . . . . . . . . . . . . . . . . . . . . . . . . . . . . . 191.13 Utah Demographic Projections by Race and Ethnicity . . . . . . . . . . . . . . . . . . . . . . . . . . . . . . . . . . . . . . . . . . 30Employment, Wages, and Labor Force3.1 Utah Nonfarm Employment and Unemployment Rate, and Labor Force Participation Rate. . . . . . . 403.2 Utah Labor Force, Nonfarm Jobs, and Wages. . . . . . . . . . . . . . . . . . . . . . . . . . . . . . . . . . . . . . . . . . . . . . . . . . . 413.3 Utah’s Largest Employers, Annual Average Employment 2019. . . . . . . . . . . . . . . . . . . . . . . . . . . . . . . . . . . 42Personal Income4.1 Total and Per Capita Personal Income. . . . . . . . . . . . . . . . . . . . . . . . . . . . . . . . . . . . . . . . . . . . . . . . . . . . . . . . . . 464.2 Per Capita Personal Income by County. . . . . . . . . . . . . . . . . . . . . . . . . . . . . . . . . . . . . . . . . . . . . . . . . . . . . . . . . 47Gross Domestic Product by State5.1 Nominal Gross Domestic Product (GDP) by State. . . . . . . . . . . . . . . . . . . . . . . . . . . . . . . . . . . . . . . . . . . . . . . 515.2 Real Gross Domestic Product (GDP) by State . . . . . . . . . . . . . . . . . . . . . . . . . . . . . . . . . . . . . . . . . . . . . . . . . . . 52Utah Taxable Sales6.1 Utah Taxable Sales by Component. . . . . . . . . . . . . . . . . . . . . . . . . . . . . . . . . . . . . . . . . . . . . . . . . . . . . . . . . . . . . 556.2 Utah Taxable Sales by County. . . . . . . . . . . . . . . . . . . . . . . . . . . . . . . . . . . . . . . . . . . . . . . . . . . . . . . . . . . . . . . . . . 56State Tax Collections7.1 Fiscal Year Revenue Collections (Millions of Current Dollars). . . . . . . . . . . . . . . . . . . . . . . . . . . . . . . . . . . . .617.2 Fiscal Year Revenue Collections (Annual Percent Change). . . . . . . . . . . . . . . . . . . . . . . . . . . . . . . . . . . . . . . 62Exports8.1 U.S. Merchandise Exports by State . . . . . . . . . . . . . . . . . . . . . . . . . . . . . . . . . . . . . . . . . . . . . . . . . . . . . . . . . . . . . 678.2 Utah Merchandise Exports by Industry. . . . . . . . . . . . . . . . . . . . . . . . . . . . . . . . . . . . . . . . . . . . . . . . . . . . . . . . . 688.3 Utah Merchandise Exports by Pu
Visit the Kem C. Gardner Policy Institute's website at www.gardner.utah.edu for a digital version of this report. Suggestions and Comments The Utah Economic Council encourages . Utah Coal Prices Per Short Ton 36.3 38.0 36.0 35.0 4.7% -5.3% -2.8%. 2021 ECONOMIC REPORT TO THE GOVERNOR . 2021 ECONOMIC REPORT TO THE GOVERNOR. 2021 ECONOMIC .