Transcription
Survival Analysis using SASRajeev KumarDivya VarkeyFisheries Center, UBC,VancouverEmail: r.kumar AT live.comFisheries Center, UBC,VancouverEmail: d.varkey AT live.comVancouver SAS Users Group meetingMay 30th, 2012
Outline What is Survival Analysis Data description Univariate Analysis Kaplan-Meier method Survival curve and log-rank test Multivariate Analysis Cox Proportional Hazard (PH) model Model selection PH assumption Modelling: time-dependent covariates30-May-2012VanSUG2
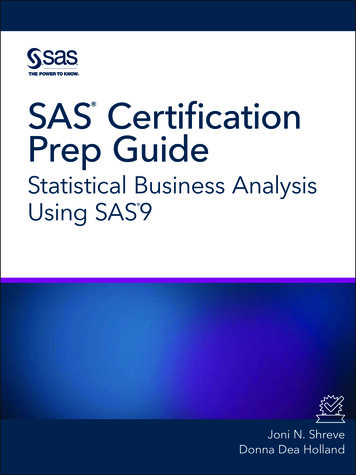
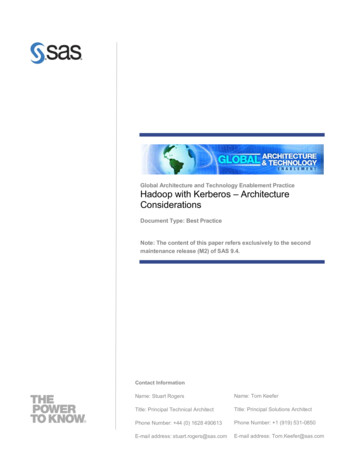
Introduction: dealing with time-event data Censored values makes the analysis complex right censor is most commonEnd of studyDAAPatientsLADADLD30-May-2012VanSUG3
Data description: myeloma, 65 patientsproc print data myeloma (where (ranuni(1) .15));run;Source : Krall et al. (1975); published in Biometrics (Vol. 31, No 1, pp. 49-57)30-May-2012VanSUG4
Survival probability and hazard rate Kaplan-Meier (K-M) survival probability𝑑𝑡 𝑆𝑡 (𝑆𝑡 1 ) (1 )𝑛𝑡 Hazard rate: risk of failure at time t 𝑃(𝑡 𝑇 𝑡 𝑡 𝑇 𝑡λ𝑡 lim 𝑡 0 𝑡30-May-2012VanSUG5
SAS: commonly used approach Proc lifetest: Proc phreg: Proc lifereg: for left, right, uncensored it has options for define distribution for survival time (suchas exponential, gamma, weibull, normal etc.)30-May-2012VanSUG6
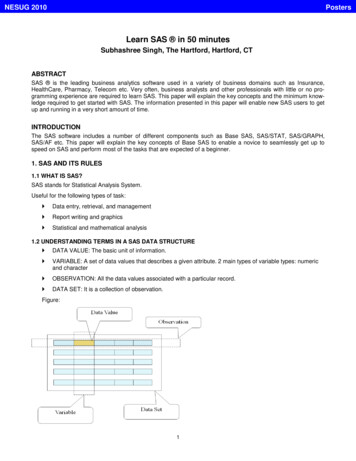
Univariate analysis: proc lifetestproc format;value sex 1 "M" 2 "F";value platelet 0 "Abnornmal" 1 "Normal";value fracture 0 "No" 1 "Yes";value infection 0 "No" 1 "Yes";value logbun low - 1.5 " 1.5"1.5 - 2.0 "1.5-2.0" 2 - high " 2";value hgblow - 10 " 10"10 - high " 10";value logpbm low - 1.5 " 1.5" 1.5 - high " 1.5";value agelow - 50 " 50"50 - 60 "50-60" 60 - high " 60";run;proclifetestlifetestdata myelomadata myelomaplots s;proclifetestdata myelomaplots sprocplots s(test(test);cl atrisk);time time*alive dead(0);strata logbun;format logbun logbun.;run;30-May-2012VanSUG7
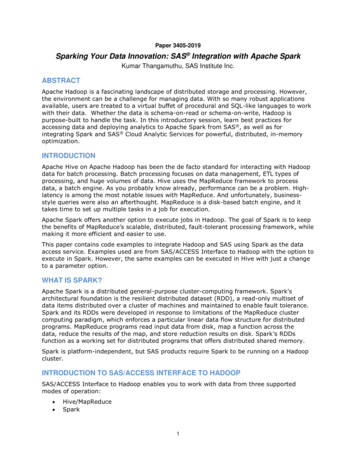
Contd.proc lifetest data myeloma plots (s lls);time time*alive dead(0);strata hgb;format hgb hgb.;run;30-May-2012VanSUG8
Univariate analysis: K-M curve30-May-2012VanSUG9
K-M curve contd.30-May-2012VanSUG10
Multivariate analysis30-May-2012VanSUG11
Cox proportional hazards regressionmodel ℎ 𝑡 𝑋 ℎ0 𝑡 exp(𝑋1 𝛽1 𝑋2 𝛽2 𝑋𝑛 𝛽𝑛 )Baseline hazardExponential parto Base line hazard: function of timeo Exponential part: time independent𝑒𝑠𝑡. ℎ 𝑡 𝑋1 1𝐻𝑎𝑧𝑎𝑟𝑑 𝑅𝑎𝑡𝑖𝑜 𝐻𝑅 𝑒𝑠𝑡. ℎ(𝑡 𝑋1 0 )o PH assumption: hazard between group is proportional over timeo Proportionality constant is time independent30-May-2012VanSUG12
Cox proportional hazard modelproc phreg data myeloma;format sex sex. platelet platelet.fracture fracture. infection infection.;class sex (ref "M") platelet (ref "Normal")infection (ref "No") ;fracture (ref "No")model time*alive dead (0) sex platelet fracture infection age logpbmlogbun hgb / ties efron ;run;30-May-201213
Model SelectionBackward elimination Forward selection Stepwise Finally we use BIC or AIC values for determiningbest model30-May-2012VanSUG14
Model selection contd.proc phreg data myeloma;format sex sex. platelet platelet. fracture fracture.infection infection.;class sex (ref "M") platelet (ref "Normal") fracture(ref "No") infection (ref "No") ;model time*alive dead (0) sex platelet fracture infectionage logpbm logbun hgb / ties efronselection s slentry 0.2 slstay 0.05 ;run;CriterionWithout CovLogBUNLogBUN HGB LogBUN HGB Infection-2 LOG 12VanSUG15
Ph AssumptionKolmogorov-Type Supremum Test for Proportional Hazardsproc phreg data myeloma;model time*alive dead (0) logbun hgb;assess ph/resample;run;30-May-2012VanSUG16
PH assumption contd.proc phreg data myeloma;model time*alive dead (0) logbunlogbunT logbun*log(time);*phtest: test logbunT;run;30-May-2012hgb logbunT;VanSUG17
Time-dependent covariateproc phreg data myeloma;logtime log(time);model time*alive dead (0) logbun hgb logbun*logtime/risklimits;hazardratio 'logBUN' logbun / at(logtime 0,1.7917,2.4849,3.1780,3.5835,3.8712) cl both;run;30-May-2012VanSUG18
The analysis shown in this presentation is only fortutorial purpose.30-May-2012VanSUG19
What is Survival Analysis Data description Univariate Analysis Kaplan-Meier method Survival curve and log-rank test Multivariate Analysis Cox Proportional Hazard (PH) model Model selection PH assumption Modelling: time-dependent covariates 30-May-2012 VanSUG 2


![[ST] Survival Analysis - Stata](/img/33/st.jpg)