Transcription
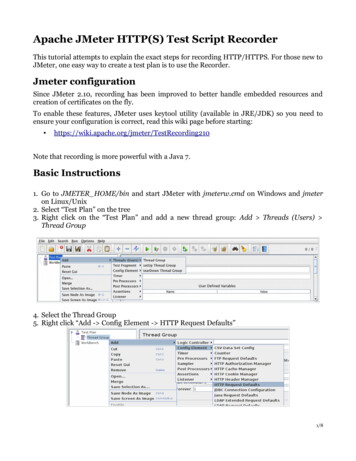
Apache JMeter HTTP(S) Test Script RecorderThis tutorial attempts to explain the exact steps for recording HTTP/HTTPS. For those new toJMeter, one easy way to create a test plan is to use the Recorder.Jmeter configurationSince JMeter 2.10, recording has been improved to better handle embedded resources andcreation of certificates on the fly.To enable these features, JMeter uses keytool utility (available in JRE/JDK) so you need toensure your configuration is correct, read this wiki page before starting: e that recording is more powerful with a Java 7.Basic Instructions1. Go to JMETER HOME/bin and start JMeter with jmeterw.cmd on Windows and jmeteron Linux/Unix2. Select “Test Plan” on the tree3. Right click on the “Test Plan” and add a new thread group: Add Threads (Users) Thread Group4. Select the Thread Group5. Right click “Add - Config Element - HTTP Request Defaults”1/8
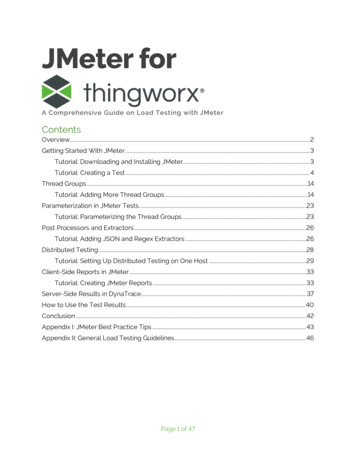
6. In new HTTP Request Defaults element: Server name – enter “jmeter.apache.org”7. Path – leave blank8. Right click on the “Thread Group” and add a recording controller: Add Logic Controller Recording Controller9. Next, select WorkBench10. Right click on WorkBench and add the recorder: Add - Non-Test Elements - HTTP(S)Test Script Recorder2/8
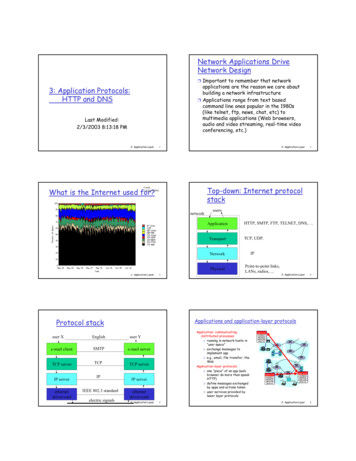
11. On HTTP(S) Test Script Recorder, click the “Add” button in “URL Patterns to Include”.This will create a blank entry; enter “.*\.html”.12.Right click on “HTTP(S) Test Script Recorder” and add a listener: Add - Listener - ViewResults Tree3/8
13. Return to HTTP(S) Test Script Recorder, and click the “Start” button at the bottom.This will start the JMeter proxy server which is used to intercept the browser requests.A file called ApacheJMeterTemporaryRootCA.crt will be generated in jmeter/bin folder.Install this certificate in your browser, if you don't know how to do it, read “Installing theJMeter CA certificate for HTTPS recording” in : http://jmeter.apache.org/usermanual/component reference.html#HTTP%28S%29 Test Script RecorderConfigure your browser to use the JMeter ProxyAt this point, JMeter's proxy is running. For this exercise, we will use Iceweasel/Firefox toview some pages on the JMeter website.13. Start Iceweasel/Firefox, but do not close JMeter.14. From the tool bar, click “Edit - Preferences” (or “Tools Preferences”). This should bringup the options.15. Select the “Advanced” tab, and “Network” tab16. Click “Settings” button near the bottom.4/8
17. On the new pop-up, check “Manual proxy configuration”. The address and port fieldsshould be enabled now.18. Address – enter “localhost” or the IP address of your system19. Port – enter “8080”.20. Check “Use this proxy server for all protocols”21. Click “OK” button22. Click “OK” button again. This should return you to the browserRecord your navigation23. With your browser, in the “Address” bar at the top, enter5/8
“http://jmeter.apache.org/index.html” and hit the “enter” key.24. Click on a few links on JMeter's pages.25. Close your browser and bring up the JMeter window.Expand the thread group and there should be several samplers. At this point, the test plan canbe saved as is. If you forget to add default HTTP Request settings, you will have to manuallydelete the server name, and port.In this sample, there aren't any default request parameters. If a particular request parameteris required by all pages, the request defaults is where one would add the entries.25. Select “Thread Group”26. Right click “Add - Listener - Summary Report” to add an summary listener.27.The summary listener will show some basic statistics.6/8
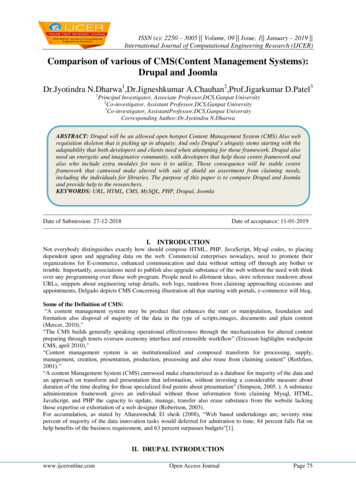
27. Select “Thread Group”28. Number of Threads – enter “5”29. Ramp up Period – do not change30. Loop Count – enter 100Start the testAt this point, we are ready to run our test plan and see what happens. Save the test plan.When you're ready to run the test, there's two ways:1. Run - Start2. Ctrl–RBefore you start the test, select “Summary Report”. As the test runs, the statistics will changeuntil the test is done. At the end of the test, the summary report should look like this.7/8
While the test is running, in the upper right-hand corner, there should be a green square.When the test is done, the box should be grey.8/8
6.In new HTTP Request Defaults element: Server name - enter "jmeter.apache.org" 7.Path - leave blank 8.Right click on the "Thread Group" and add a recording controller: Add Logic Controller Recording Controller 9.Next, select WorkBench 10. Right click on WorkBench and add the recorder: Add - Non-Test Elements - HTTP(S)