Transcription
City of Niagara FallsComprehensive Review ReportFinancial Restructuring Boardfor Local GovernmentsJune 19, 2017
City of Niagara FallsTable of ContentsTable of Contents . 2Overview . 3Background . 3Fiscal Eligibility and Stress . 3Demographic and Socioeconomic Profile . 4Organization and Finances . 5Organizational Profile . 5Budget Profile . 7Findings and Recommendations . 11Shared Services. 11Efficiencies. 18Workforce . 25Economic Development . 30Fiscal Performance and Accountability . 32Conclusion and Next Steps . 33Appendix A – Letter and Resolution from the City of Niagara Falls . 34Appendix B – Resolution Approving the City of Niagara Falls . 36Financial Restructuring Board for Local Governments2
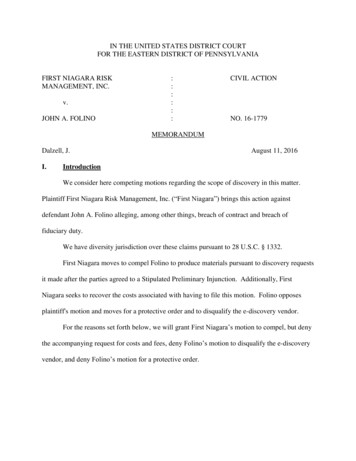
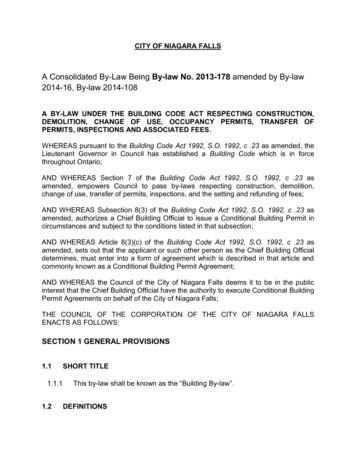
City of Niagara FallsOverviewThe City of Niagara Falls is a medium Upstate city in Niagara County. With a population of 50,193as of the 2010 Census, it is the 11th most populous city in New York State.* 2015 expendituresof 131.4 million were the 9th highest of all cities.The City Council adopted and the Mayor concurred with a resolution requesting a ComprehensiveReview by the Financial Restructuring Board (see Appendix A). On June 20, 2016, the FinancialRestructuring Board approved this request for a Comprehensive Review with Resolution No.2016-09 (see Appendix B).This Comprehensive Review first gives some background on the City's fiscal eligibility anddemographic profile. It then provides information on the organization and finances of the City.Finally, it presents the Comprehensive Review's findings and recommendations.BackgroundFiscal Eligibility and StressThe City of Niagara Falls is automatically considered a Fiscally Eligible Municipality because itsAverage Full Value Property Tax Rate (2010-2014) of 20.143 per 1,000 is above 7.167 per 1,000 – the 75th percentile for all municipalities. This is the 4th highest for cities.The City’s Average Fund Balance Percentage (2010-2014) of 15.95 percent is well above the fivepercent threshold and was aided by a large retroactive payment owed from the Seneca Nation.Average Full Value Property Tax Rate 25.00Average Fund Balance Percentage25% 20.14 20.0020% 15.0015% 10.00 11.04Automatically Eligible Above 7.16715.95%10% 5.005% 0.000%Niagara Falls19.78%All Cities (Median)Automatically Eligible Below 5%Niagara FallsAll Cities (Median)The Office of the State Comptroller's (OSC) Fiscal Stress Monitoring System gives the City ofNiagara Falls a Fiscal Rating of “Susceptible to Fiscal Stress” with a score of 47.9 percent for2015 (a local government would be determined to be Susceptible to Fiscal Stress with a score of45.0 percent or higher). The negative factors contributing to this score include a low fund balance,an operating deficit in two of the last three fiscal years, low cash levels as a percentage of netcurrent liabilities, and low cash levels as a percentage of monthly expenditures. OSC projects thatthe City's score will increase in 2016 to 70.0 percent, moving to “Significant Fiscal Stress.”Financial Restructuring Board for Local Governments3
City of Niagara FallsOSC's Fiscal Stress Monitoring System gives the City of Niagara Falls an Environmental Ratingof "Moderate Environmental Stress" with a score of 48.8 percent for 2015 (a local governmentwould receive a designation with a score of 30.0 percent or higher). Negative environmentalfactors contributing to this score include: a decrease in population from 2000 to 2010 (-9.7percent), a high child poverty rate in 2010 (30.4 percent), an increase in the child poverty ratefrom 2000 to 2010 (0.04 percent), low property value per capita in 2015 ( 28,573), and a highunemployment rate in 2014 (8.5 percent).Demographic and Socioeconomic ProfilePopulation ChangeThe City's population decreased by 9.7 percent to 50,193 from2000 to 2010. In contrast, the typical city's population grew 0.5percent over that same period.2000: 55,593The City of Niagara Falls' median household income in 2014was 33,009, which is less than the typical city's medianhousehold income of 40,111.9.7%2010: 50,193The City's median home value of 67,600 is less than themedian home value of the typical city of 108,300. Its four-yearaverage change in property value was 1.4 percent, and, as noted above, its property value per50,193capita in 2015 was 28,573. The City's unemployment rate is 8.5 percent,2010:and itschild povertyrate is 30.4 percent.Financial Restructuring Board for Local Governments4
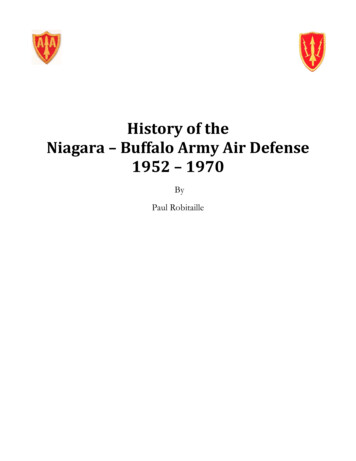
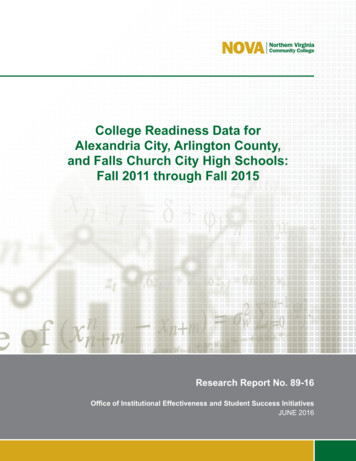
City of Niagara FallsOrganization and FinancesOrganizational ProfileThe City of Niagara Falls is governed by a Mayor and a five-member Common Council. The Mayoris elected citywide for a four-year term, expiring December 31, 2019. The Council is also electedcitywide for staggered four-year terms.The City has several primarydepartments including: Fire,Police,CommunityDevelopment,HumanResources, Code ring,Assessment, Parks & PublicWorks,andManagementInformation Services. Additionalemployees perform variousadministrative and managementfunctions, including the CityClerk, the City Controller, andthe City’s Corporation Counsel.City of Niagara Falls Full-Time 12%CityController204%All Other49.59%Police17632%Public Works13425%For 2016, the City's budgetfinanced approximately 544FTEs. From 2006 to 2016, totalFTEs rose by 67.5, an increase of 14.5 percent, with the biggest increases in Police (17.3percent), Fire (16.1 percent), and Public Works (22.9 percent). However, the total level hasremained relatively stable since 2010. One main reason for the sizeable increase in the latter partof the 2000s was due to the casino operation, as the City was reacting to the change anddetermining what they believed to be the appropriate areas in each applicable department. Asdetailed in the chart above, the City Police Department has the most full-time employees at 176,followed by the Fire Department at 144.Several unions represent the City's unionized workforce, with various contract terms and salaryincreases. Recently, the City settled with the Uniformed Firefighters Association (for years 2014- 2026), Niagara Falls Fire Department Officers Association (for years 2014 - 2024), Niagara FallsPolice Club (for years 2015 - 2018), and the Police Captains and Lieutenants Association (foryears 2014 - 2024). See the table on the next page for a summary of of COLAs by unit through2019.As a result of these new deals, all new hires within these units now have a 15 percent contributionto the health insurance plan and co-pays for prescriptions, doctor and specialist visits, andemergency room visits have all increased. Employees hired after January 1, 2008, but before themost recently negotiated contracts, contribute five percent toward the cost of their single or familyhealth insurance coverage, while earlier hires have no required contribution. Regardless of theFinancial Restructuring Board for Local Governments5
City of Niagara Fallsnewest negotiated contracts, for the 2017 adopted budget, only 1.1 percent of the total employeehealth benefit costs are expected to be paid from its employees.City of Niagara Falls Labor Contracts% Salary 0152016201720182019Uniformed FirefightersAssociation, Local 714Current12/31/20262.0*1.00.00.02.02.02.0Niagara Falls Fire Dept.OfficersAssociation,Local ice Captains andLieutenants Assoc.Niagara County BuildingTrades CouncilUnitedSteelworkersLocal 9434-00*One percent increase in July and one percent increase at the end of DecemberEmployee Health Insurance Cost SharingCity 435,65198.3%Employee 7,5661.7%Total 443,217- 3,719,72098.7% 48,6791.3% 3,768,399-Fire BrassCost Share 791,329100.0% 00.0% 791,329-FirefightersCost Share 1,591,75498.5% 23,6561.5% 1,615,410-Police BrassCost Share 397,460100.0% 00.0% 397,460-Police OfficersCost Share 2,084,44399.1% 22,7881.1% 2,104,231-All Active EmployeesCost Share 9,020,35798.9% 102,6911.1% 9,123,048-ExemptCost ShareCivil Service and HourlyCost ShareFinancial Restructuring Board for Local Governments6
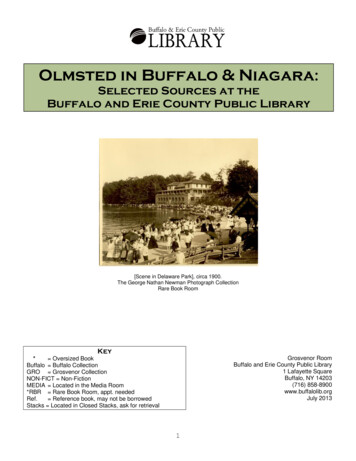
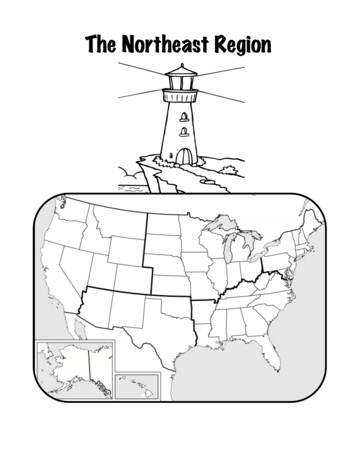
City of Niagara FallsBudget ProfileThe City's 2017 all funds adopted budget totals 106.2 million. This is a 3.8 percent increase fromthe adopted 2016 budget. Of this amount, the 2017 General Fund totals just under 91.0 million,an increase of 1.6 million, or 1.8 percent over 2016. Within the General Fund, the largestexpenditure category is for police, at 19.5 million (21.4 percent of General Fund expenditures),followed by public works at 17.1 million (18.8 percent of General Fund expenditures), and fire(17.2 percent of General Fund Expenditures).2017 City of Niagara Falls ExpendituresPublic Works andParks 17.07 M16%Fire 15.66 M15%All Other 7.95 M8%Police 19.53 M18%General Fund 90.4 M85%Other 5.80 M5%Employee FringeTransfer to Pension (ERS & BenefitsDebt ServicePFRS) 18.50 M 5.95 M 8.42 M17%6%8%Debt Service 7.85 M7%The below chart details the recent trend in General Fund expenditures since 2013, showing that,since fiscal year 2014, to the credit of the Mayor and City Council, spending has been heldpredominantly flat.General Fund Expenditures, City of Niagara Falls( in millions)ItemPolicePublic Works and ParksFireRetiree MedicalPension (ERS and PRRS)Transfer to Debt ServiceOther2013 17.9 15.4 16.2 6.8 6.5 6.4 13.22014 19.8 16.3 17.7 7.4 7.2 6.4 14.82015 18.6 15.7 16.2 8.4 7.7 6.3 13.82016 18.9 16.6 15.6 8.7 8.0 6.5 14.42017 19.5 17.1 15.7 8.9 8.4 6.0 15.4Total 82.4 89.6 86.7 88.8 91.0Financial Restructuring Board for Local Governments7
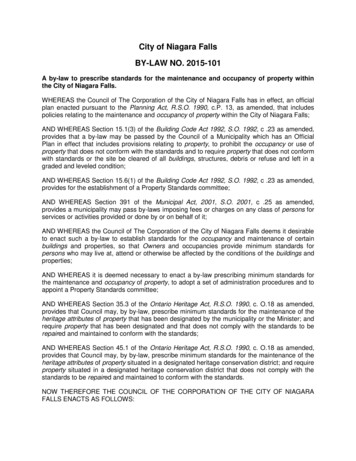
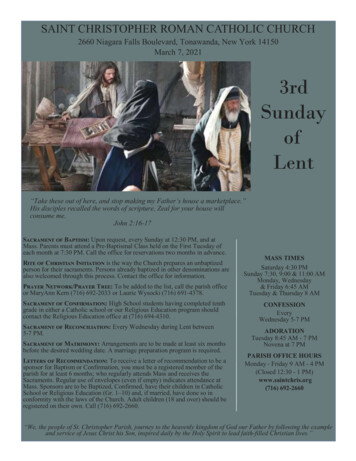
City of Niagara FallsThe 2017 General Fund revenuesources include: 37.0 percent fromproperty tax; 21.0 percent fromState aid; 20.0 percent from nonproperty taxes; and, approximately12.0 percent from the casino. Theproperty tax levy is 33.6 million –about a 2.5 percent increase over2016.2017 City of Niagara Falls RevenuesAll OtherSources 8.90 M10%Casino 10.98 M12%Property Tax, 33.63 M,37%According to the City’s auditedNon-Propertyfinancial statements for the fiscalTax 18.30 Myear ending December 31, 2015,State Aid,20% 19.09 M,Niagara Falls exhausted 79.421%percent of its Constitutional tax limit.As of that time, a margin of 6.9million remained. In nominal terms,real property tax revenue (excludingPILOTs and other payments) has grown a modest 1.1 million between 2013 and the adopted2017 budget. This low growth has been aided by a consistent and growing use of casino proceedsby the General Fund.As noted, the City’s second largest General Fund revenue is State aid. In total, the 2017 budgetanticipates State support of 19.1 million. The overwhelming majority of that amount ( 17.8million) comes from the Aid and Incentives to Municipalities (AIM) program. Within the nonproperty tax category, sales tax and hotel/ restaurant/ utility tax revenues account for the largestamounts.As discussed in this Comprehensive Review, the City has relied on a portion of its casino-relatedrevenues from the Seneca Gaming Compact agreement with the State to make capitalinvestments, and has therefore been able to avoid issuing debt for general improvements inrecent years. Except for a 2014 refunding, the City last entered the bond market for generalimprovements in 2011, issuing 7.4 million. Applying casino proceeds to make generalinvestments in the City has allowed Niagara Falls to avoid interest payments, reduce thepercentage of Constitutional debt limit it has exhausted, and fund much of its capital on a pay-asyou go basis.In October 2016, Moody's Investors Service affirmed the City's Baa2 rating on its outstandinggeneral obligation bonds. In keeping the outlook stable, Moody's noted: "The underlying Baa2rating incorporates the City's modest tax base with below average wealth and income levels,recent deterioration in available fund balance, and an elevated debt burden. The rating alsoincorporates the City's reliance on economically sensitive revenues." A Moody's Baa2 rating istwo 'notches' above non-investment (or junk bond) grade.Financial Restructuring Board for Local Governments8
City of Niagara FallsCasino Proceeds – Background and UsesOn June 1, 2001 the Seneca Nation of Indians and the State of New York entered into aMemorandum of Understanding for the operation of a Class III exclusive gaming operationcompact. The compact was dated April 12, 2002 and had a 14-year term.A renewal of the extension of the compact was extended on July 6, 2016 and is effective untilDecember 31, 2023. The newly extended agreement provides that a minimum of 25 percent ofthe net drop from electronic gaming devices shall be distributed to the host municipality, the Cityof Niagara Falls.Per State law, allocations are drawn off the top for Niagara Falls Memorial Hospital, Niagara FallsSchool District, Niagara Tourism and Convention Center, Niagara Frontier TransportationAuthority, and the Niagara Falls Underground Railroad Commission, while the balance (73.5percent) remains with the City.According to City budgets and financial statements, the City has been applying those funds toexisting debt service, an economic development contract with Empire State DevelopmentCorporation, and the General Fund to offset certain lost property taxes associated with theSeneca Niagara Casino. Any unused casino funds, as well as any that have been designated forspecific purposes but not yet actually expended, flow to the City's Miscellaneous Special RevenueFund (MSRF).The City's adopted 2017 budget anticipates 11.0 million in casino proceeds, 1.5 million lessthan the 12.5 million contained in the City's adopted 2016 budget. The amount of casinorevenues actually realized by the City since 2013 has varied dramatically, a function of ebbs andflows in release of funds by the Seneca Nation and the State. In 2013, the City reported actualrevenues of 22.8 million, which included multiple back-years of payment that had been held updue to a dispute between the Seneca Nation and the State.The City has sought to use casino proceeds to avoid issuing debt. This has resulted in substantialcost avoidance over the life of the compact.Of importance, as of late March 2017, the Seneca Nation has made initial claims that they believethe gaming compact allows them to halt revenue payments to the State (and, by extension, alllocalities) after 2016. Given the City of Niagara Falls' reliance on casino proceeds for its GeneralFund budget, the Board will monitor this issue and situation in cooperation with City officials.Financial Restructuring Board for Local Governments9
City of Niagara FallsBudgetary GapsOver the past six completed fiscal years, the total fund balance of the City’s General Fund hasdecreased from 24.7 million to 10.6 million, a 57.1 percent reduction. Niagara Falls’ adoptedbudget for 2017 appears balanced, based on the revenue and expenditure assumptionscontained therein. However, the City continues to face structural deficit challenges.Since 2013, the City has budgeted prior year fund balance to close its budget every year but one.And in that one year (2016), its casino revenue was budgeted to increase by approximately 5.4million, offsetting the need for a fund balance appropriation. The reliance of the recent Citybudgets on fund balance to achieve balance, as well as other pertinent fiscal trends, is as follows.City of Niagara Falls Fiscal Trends( in millions)Total General Fund BudgetProperty Tax RevenueAnnual Casino Proceeds AvailableCasino Proceeds Budgeted for GFExcess Proceeds for Special Revenue (Capital) FundAvailable Fund Balance - GFAdditional GF Balance Used for BudgetAvailable Fund Balance - Special Revenue Fund* Not available at the time2013 98.9 28.1 66.5 22.5 44.0 12.1 2.0 44.02014 81.7 28.1 13.7 6.6 7.1 3.6 4.4 31.02015 83.8 29.0 12.5 7.5 5.0 5.1 4.9 28.02016 88.8 28.7 12.3 12.5 0 2.6 0 25.02017 91.0 29.7 12.1 11.0 1.1* 2.5*Fiscal Summary TakeawaysThe City's tax levy has been stable over the last few years as the City has used more casinoproceeds to balance the General Fund. However, the City’s blended (homestead/non-homestead)property tax rate is close to 21 per 1000, which is one of the highest rates for all cities – areflection of the poverty and lower home values in the City.The City is concerned about the steady decline of their net casino proceeds. For 2016 and 2017,the City used all or nearly all of the total net casino proceeds from each year to balance theGeneral Fund, and for 2017, the City had to apply additional General Fund Balance for budgetbalancing.The available General Fund balance at the end of 2016 was less than three percent of the GeneralFund budget (approximately 2.5 million). However, the City still has ample casino proceedssaved in its Miscellaneous Special Revenue Fund (estimated at about 25 million at the end of2016). This fund is typically used to pay for capital projects and other needs.Overall, the General Fund has become heavily reliant on casino proceeds. If the City's annualcasino receipts continue to fall, officials will have to develop new savings plans to reduce overallspending and reliance on casino revenues. This Comprehensive Review highlights a number ofopportunities the City may undertake as its expenses continue to rise and casino receiptspotentially fall.Financial Restructuring Board for Local Governments10
City of Niagara FallsFindings and RecommendationsAfter a thorough review of the City's operations, the Board identifies findings andrecommendations in the following areas: shared services, efficiencies, workforce, economicdevelopment, and fiscal performance and accountability.Shared ServicesRegional Government ContextAs of the 2010 Census,Niagara County had apopulation of 216,469 andwas the 13th most populouscounty out of the 57 countiesoutside of New York City.With a land area of 522.4square miles, it is the 41stlargest county. With apopulation density of 414residents per square mile, it isthe 12th most denselypopulated county.The County is governed by a15-memberCountyLegislature with an include: the Treasurer, the Sheriff, the District Attorney, the Clerk, and four Coroners. As of 2015,the County had total expenditures of 400.4 million, which is the 13th highest for counties, andtotal expenditures per capita of 1,850, which is the 37th highest for counties.Within the County, there are 3 cities, 12 towns, 5 villages, 10 school districts, 2 fire districts, 3libraries, and nearly 100 town special districts and other entities.The City of Niagara Falls is in the southwestern corner of the County, and is predominantlysurrounded by the Towns of Niagara and Wheatfield in Niagara County.Survey of Shared ServicesThe Board procured the services of the Center for Governmental Research (CGR) to conduct asurvey on general functions of the City and neighboring municipalities to ascertain duplication ofservices and potential areas for further consolidation. The City and its surrounding governmentswere asked to briefly describe current shared service arrangements in each service/function areaand to identify any obstacles or opportunities for additional shared services.Below is a summary of the results identifying which services are provided by each municipalentity:Financial Restructuring Board for Local Governments11
City of Niagara FallsIndex of Municipal Services bulance/EMSTax Collection/TreasurerTax Bill PrintingTax ForeclosureAssessingPersonnel/HR/Civil ServicePayroll/Time & AttendancePurchasingBudget/FinanceCode EnforcementBuilding/Zoning/PlanningPark MaintenanceAnimal ControlPlowingPaving/Street MaintenanceLighting/Traffic y araFalls CitySchoolDistrictTown ofLewistonTown XXXXXXXXXXXXXXXXXXXXShared Services Actions and OpportunitiesA local government’s primary responsibility is to deliver services for the benefit and well-being ofits residents. As the above chart aptly displays, there is significant duplication of services amongthe City of Niagara Falls and its neighboring municipalities.If the City of Niagara Falls is to address future budget challenges, it must maximize availablesavings from pursuing and implementing a new shared services plan with its governmentalpartners. An effective plan will not only enable the City to reduce its cost structure going forward,but should also help partnering governments to reduce their costs as well.In addition to the current shared service efforts between the City and its governmental neighbors,other opportunities exist which may allow Niagara Falls to lower its current cost structure forexisting services, enable future job attrition without exact refilling of current staff levels (presentingsavings opportunities to both the City and the governmental partner it so engages with to shareFinancial Restructuring Board for Local Governments12
City of Niagara Fallsthe service), and allow the City and its neighboring government the opportunity to receive grantsand assistance from the State via a number of programmatic options.Consolidate Emergency Dispatch with CountyThe City operates its own emergency communications (911) service, meaning that it serves asthe official public safety answering point (PSAP) and dispatch entity for all emergency calls thatoriginate from landlines within the City.The function is essentially split between the City’s Police and Fire Departments, with staffallocated from each department (and the costs of those staff shared between the two departmentswithin the City’s General Fund). The 2017 budget includes funding for 17 full- and part-timepositions to support the emergency communications function, including 12 within the PoliceDepartment (a communications technician, senior communications technician, 5 dispatchers and5 complaint report technicians) and 5 within the Fire Department (all of whom are fire alarmoperators).The City’s emergency communications system has a salary budget of 1.6 million in 2017. Thatfigure does not include any capital upgrades that may be required to maintain or improve thesystem in 2017 or beyond.An analysis of data provided by the Police and Fire Departments suggests that the City’semergency communications system processes approximately 50,000 to 55,000 calls per year, ormore than 140 per day on average. To handle that call volume, at any given time the dispatchsystem is staffed by one to two call takers (who receive the initial call), one fire dispatcher (towhom fire calls are handed off) and one police dispatcher (to whom police calls are handed off).At the same time, Niagara County also operates its own PSAP and emergency dispatch system.Administered by the County Sheriff’s Office, it is the primary PSAP for all 911 calls from landlinesthat originate in Niagara County except for those originating in the cities of Niagara Falls andLockport. For calls that originate via cellphone, the County serves as the primary PSAP for everyjurisdiction – including the cities of Niagara Falls and Lockport. The agencies the Countydispatches for include: The County Sheriff’s Office;The City of North Tonawanda;Municipal police departments in the Town of Niagara, and the Villages of Lewiston,Youngston, Barker and Middleport;Twenty-eight volunteer fire companies; and,Two volunteer ambulance services.The County’s emergency communications budget for 2017 is 3.0 million, and provides for 35full- and part-time staff (25 full-time dispatchers, six part-time dispatchers, three seniordispatchers and an emergency communications director), which is roughly twice the size of theCity’s dispatch staff. In 2015, the County received 343,767 telephone calls (a daily average of942) and dispatched 161,031 calls (a daily average of 441). The dispatch volume is roughly threetimes that of the City of Niagara Falls.Financial Restructuring Board for Local Governments13
City of Niagara FallsAs the County’s E911 cost center is included in its General Fund, taxpayers underwrite it throughtheir general county taxes. This includes City of Niagara Falls taxpayers, who also underwrite thecost of the City’s emergency communications system.Notably, the City of North Tonawanda consolidated its emergency dispatch function with NiagaraCounty’s in 2012-13. Under the original five-year contract, the City of North Tonawanda was topay a declining amount of the cost and save a total of 1.7 million. The merger was supported bya 400,000 Local Government Efficiency Grant from the State. Part of the motivation for thatconsolidation, beyond direct savings, was the ability for the City of North Tonawanda to avoidfuture capital investment costs associated with necessary upgrades to its dispatch system.The City of Niagara Falls could explore consolidating its emergency communications system withthe County. This would eliminate duplication in capital equipment, operations staffing andadministrative requirements, and would further streamline the PSAP framework within NiagaraCounty. The actual structure of such a City-County service consolidation would require moredetailed analysis, but there are two potentially viable options: First, the City could combine its emergency communications system within the County’saccording to the model used by the City of North Tonawanda five years ago. Under themodel, the City would fully transfer the function and pay the County a declining cost overa period of years, until the function was fully merged. It is worth noting that the Countyindicates its system has expansion capability. Second, the City and County could pursue a shared E911 service, recognizing that theyare the two largest emergency dispatch services in the community today. Such apartnership model currently exists in Monroe County, where the County and City ofRochester effectively co-own the emergency dispatch system, with City and Countypersonnel, equipment and facilities blended into a jointly owned and operated system thatserves the entire county.Determining the potential impact of such a consolidation would require a more detailed analysis,as well as a comparison of possible structural models.Operating an emergency communications system requires certain threshold investments,including administrative personnel, operations staff, facilities and technology. Operating multiplesuch systems requires those investments be duplicated. Such is the case between the City andCounty today.While a full consolidation of the two operations would not completely eliminate the City’s current 1.6 million salary appropriation, migrating to a single staffing / administrative framework andunified technology platform would almost certainly reduce those costs. Moreover, beyond theoperating budget, emergency communications systems can be subject to costly maintenance andupgrade costs over time. It would be inherently more cost effective to make investments in asingle system than in two.Combining the resources currently allocated by the City and County within a unified emergencycommunications system would yield certain efficiencies. One example involves emergency callsthat originate from cellphones anywhere in Niagara County. At present, all of those calls go to theCounty’s PSAP, only to be transferred to the City PSAP. And within the City’s PSAP, they areFinancial Restructuring Board for Local Governments14
City of Niagara Fallstaken by a call-taker who then hands off the call to either the police or fire dispatcher. Suchhandoffs can build additional time into an emergency response where seconds are critical.Combine Civil Service with CountyThe City maintains and funds its own civil service function based in the Human ResourcesDepartment. It is not the only municipality in the area to run its own civil service office – the Cityof Lockport also operates its own. However, Niagara County administers civil service for all othermunicipalities and school districts in the area. This role includes administering all applications andforms, job postings, competitive examinations, promotional examinations, recruitment
Niagara Falls Overview The City of Niagara Falls is a medium Upstate city in Niagara County. With a population of 50,193 as of the 2010 Census, it is the 11th most populous city in New York State.* 2015 expenditures of 131.4 million were the 9th highest of all cities.