Transcription
Office of Financial ManagementSTATE OF WASHINGTONLIFE CYCLE COST MODEL INSTRUCTIONSFacilities Oversight and Planning ProgramMarch 2022
CONTENTSPreface. 2Life Cycle Cost Model Overview . 3Software . 3Model Formatting . 3Sheet Descriptions . 3Instructions for Model . 6Entering Options – Project Information and Existing Lease . 6Entering Options – Lease Option 1 . 7Entering Options – Construction Option . 10Entering Options – Purchase Option . 13Summary . 14Assumptions. 17Methodology. 17Glossary . 181 Page
PREFACELife cycle cost analysis is a projection of initial and ongoing costs of ownership or leasing andoperations for a facility or site over its useful life. Life cycle cost analysis is used to determinethe relative economic cost of various alternatives so they can be compared. It is usually one ofmany factors considered when making a decision to lease or own property. These other factorsoften include the business need, availability of funding, schedule constraints, jurisdictional andcommunity interests.Washington law requires all proposed property acquisition projects, including leased andowned, greater than 20,000 sf to have a life cycle cost analysis performed, unless the expectedoccupancy of the proposed space is less than five years.Life cycle cost analysis can be very detailed and complex. The Life Cycle Cost Model (LCCM) wascreated to provide a simplified tool to help decide the most economical option for housingstate functions. Further analysis may be desired to have a more in-depth study of alternatives.Users can develop the analysis by providing basic information such as existing leaseinformation, proposed lease terms, location, square feet, construction or purchase projectcosts, and project completion dates. Additional information may be inputted in order to createa more customized option.The Office of Financial Management (OFM) has chosen to control many of the key financial andcost parameters in the tool to simplify the analysis and ensure that the results are comparablefor all projects. Refer to the assumptions section for a more detailed breakdown ofassumptions.2 Page
LIFE CYCLE COST MODEL OVERVIEWSOFTWAREThe life cycle cost analysis is performed by an Excel workbook. The Life Cycle Cost Model(LCCM) workbook is able to be used stand-alone from other workbooks. While there are links toother workbooks, such as in the Financial Assumptions tab, these will not prevent theworkbook from working properly.The version of Excel must be Excel 2007 or later. There are complex formulas, formatting,functions, and conditional formatting that will not work on earlier versions of Excel.MODEL FORMATTINGThe sheets are protected. You may input or change any cell that is green in any green tab(option inputs). All other cells may be looked at but cannot be changed. This is for transparencyof the calculations and default inputs.Any cell with an asterisk to the left of it must be inputted in order for that option to work. Allgreen cells in the workbook allow you to input data. If filled in, the data in the green cells will beused rather than the defaults if applicable.There are six input tabs (green) where data can be entered; Existing Lease, Lease Option 1,Lease Option 2, Ownership Option 1, Ownership Option 2, and Ownership Option 3. Thesummary tab (yellow) returns results for all options. The remaining tabs either containassumptions, data, or perform calculations.The workbook is setup to print as landscape on legal size paper (8.5” x 14”). The sheets havebeen print formatted for clarity of reading once printed.SHEET DESCRIPTIONSEXISTING LEASE SHEETThis sheet is where agency and project information along with existing leases are entered.LEASE OPTION 1 SHEETThis sheet is where agency and project information, existing leases, and new lease proposalsare entered. The sheet also projects the biennial budget impacts for any new lease incomparison to the existing lease. This information is not shown on the summary sheet as it is a3 Page
near-term outcome. However, this can be a useful near-term “existing to lease option”comparison.LEASE OPTION 2 SHEETThis sheet contains the inputs for a secondary lease option.OWNERSHIP OPTIONS 1, 2 & 3 SHEETSThese sheets contain the inputs for ownership options. These allow for input of a constructionproject or a facility purchase and renovation of an existing building. Additional ongoing buildingoperating costs are included.SUMMARY SHEETThis sheet summarizes the major information needed to distinguish options such as projectdescriptions, size, costs, and space use ratios. It also ranks the options based on the net presentvalue (what the total cost converted to today’s dollars).This sheet shows the results of the analysis for a user specified period and the state mandated30 and 50 year analysis periods. Additionally, the net present value chart of the options showsthe various options cross over time and when their costs intersect.Major financial assumptions are summarized on the bottom of this sheet.REMAINING SHEETSThe remaining tabs either contain assumptions, data, or perform calculations.Cash Flow – Calculates the cash flow and net present value of the options by month for 100years. It also calculates the year in which the options are a better economic value than theexisting lease (or if no existing lease the proposed lease).Discount Rate Sensitivity – Calculates the net present value of the options with discount ratesof 1% through 10%. It also generates charts to show how the discount rate affects the NPV ofthe option.Capital Construction Defaults – OFM set default values from construction, renovation projects,and industry estimating guides. The defaults in green cells can be adjusted.4 Page
Financial Assumptions – The Office of the State Treasurer sets the financial assumptions for theLCCM. This sheet is updated twice a year. Any life cycle cost analysis that uses differentnumbers from the Treasurer’s should be noted and explained.Market Rental Rate – This sheet list the State Facilities Oversight and Management estimatedfull service rental rates for all cities in Washington. This list is periodically updated to reflectmarket rate studies. This sheet also lists the combined state and local sales tax for each city asreported by the Department of Revenue.CPI-U – Inflation index as reported by Global Insight and OFM Forecasting.Operating Costs Table - This sheet is the operating costs for ongoing operations, maintenance,and managing of office buildings. The information is taken from the CBRE/Whitestone ResearchFacility Operations Cost Reference. This is a yearly publication. The rates used are for selectedmarket areas in Washington and the greater Portland market for Vancouver, Washington. Therates are costs per gross square foot.Lease Annual Operating Costs - This sheet is the annual operating costs for the selected city inthe Lease Inputs tab. The figures are escalated yearly from the data date year of theWhitestone report.Project Annual Operating Costs - This tab is similar to the Lease Annual Operating Costs tab,however, the rates are for the selected city in the Construction Option tab. This allows theconstruction and purchase options to take into consideration operating rates in a different citythan the current lease.5 Page
INSTRUCTIONS FOR MODELENTERING OPTIONS – PROJECT INFORMATION AND EXISTING LEASETo start a project, it is recommended that you save the excel file with a unique name describingthe analysis.Note: Any cell with an asterisk to the left of it must be inputted in order for that option to work.All green cells in the workbook allow you to input data. If filled in, the data in the green cellswill be used rather than the defaults if applicable.1. Open the Existing Lease sheet.2. Enter the following information (required information in bold below is noted withasterisks * on the spreadsheet): Agency Project Title Project Description Date of Analysis – This is the date the LCCM scenario is run. Years of Analysis (optional) – This allows you to run an analysis for a specifiedperiod in addition to the standard 30 and 50 year periods.3. Next enter in the Current Lease Information. This can be found on the executed lease.There is room for up to six existing leases. If there is no existing lease then leave thefollowing section blank. Existing Square Feet - This is usually in rentable square feet. Lease start date Lease end date Lease rate per month – rate listed on lease6 Page
Additional operating costs / month – services such as utilities, custodial,recycling, etc., that the tenant is responsible for paying.FTE’s Relocating – enter the number of people who work at this location whowould be relocatingENTERING OPTIONS – LEASE OPTION 11. Open the Existing Lease sheet.2. Enter New Lease Option 1 Description.3. Next enter in the New Lease Information. Lease Location – Select a city from the pull-down list. Lease Square Feet Type – Select either gross or rentable from the pull-down list New Facility Square Feet – Enter the size of the new lease New Lease Start Date – Enter the date that the new lease begins7 Page
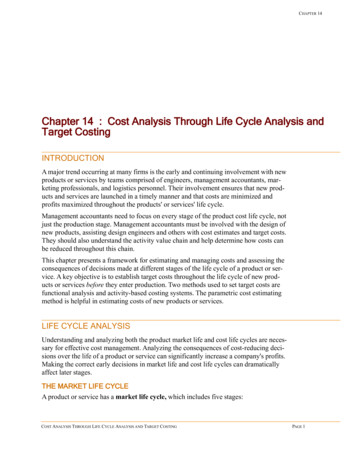
4. New Lease Costs – This section allows you to enter the length and rate of the leaseterms. If no lease terms are input the model will use the estimated lease rates for thecity.Most leases will have a 5 year fixed rate, however, some leases are negotiated with stepincreases. For instance, a 10 year lease with a rate increase in years 6 – 10 would beentered as shown below:After the last year specified in the New Lease Costs section, the lease rate will becalculated by escalating the last rate by inflation. This rate renews and escalates everyfive years thereafter.5. Real Estate Transaction Rates – Only input different commission rates for the real estatetransaction if they have been negotiated outside of the standard rate. The commissionrates shown are the standard Department of Enterprise Services rates.6. New Lease Operating Costs – This section allows you to account for services that are notincluded in the lease but will be paid for by the agency.To add a service, check the box to the left of the service. This will automatically add inthe estimated cost per square foot per year. If you wish to override this cost with a8 Page
known service cost enter the cost in the Known Cost / SF / Year column. You must stillcheck the box on the left.7. New Lease One Time Costs – This section allows you to input the one-time costsassociated with moving into a new leased space. The calculated costs (in yellow) are forreference only and will not be added into the cash flow. If you want costs added into thecash flow you must enter them in the green boxes.If you need help in working up the individual costs, you may contact DES Real EstateServices or OFM State Facilities Oversight and Management.Biennium Budget Impacts for New LeaseThis section does not have any user inputs but displays the biennial budget impacts for thelease option 1 from the analysis start date biennium and continuing for 5 biennia.LEASE OPTION 2The Lease Option 2 sheet contains the same inputs as the Lease Inputs sheet.9 Page
ENTERING OPTIONS – OWNERSHIP OPTIONSThese sheets contain the inputs for an ownership project along with the ongoing buildingoperating costs. Many of the inputs on these sheets are similar to the Lease Inputs sheet.Additional information regarding the Capital Budget System and predesigns can be found at theOFM Capital Budget website: asp.Note: Any cell with an asterisk to the left of it must be inputted in order for that option to work.All green cells in the workbook allow you to input data. If filled in, the data in the green cellswill be used rather than the defaults if applicable.1. Enter the following information (required information in bold below is noted with asterisks* on the spreadsheet): Project Description Construction of Purchase/Remodel – Select from the pull-down list. Project Location – Select a city from the pull-down list. Gross Sq Ft – This is the total building area including exterior walls. Usable Sq Ft – This is the area of the building that is able to be used by thetenant. Move In Date – This is the date that the agency moves people into the building.The cash flow automatically assumes a two-month period for moving furnitureand other items into the building.The following items are automatically calculated based upon standard assumptions or userinputs further down the construction option sheet. Space EfficiencyEstimated Acres NeededMACC Cost per Sq FtEstimated Total Project Costs per Sq FtEscalated MACC Cost per Sq FtEscalated Total Project Costs per Sq Ft10 P a g e
2. If there is an interim lease (such as a temporary leased space during construction) enter thefollowing information. Lease Start Date Length of Lease (in months) Square Feet (holdover/temp lease) Lease Rate – Full Serviced ( / SF / Year) – see the Lease Input sheet for servicesthat might be included in the lease. One Time Costs (if double move) – see the Lease Input sheet for items thatwould be included in these category.3. Construction Cost Estimates Details – This section allows you to enter specific constructioncategory costs or use the generated costs. The inputs are based on the OFM Capital BudgetSystem (CBS) inputs. (For explanation of the CBS, refer to the CBS .11 P a g e
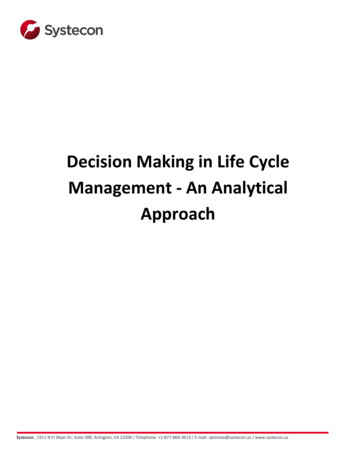
The model will automatically estimate costs for a typical state office building based uponstandard OFM assumptions for the size and location of the proposed building. Refer to theassumptions section for more detail.Values in green cells will be used rather than the estimated values. For instance, in theConstruction Contracts section a particular building site may require a more than normallevel of preparation. If this is entered then the total will reflect the amount in the Site Workcell. However, once an item is entered, the entire category must be filled in. In this case youmust also fill in Related Project Costs, if any, and Facility Construction costs.4. Construction One Time Project Costs – This section allows you to enter moving expensesand any other items that are not covered in the Construction Cost Estimate section.12 P a g e
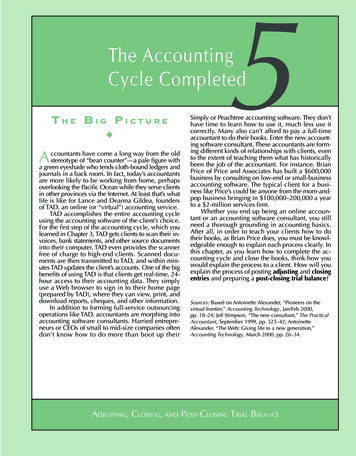
5. Ongoing Building Costs - This section allows you to account for services that are notincluded in the lease but will be paid for by the agency.To add a service, check the box to the left of the service. This will automatically add in theestimated cost per square foot per year. If you wish to override this cost with a knownservice cost enter the cost in the Known Cost / SF / Year column. You must still check thebox on the left.ENTERING OPTIONS – PURCHASE OPTIONThe major difference with a Purchased/Remodeled option may be the amount of AcquisitionCosts Total. This is where the initial purchase price of a facility would be entered. The A & E FeePercentage will be adjusted to the standard fee for remodel projects.The following shows how this type of project input could vary from a construction project.13 P a g e
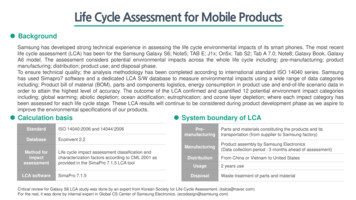
SUMMARYOnce all of your project information has been entered the results will be shown on theSummary sheet.This sheet summarizes the major information needed to distinguish options such as projectdescriptions, size, costs, and space use ratios. It also ranks the options based on the net presentvalue (the total cost converted to today’s dollars).This sheet shows the results of the analysis for a user specified period and the state mandated30 and 50 year analysis periods. Options can be displayed by selecting the Yes/No DisplayOption pull-down in green.14 P a g e
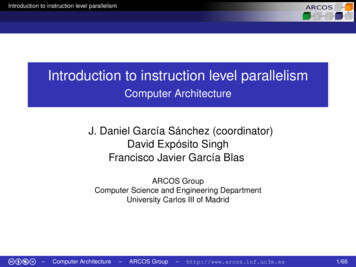
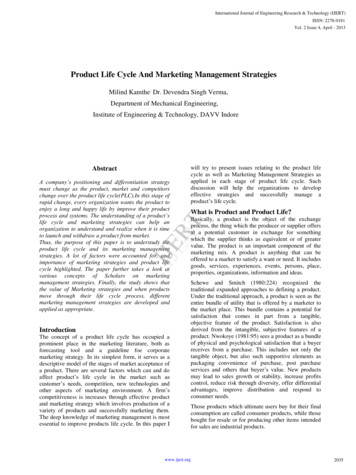
Additionally, the net present value chart shows the selected options cumulative cash outlayover time and when their costs intersect.15 P a g e
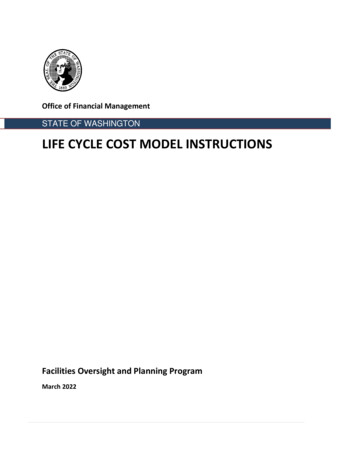
Also shown is the annual cash flow comparison chart.Major financial assumptions are summarized on the bottom of this sheet.16 P a g e
ASSUMPTIONSThe life cycle cost analysis can be very complex with multiple variables. In order to simplify theanalysis and ensure that the results are comparable for all projects OFM has chosen to controlmany of the key financial and cost parameters in the tool. In addition, OFM has supplied defaultconstruction numbers to allow a quick comparison of a typical office construction project withlease options. These assumptions can be found on the tabs named Capital ConstructionDefaults, Financial Assumptions, Market Rental Rate Table, and Operating Costs Table.The model allows most of the assumptions to be overridden with agency supplied numbers.However, the Financial Assumptions, such as the percentage rates for various financing optionsand the general inflation numbers, are provided by the Office of the Treasurer of WashingtonState and cannot be changed by the user.METHODOLOGYThe methodology of the life cycle cost analysis tool is based on cash flows for a specifiednumber of years. The cash flow may include ongoing lease rates, debt payments, operating andmaintenance costs, and one-time project costs. These individual costs are inflated to the yearwhen the cost is incurred. For instance, a payment on a debt for a construction project maybegin some years in the future, even though the project starts today.The total option spend for the period is then adjusted to a Net Present Value, or today’s valueof the money that is spent in future years. These net present values are then compared to eachother.17 P a g e
GLOSSARYThe following terms are used both in these instructions and in the Life Cycle Cost Model. Thedefinitions are how they are used within this context.63-20 Financing – A single-purpose nonprofit corporation is created in order to issue bonds.Using bond proceeds, the nonprofit funds the project and contracts with a developer for itsconstruction. The state then leases the completed building from the nonprofit. Debt service onthe bonds and other costs are covered by lease payments. At the end of the lease, whichcoincides with bond maturity, the state owns the building. For additional information refer tothe Washington State Treasurer’s report on 63-20 Capital Project 41AE-9279-3523D1BE0BAC/m58-63 20.aspx andthe State Finance Committee Guidelines For Use of 63-20 Financing s/sfc GuidlinesUse63-20FinancingContracts.pdf.A & E Fee – Architectural and Engineering Basic Services Fee – These design services includenormal architectural, structural, civil, mechanical, and electrical engineering services. Theseinclude the following phases of the project: schematic design, design development,construction documents, bidding, construction contract administration, and project closeout.For more information refer to the Guidelines for Determining Architect/Engineer Fees for PublicWorks Building Projects: idelines.pdfAnalysis Period – The set number of years for comparing alternatives. Input by the user or therequired 30 and 50-year periods.Annual Lease Cost – The cost per year for rental of a facility paid to the building owner. Thismay include services such as utilities if such are paid to the building owner. Services paid tothird parties are not included.Cash Flow – An expense stream over a given period.Certificate of Participation (COP) - In this type of real estate financing, the state leases propertyto a designated non-profit organization (without transferring ownership) and then makesperiodic payments to lease the property back over the life of the financing. Multiple financingsare often pooled together to achieve economies of scale in borrowing and issuance costs. COPsare not backed by the full faith and credit of the state. Instead, each agency pledges itsappropriation from the state, although some state agencies, particularly community andtechnical colleges, rely on revenue sources such as student fees that are not considered generalstate revenues to make payments. COPs are subject to non-appropriation risk and to acrossthe-board cuts authorized by the Governor. State real estate acquisitions financed with COPsmust be authorized by the Legislature, typically in the Capital Budget.Consumer Price Index (CPI) - A consumer price index measures a price change for a constantmarket basket of goods and services from one period to the next within the same city (or in theNation).18 P a g e
Cumulative Cash – The total amount spent over a period of time.COP Deferred – This option for a COP, as shown in the summary sheet, uses capitalization ofinterest during the construction of the building. The interest is adding back onto the principleand that amount is the adjusted debt. For additional information on capitalized interest referto; st.htmDiscount Rate - The discount rate reflects the time value of money. This should be theapproximate cost to the state for long-term debt (bonds).Full Service Cost – The cost of a lease that includes all services, such as utilities, garbage,custodial, etc.General Obligation Bond (GO Bond) - Bonds that have the full faith, credit and taxing power ofthe state irrevocably to the payment of the bonds. Borrowing costs on general obligationbonds are lower than costs for other types of state obligations.Gross Square Feet (GSF) – The total constructed area of a building is the sum of all spaces on allfloors of a building measured to the exterior enclosing walls.Inflation Rate – Rate of general inflation as set by the Office of the Treasurer of WashingtonState.I.T. Infrastructure – The physical information technology hardware required to interconnectcomputers and users. This may include wiring, I.T. trays, racks, etc.Market Rental Rate – Market lease rates at a specific point in time for major markets /submarkets to use with relocations and new space.Maximum Allowable Construction Cost (MACC) - The total sum available to the A/E forconstruction purposes, including all alternates. The MACC excludes Washington state sales tax,professional fees, project contingency funds, or other charges that may not be under the scopeof the architect (see Cost Estimate in Capital Budget System (CBS)).Net Present Value (NPV) - NPV compares the value of a dollar today to the value of that samedollar in the future, taking inflation and returns into account.Operating Costs – Cost to operate and maintain a facility. This may include energy, janitorial,utilities (water, sewer, and garbage), grounds, pest control, security, maintenance and repair,building management, road clearance, telecom, additional parking, among other items.Real Estate Transaction Fees – The commission fees charged for negotiating and executing alease.Rentable Square Feet (RSF) - The actual space occupied by the tenant agency, plus thebuilding’s shared facilities.19 P a g e
Space Efficiency – The usable square feet divided by the gross square feet.Total Project Costs (TPC) – the sum total of all costs associated with a project, includingacquisition, A & E fees, MACC, equipment, art work, project management, and other costs.Usable Square Feet (USF) - On a multi-tenant floor, usable area is the total size of the floor lesshallways, elevators, restrooms, etc. On a single tenant floor, usable area is the total size of thefloor less the building lobby, HVAC ducts, stairwells and elevators.20 P a g e
Financial Assumptions - The Office of the State Treasurer sets the financial assumptions for the LCCM. This sheet is updated twice a year. Any life cycle cost analysis that uses different numbers from the Treasurer's should be noted and explained. Market Rental Rate - This sheet list the State Facilities Oversight and Management estimated