Transcription
Life Cycle Cost EstimatingFactors for Cybersecurity inFederal IT Systems2021 Joint SW & IT Cost ForumSeptember 16, 2021 2021 PRICE Systems, L.L.C. All Rights Reserved 2021 PRICE Systems, L.L.C. All Rights Reserved1
Today’s PresenterRichard Mabe, PRICE Systems, LLCSolutions Consultant Over 45 years of operations analysis experience Air Force Officer; Civil service employee (Retired); Federalcontractor Specializing in logistics analysis and cost analysis for USgovernment programs Applies industry best-practices to estimate life cycle costsfor Software and IT systems Experience includes hands-on data collection, costestimating, and project management Holds a BS Degree in Geology from Boise State Universityand an MS in Logistics Management from AFITContact: richard.mabe@pricesystems.com; 856-651-8567 2021 PRICE Systems, L.L.C. All Rights Reserved2
Overview Background Scope Research Database Analysis Approach Current Results and Conclusions** Work in progress. Factors still evolving. 2021 PRICE Systems, L.L.C. All Rights Reserved3
Background PRICE Systems and the MITRE Corporation jointly researchedcybersecurity costs in 2019‒ PRICE researched factors to estimate cybersecurity costs in a general IT system‒ MITRE described analogous costs for IT systems focused only on cybersecurity‒ Presented results to the 2020 Joint SW & IT Cost Forum‒ Presented updated results to the 2021 ICEAA Workshop and a PRICE Webinar Peer reviews identified several areas requiring further research‒ Add sustainment costs/factors‒ Add DOD programs to the database‒ Conduct statistical validation/testing to prove the factors are useful‒ Also evaluate the factors with outliers removed from the database 2021 PRICE Systems, L.L.C. All Rights Reserved4
Scope This report provides an update on just the cost factorsresearched by PRICE‒ Methods to estimate the cost of cybersecurity in a general IT system‒ Open-source Cost, Budget and Technical data*‒ Cybersecurity cost categories informed by Mil-Std-881E, Appendix J (ITSystem Work Breakdown Structure for the DOD)‒ Normalized factors across federal agencies and programs*Unable to identify and incorporate open-source technical data; e.g,number of controls; HW or SW sizing; integration complexities 2021 PRICE Systems, L.L.C. All Rights Reserved5
Poll How much experience have you had with Cybersecurityprograms or methods?a.5 Yearsb.3 to 4 Yearsc.1 to 2 Yearsd.None 2021 PRICE Systems, L.L.C. All Rights Reserved
ResearchDatabase 2021 PRICE Systems, L.L.C. All Rights Reserved 2021 PRICE Systems, L.L.C. All Rights Reserved7
Data Source: OMB IT Dashboard* First launched June 1, 2009 Allows Federal agencies and the public to view details ofFederal information technology (IT) investments online andtrack their progress over time Includes data received from agency IT Portfolios andBusiness Case reports Agency Chief Information Officers (CIO) are responsible forevaluating and updating their data on a regular basis* https://www.itdashboard.gov/drupal/data/datafeeds 2021 PRICE Systems, L.L.C. All Rights Reserved8
Data Selection Extracted 31,358 IT Activities from the web site with associatedProgram Level budgets (Activity Report; Portfolio Report) Selected 2,473 cybersecurity related Activities for the analysis‒ Represent 237 IT Programs across 25 Executive Agencies‒ Used a structured keyword search to identify the cyber related activities;keywords included (acronym definitions in TIGremediation Finally, removed activities that were not actually cyber, or thathad both cyber and non-cyber effort‒ Included duplicate activities and activities with zero activity cost 2021 PRICE Systems, L.L.C. All Rights Reserved9
Final Activity Count 772 Cyber only Activities, across 181 IT Programs in 23Executive Agencies*‒ DOD programs fell out during the filtering process‒ But only initially included OSD level programs (no service level) Separated out 10% of the Activities to use for subsequent testand validation‒ Not part of the database used to develop the factors‒ 50 Dev activities 20 O&S activities* Most DOD IT programs in the OMB database had not yet reportedcybersecurity activities in their postings to the OMB Dashboard 2021 PRICE Systems, L.L.C. All Rights Reserved10
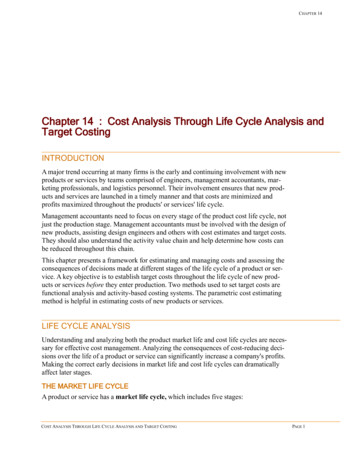
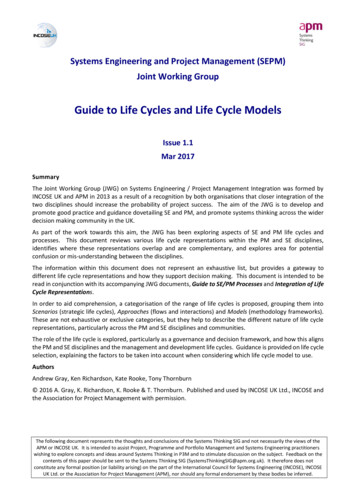
Development Activity CostsCybersecurity Activity Costs (479)Outliers potentially equal any value 6.0M ( 3.0 Std Dev from Mean) 2021 PRICE Systems, L.L.C. All Rights Reserved11
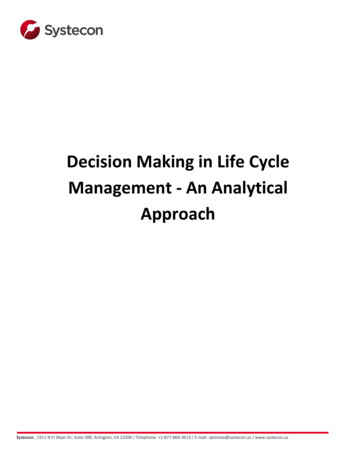
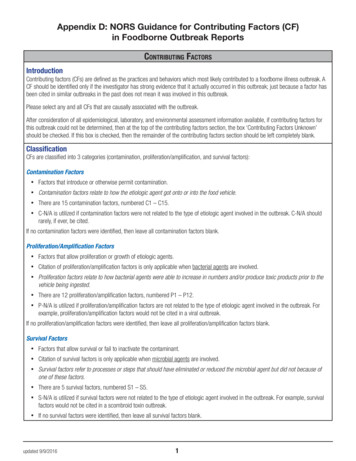
O&S Activity CostsCybersecurity Activity Costs (193)Outliers potentially equal any value 8.0M 2021 PRICE Systems, L.L.C. All Rights Reserved12
AnalysisApproach 2021 PRICE Systems, L.L.C. All Rights Reserved 2021 PRICE Systems, L.L.C. All Rights Reserved13
Process Checked for correlation of Activity costs within agencies orbetween agencies‒ No significant correlation identified‒ Spending for cybersecurity activities varied widely by Executive Agency, ITProgram, and Activity‒ Cybersecurity pending appeared to be random (unique per individualprogram) Evaluated data to identify Benchmarks or Factors to use forestimating‒ Cyber Factor: Cyber X% of other Program Expenditures Benchmarks/Factors organized by Cyber Cost Category 2021 PRICE Systems, L.L.C. All Rights Reserved14
Cyber Cost Categories Divided the Development Phase Activities into the following er Program ManagementAuthentication/CertificationSW Application ReleaseContractor SupportArchitecture/DesignCyber HW ProcureCyber TestingCyber Requirements AnalysisCyber DocumentationAssess Risk/Identify ControlsCyber TrainingAssess Security (General)‒ Based on a narrative description for each activity‒ Subjective assessment by research analyst; not official designations in the database‒ Informed by Mil-Std-881E, Appendix K (Common Elements) 2021 PRICE Systems, L.L.C. All Rights Reserved15
Cyber Cost Categories Divided the Operations and Support Phase Activities into thefollowing Cost Categories:ManagementRequirements/RiskHW/SWManage Cyber OperationsAuthentication/CertificationSW Maintenance ReleaseContractor Cyber SupportMonitor System/Maintain ControlsSW Security Patch / IAVAMaintain Cyber HWCloud Costs/Fees‒ Based on a narrative description for each activity‒ Subjective assessment by research analyst; not official designations in the database‒ Informed by Mil-Std-881E, Appendix J (IT Systems O&S) 2021 PRICE Systems, L.L.C. All Rights Reserved16
Develop Benchmarks/Factors:Experimental Design (3 Steps)Basis TotalDev Phase DevelopmentActivities1. 2019 2. 2021DBDBBasis YearlyDev Phase Operations &Support ActivitiesBasis YearlyO&S Phase 3. 2021 DB With and Without OutliersFactors by Cyber Cost CategoryAverageMedianUnique byAgency% Total DevPhase % Total DevPhase Global-AllAgencies% Total DevPhase % Total DevPhase % Avg YearlyDev Phase % Avg YearlyDev Phase % Avg YearlyDev Phase % Avg YearlyDev Phase Unique byAgency% Avg YearlyO&S Phase % Avg YearlyO&S Phase Global-AllAgencies% Avg YearlyO&S Phase % Avg YearlyO&S Phase Unique byAgencyGlobal-AllAgencies 2021 PRICE Systems, L.L.C. All Rights Reserved17
Creating Data Factors (Approach 1) Sort by Agency, IT System and Cyber Cost Category:‒ Cyber Activity Cost as a % of Total Development Cost for the Program1 Fed Agency3 IT ProgramsAt least 1 Cyberactivity per ProgramProgram Budget per Year ( M)Cyber Activity Spent per Year ( M) 2021 PRICE Systems, L.L.C. All Rights ReservedCyber Spent as %of TotalBudget18
Creating Data Factors (Approach 2) Sort by Agency, IT System and Cyber Cost Category:‒ Cyber Category Cost per Year as a % of the Budget in each Year‒ Used to develop O&S factors and as alternate for Dev factors1 Fed Agency3 IT ProgramsAt least 1 Cyberactivity per ProgramProgram Budget per Year ( M)Cyber Activity Spent per Year ( M)Cyber Spent as % of Budget in Year Spent 2021 PRICE Systems, L.L.C. All Rights Reserved19
Roll-Up by Category by Agency Result: Fed Agency specific Cyber Category Cost factors Average and Median value by Cyber Category Cost for eachAgency1 Federal Agency% of Total Budget by Activity byCategorySummary by Category for the Agency 2021 PRICE Systems, L.L.C. All Rights Reserved20
Roll-Up by Category across All Agencies Result: A universal set of Cyber Category Cost factors for All agencies Average and Median value by Cyber Category Cost 2021 PRICE Systems, L.L.C. All Rights Reserved21
SummaryAnalysis, Resultsand Conclusions 2021 PRICE Systems, L.L.C. All Rights Reserved 2021 PRICE Systems, L.L.C. All Rights Reserved22
Analysis Applied the factors to 50 Development Activities and 20 O&SActivities drawn from the original database‒ The withheld Activities were not used to develop the factors Evaluated comparison metrics that described the differencebetween the actual cost distribution and the estimated costdistribution for the 50 activities‒ Pearson’s Correlation Coefficient (R)‒ F-statistic to compare variance‒ t-Statistic to compare the means‒ Std Error of the Estimate‒ Number of activities Over or Underestimated and % Over or Under Drew conclusions from the comparison metrics 2021 PRICE Systems, L.L.C. All Rights Reserved23
BLUF: Compare Best Fit Global FactorsBest Fit ResultsDevFactor %Total Dev DevFactor %Yrly Dev O&SFactor %Yrly O&S 1. Factors from 2019 Research With Outliers With OutliersWith Outliers 1.Top 6 Average10.55N/AN/AOther Category Average31.16N/AN/AN/ATop 6 Median2.79N/AOther Category Median17.042. Updated Factors from 2021 With Outliers With OutliersTop 6 Average9.7721.18N/AN/A28.328.6910.78Top 6 Median1.989.275.64Other Category Median5.1912.179.29No OutliersNo OutliersNo Outliers5.322.759.96Other Category Average12.9618.5110.78Top 6 Median1.966.235.52Other Category Median3.8810.499.29Top 6 Average“% Total Dev ” yields a factorthat can be applied to actualannual spending for any year inthe development phase2.“% Avg Yearly Dev ” yields afactor that must be applied to theaverage annual spending acrossall years of the DevelopmentPhase3.O&S factors are only for “% AvgYearly O&S ” because O&S fundsare only authorized for a singleyear at a time4.Removing the outliers has thegreatest impacts on factors as a“% of Total Dev ”; only minimalimpacts on factors as a “% ofYearly Dev or O&S ”With Outliers12.2Other Category Average3. Updates from 2021Notes and Explanations 2021 PRICE Systems, L.L.C. All Rights Reserved24
Detailed Analysis,Results andConclusions** Present as Time AllowsAlso check Back-Up Slides 2021 PRICE Systems, L.L.C. All Rights Reserved 2021 PRICE Systems, L.L.C. All Rights Reserved25
Estimating Cyber Costs per Activity Estimated cyber costs as a % of Total Phase Cost:‒ Cost 1 Average Factor (Average % of Total Dev by Category) x Total Spentfor the Parent IT System in all Dev Years‒ Cost 2 Median Factor (Median % of Total Dev by Category) x Total Spent forthe Parent IT System in all Dev Years‒ Dev factors only; O&S cost factors not determined as a % of Total O&S Phasecosts Estimated cyber cost as a % of Annual Spending by Phase:‒ Cost 3 Average Factor (Average % of Avg Yearly by Category) x Number ofFunded Years for the Activity being Estimated x Average Expenditures per Yearby Phase for the Parent IT System‒ Cost 4 Median Factor (Median % of Avg Yearly by Category) x Number ofFunded Years for the Activity being Estimated x Average Expenditures per Yearby Phase for the Parent IT System‒ Dev and O&S cost factors 2021 PRICE Systems, L.L.C. All Rights Reserved26
Results: With the Outliers Includes Tables of Global Factors by Category across AllAgencies Contact richard.mabe@pricesystems.com for a worksheetwith Tables of Specific Factors by Category by Agency 2021 PRICE Systems, L.L.C. All Rights Reserved27
Summary: Best Fit Metrics (with the Outliers) Based on metrics calculated for each Cost Estimating approach (1 – 4)*Measure for Comparison (alpha 0.05)Factor TypePearson’s CoefficientP-value for F-StatisticP-value for t-StatisticStd Error ( M)Number of Activities Over-EstimatedAverage % OverestimatedNumber of Activities Under-EstimatedAverage % UnderestimatedDev Factorsper Categoryper AgencyDev Factorsper CategoryAll AgenciesO&S Factorsper Categoryper AgencyO&S Factorsper CategoryAll AgenciesAvg % of AvgYearly Med % of AvgYearly Med % of AvgYearly Avg % of AvgYearly 9713353%307%81%7,045%12239555%59%42%79%*Detailed results for each approach are included in the Back-Up slides 2021 PRICE Systems, L.L.C. All Rights Reserved28
Conclusions: Development Factors Results Summary:‒ Average and Median factors by Avg Yearly fit better than the Average andMedian factors by Total Dev Required normalizing Total Costs to be an Average % per Year for factors by FY‒ “By Agency” values are better than the “Global” values representing allagencies But each agency did not include activities for each cyber category in the DB Recommendation:‒ Apply the Global Factors as a ROM for federal IT programs Apply the “Median % of Avg Yearly Dev ” factor per Category every year for:Cyber Program ManagementCyber TestingAuthentication/CertificationAssess Risk/ Identify ControlsCyber DocumentationSW Application Releases Apply the Median factors for the remaining categories as an occasional “spike” tomitigate risk, but probably not more than once per IT program 2021 PRICE Systems, L.L.C. All Rights Reserved29
Global Dev Factors - % Avg Yearly Dev For the Average Factors‒ 76% of the activities 21.18% of Avg Yearly Dev across 6 categories and 50% of all agencies‒ 24% of the activities 28.69% of Avg Yearly Dev across 7 categories and 22% of all agencies For the Median Factors‒ 76% of the activities 9.27% of Avg Yearly Dev across 6 categories and 50% of all agencies‒ 24% of the activities 12.17% of Avg Yearly Dev across 7 categories and 22% of all agencies 2021 PRICE Systems, L.L.C. All Rights Reserved30
Conclusions: O&S Factors Results Summary:‒ Average and Median factors by FY are equally valid for Agency Specific values Required normalizing Total Costs to Average % per Year for factors by FY‒ “By Agency” values are better than the “Global” values representing allagencies; But data for each agency did not include activities for each cyber category in the DB Recommendation:‒ Apply the Global factors as a ROM for federal IT programs Apply the “Average % of Avg Yearly O&S ” factor per Category every year for:Monitor/Maintain ControlsSecurity Patch/IAVA, ManageManage Cyber OperationsSW Maintenance Release Apply the Average factors for the remaining categories as an occasional “spike” tomitigate risk, but probably not more than once per IT program 2021 PRICE Systems, L.L.C. All Rights Reserved31
Global O&S Factors - % Avg Yearly O&S For the Average Factors‒ 95% of the activities 12.2% of Avg Yearly O&S Costs across 4 categories and 43% ofall agencies‒ 5% of the activities 10.78% of Avg Yearly O&S Costs across 4 categories and 7% ofall agencies For the Median Factors‒ 95% of the activities 5.64% of Avg Yearly O&S Costs across 4 categories and 50% ofall agencies‒ 5% of the activities 9.29% of Avg Yearly O&S Costs across 4 categories and 22% of allagencies 2021 PRICE Systems, L.L.C. All Rights Reserved32
Alternate Results: No Outliers Includes Tables of Global Factors by Category across AllAgencies Contact richard.mabe@pricesystems.com for a worksheetwith Tables of Specific Factors by Category by Agency 2021 PRICE Systems, L.L.C. All Rights Reserved33
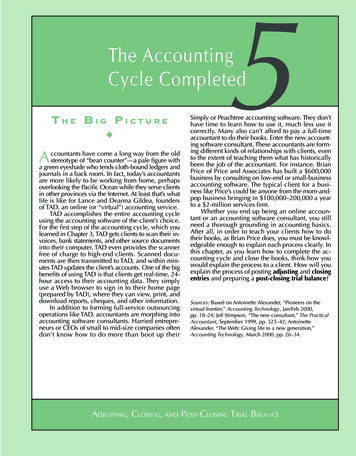
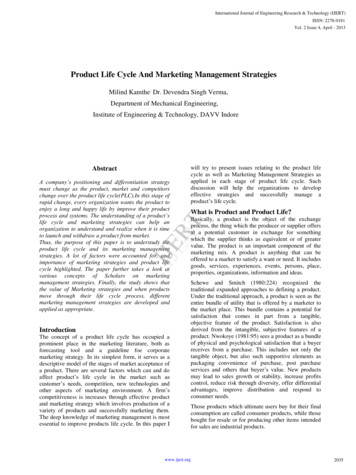
Development Activity Costs- No OutliersReduced the Mean,Std Error and StdDeviationMinimal change tothe Median and theMode 2021 PRICE Systems, L.L.C. All Rights Reserved34
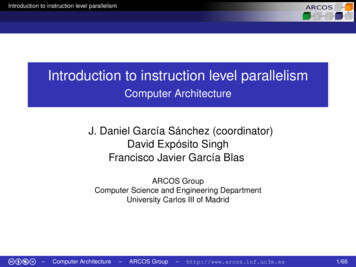
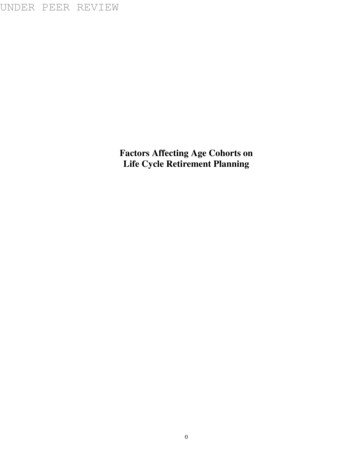
O&S Activity Costs – No OutliersReduced the Mean,Std Error and StdDeviationMinimal change tothe Median and theMode 2021 PRICE Systems, L.L.C. All Rights Reserved35
Summary: Best Fit (No Outliers) Based on metrics calculated for each Cost Estimating approach (1 – 4)*Measure for Comparison(alpha 0.05)Factor TypePearson’s CoefficientP-value for F-StatisticP-value for t-StatisticStd Error ( M)Number of Activities Over-EstimatedAverage % OverestimatedNumber of Activities Under-EstimatedAverage % UnderestimatedO&S FactorsperCategoryper AgencyDev Factorsper Categoryper AgencyDev Factorsper CategoryAll AgenciesMed % TotDev Med % TotDev 12720.4251781%942%0.17280.1083126696%674%O&S Factorsper CategoryAll AgenciesMed % of Avg Avg % of AvgYearly Yearly *Detailed results for each approach are included in the Back-Up slides 2021 PRICE Systems, L.L.C. All Rights Reserved36
Conclusions: Dev Factors Results Summary* (No Outliers):‒ Average and Median factors by % Total Dev do not fit any better than the Averageand Median factors by % Avg Yearly With outliers, the Factors by % Avg Yearly were a better fit‒ “By Agency” values are not any better than the “Global” values representing allagencies With outliers, the “By Agency” values were a better fit But each Agency did not include activities for each cyber category in the DB Recommendation:‒ Apply the Global Factors as a ROM for federal IT programs Apply the “Median % of Total Dev ” factors per Category every year for:Cyber Program ManagementCyber TestingAuthentication/CertificationAssess Risk/ Identify ControlsCyber DocumentationSW Application Releases Apply the Median factors for the remaining categories as an occasional “spike” tomitigate risk, but probably not more than once per IT program 2021 PRICE Systems, L.L.C. All Rights Reserved37
Global Dev Factors - % Total Dev For the Average Factors (Lower Avg; Contractor Support no longer a “spike”)‒ 77% of the activities 5.30% of Total Dev across 6 categories and 50% of all agencies‒ 23% of the activities 12.96% of Total Dev Costs across 7 categories and 22% of all agencies For the Median Factors (Minimal change to Median; Validates skew in the DB)‒ 76% of the activities 1.96% of Total Dev across 6 categories and 50% of all agencies‒ 24% of the activities 3.88% of Total Dev across 7 categories and 22% of all agencies 2021 PRICE Systems, L.L.C. All Rights Reserved38
Conclusions: O&S Factors Results Summary (No Outliers):‒ Average and Median factors by FY are both valid for Agency Specific values Required normalizing Total Costs to Average % Spent per Year for factors by FY‒ “By Agency” values are better than the “Global” values representing allagencies; But data for each agency did not include activities for each cyber category in the DB Recommendation:‒ Apply the Global factors as a ROM for federal IT programs Apply the “Average % of Avg Yearly ” factor per Category every year for:Monitor/Maintain ControlsSecurity Patch/IAVA, ManageManage Cyber OperationsSW Maintenance Release Apply the Median or Average factors for the remaining categories as an occasional“spike” to mitigate risk, but probably not more than once per IT program 2021 PRICE Systems, L.L.C. All Rights Reserved39
Global O&S Factors - % Avg Yearly O&S For the Average Factors‒ 95% of the activities 9.69% of Avg Yearly O&S across 4 categories and 43% of allagencies‒ 5% of the activities 10.78% of Avg Yearly O&S across 4 categories and 7% of allagencies For the Median Factors‒ 95% of the activities 5.52% of Avg Yearly O&S across 4 categories and 50% of allagencies‒ 5% of the activities 9.29% of Avg Yearly O&S across 4 categories and 22% of allagencies 2021 PRICE Systems, L.L.C. All Rights Reserved40
Questions? 2021 PRICE Systems, L.L.C. All Rights Reserved41
www.pricesystems.com1-800-43PRICE 2021 PRICE Systems, L.L.C. All Rights Reserved
Back-up Slides 2021 PRICE Systems, L.L.C. All Rights Reserved 2021 PRICE Systems, L.L.C. All Rights Reserved43
Key Word DefinitionsNIST – National Institute of Standards and TechnologyDIACAP – DOD Information Assurance Certification and Accreditation ProcessC&A – Certification and AuthorizationRMF – Risk Management Framework (Replaced DIACAP)ATO – Authority to OperateSTIG – Security Technical Implementation Guides 2021 PRICE Systems, L.L.C. All Rights Reserved44
Limitations on the Final Data Costs not identified by budget appropriation or by LaborCategory Unable to identify split between contract labor andgovernment employees Assumed all funds were “As Spent” (current year); did notnormalize to a Base Year (constant year)‒ Too many agencies‒ No set of common adjustment factors to apply Representative sample only‒ May be additional keywords or activities not included 2021 PRICE Systems, L.L.C. All Rights Reserved45
Agencies Included in the Analysis DoD onlyincluded asO&S activities‒ Only OSD Levelsystems in theOMB DB‒ Dev activitieswere excluded bythe filters used All agencies donot include allcyber costcategories‒ But each agencyshown hereincludes at least 1cyber activity 2021 PRICE Systems, L.L.C. All Rights Reserved46
Detailed Results: With the Outliers 2021 PRICE Systems, L.L.C. All Rights Reserved47
Results 1: Development Activities and Factors;Agency Specific Values per FactorMeasure for Comparison(alpha 0.05)Pearson’s Coefficient (R)P-value for F-StatisticP-value for t-StatisticStd Error ( M)Number of Activities OverEstimatedAverage % OverestimatedNumber of Activities UnderEstimatedAverage % UnderestimatedCost 1:Average %Total DevCost 2:Median %Total Dev*Cost 3:Average %per Avg FYCost 4:Median %per 67* 4 activities for Cost 2 were exactly equal to the actual cost** 2 activities for Cost 4 were exactly equal to the actual cost 2021 PRICE Systems, L.L.C. All Rights Reserved48
Results 2: Development Activities and Factors;Global Values per Factor (All Agencies)Measure for Comparison(alpha 0.05)Pearson’s Coefficient (R)P-value for F-StatisticP-value for t-StatisticStd Error ( M)Number of Activities OverEstimatedAverage % OverestimatedNumber of Activities UnderEstimatedAverage % UnderestimatedCost 1:Average %Total DevCost 2:Median %Total DevCost 3:Average %per Avg FYCost 4:Median %per %** 1 activity for Cost 4 was exactly equal to the actual cost 2021 PRICE Systems, L.L.C. All Rights Reserved49
Results 3: O&S Activities and Factors;Agency Specific Values per FactorCost 3:Average %per Avg FY*Cost 4:Median %per Avg FYPearson’s Coefficient0.95710.9540P-value for 11%81%10935%42%Measure for Comparison(alpha 0.05)P-value for t-StatisticStd Error ( M)Number of Activities OverEstimatedAverage % OverestimatedNumber of Activities UnderEstimatedAverage % UnderestimatedCost 1:Average %Total O&SCost 2:Median %Total O&S*2 activities for Cost 3 were exactly equal to the actual cost 2021 PRICE Systems, L.L.C. All Rights Reserved50
Results 4: O&S Activities and Factors;Global Values per Factor (All Agencies)Cost 3:Average %per Avg FYCost 4:Median %per Avg FYPearson’s Coefficient0.56820.1936P-value for 05921377,045%2,252%51179%81%Measure for Comparison(alpha 0.05)P-value for t-StatisticStd Error ( M)Number of Activities OverEstimatedAverage % OverestimatedNumber of Activities UnderEstimatedAverage % UnderestimatedCost 1:Average %Total O&SCost 2:Median %Total O&S 2021 PRICE Systems, L.L.C. All Rights Reserved51
Compare to the Factors for % Total Dev For the Average Factors‒ 76% of the activities 9.77% of Total Dev Costs across 6 categories and 50% of all agencies‒ 24% of the activities 28.3% of Total Dev Costs across 7 categories and 22% of all agencies For the Median Factors‒ 76% of the activities 1.98% of Total Dev Costs across 6 categories and 50% of all agencies‒ 24% of the activities 5.19% of Total Dev Costs across 7 categories and 22% of all agencies 2021 PRICE Systems, L.L.C. All Rights Reserved52
Alternate Results: No Outliers 2021 PRICE Systems, L.L.C. All Rights Reserved53
Outliers Removed from the Dev DataAgencyCategory% TotDevCyber MDepartment of Homeland SecurityArchitecture/Design10.19%9.14Office of Personnel ManagementContractor Support56.52%26.00Department of CommerceContractor Support116.09%17.18Department of Health and Human Services Cyber HW Procure21.62%6.80Department of the TreasuryCyber Progr Management1.52%21.92Department of the TreasuryCyber Progr Management1.46%21.06Department of AgricultureCyber Testing3.30%10.00Department of Veterans AffairsCyber Testing12.03%8.07 2021 PRICE Systems, L.L.C. All Rights Reserved
Outliers Removed from the O&S Data%AnnualO&SCyber M43.82%16.65Department of Homeland Security Manage Cyber Operations8.43%20.35Department of Homeland Security Manage Cyber Operations8.85%21.35Department of Homeland Security SW Maint Release27.69%21.81Department of Homeland Security Manage Cyber Operations17.34%41.83AgencyDepartment of the TreasuryCategoryMonitor System/Maintain Controls 2021 PRICE Systems, L.L.C. All Rights Reserved
Results 1: Development Activities and Factors;Agency Specific Values per FactorMeasure for Comparison(alpha 0.05)Pearson’s Coefficient (R)P-value for F-StatisticP-value for t-StatisticStd Error ( M)Number of Activities OverEstimatedAverage % OverestimatedNumber of Activities UnderEstimatedAverage % UnderestimatedCost 1:Average %Total DevCost 2:Median %Total Dev*Cost 3:Average %per FYCost 4:Median %per 0.8820* 4 activities for Cost 2 were exactly equal to the actual cost** 2 activities for Cost 4 were exactly equal to the actual cost 2021 PRICE Systems, L.L.C. All Rights Reserved56
Results 2: Development Activities and Factors;Global Values per Factor (All Agencies)Measure for Comparison(alpha 0.05)Pearson’s Coefficient (R)P-value for F-StatisticP-value for t-StatisticStd Error ( M)Number of Activities OverEstimatedAverage % OverestimatedNumber of Activities UnderEstimatedAverage % UnderestimatedCost 1:Average %Total DevCost 2:Median %Total DevCost 3:Average %per FYCost 4:Median %per * 1 activity for Cost 4 was exactly equal to the actual cost 2021 PRICE Systems, L.L.C. All Rights Reserved57
Results 3: O&S Activities and Factors;Agency Specific Values per FactorCost 1:Average %Total O&SCost 2:Median %Total O&SCost 3:Average %per FY*Cost 4:Median %per FYPearson’s CoefficientN/AN/A0.95710.9540P-value for SpendingSpending35%42%Measure for Comparison(alpha 0.05)0.9540P-value for t-StatisticStd Error ( M)Number of Activities OverEstimatedAverage % OverestimatedNumber of Activities UnderEstimatedAverage % Underestimated*2 activities for Cost 3 were exactly equal to the actual cost 2021 PRICE Systems, L.L.C. All Rights Reserved58
Results 4: O&S Activities and Factors;Global Values per Factor (All Agencies)Cost 1:Average %Total O&SCost 2:Median %Total O&SCost 3:Average %per FYCost 4:Median %per FYPearson’s CoefficientN/AN/A0.69360.1992P-value for O&SO&S611SpendingSpending74%81%Measure for Comparison(alpha 0.05)P-value for t-StatisticStd Error ( M)Number of Activities OverEstimatedAverage % OverestimatedNumber of Activities UnderEstimatedAverage % Underestimated 2021 PRICE Systems, L.L.C. All Rights Reserved59
Compare to Factors for the % Avg Yearly Dev For the Average Factors (Lower Avg; Contractor Support no longer a “spike”)‒ 77% of the activities 22.75% of Avg Yearly Dev across 6 categories and 50% of all agencies‒ 23% of the activities 18.51% of Avg Yearly Dev across 7 categories and 22% of all agencies For the Median Factors (Minimal change to Median; Validates skew in the DB)‒ 76% of the activities 6.23% of Avg Yearly Dev across 6 categories and 50% of all agencies‒ 24% of the activities 10.49% of Avg Yearly Dev across 7 categories and 22% of all agencies 2021 PRICE Systems, L.L.C. All Rights Reserved60
Final SlideFinal Slide 2021 PRICE Systems, L.L.C. All Rights Reserved61
Life Cycle Cost Estimating Factors for Cybersecurity in Federal IT Systems . 2021 Joint SW & IT Cost Forum . September 16, 2021 . 1 . . Applies industry best-practices to estimate life cycle costs for Software and IT systems Experience includes hands-on data collection, cost estimating, and project management .