Transcription
INTERNATIONAL JOURNAL OF MATHEMATICAL MODELS AND METHODS IN APPLIED SCIENCESTwo-dimensional extended warranty costanalysis for multi-component repairableproductsKamran Shahanaghi, Majeed Heydari market enforce the EW providers to estimate products’failures and servicing costs more accurately and offer EWcontracts with competitive prices and quality of services.Abstract— Providing extended warranty (EW) contracts forincreasingly complex products with multiple failure processes andalmost high repair costs are challenging and risky task. In suchcircumstances, modeling products as multi-component systems andestimating their failures and servicing costs more accurately are ofgreat interest to EW providers. In this paper, a repairable product soldwith two-dimensional warranty, like an automobile, is considered asa multi-component system composed of a series of heterogeneouscomponents with conditionally independent time to failures. For thisproduct, the effect of usage rate on the failure processes of itscomponents and in turn on the product’s time to failure during theEW period is modeled. Then, considering cost of a repair as functionof failed component and its age and usage, the expected servicingcost of the EW contract is estimated. A failure history of acommercial vehicle is also used to illustrate the proposed model. Inthe provided case study, vehicle’s components are categorized intofive main subsystems and the time to the first failures of eachsubsystem and in turn vehicle’s time to failure is derived. Throughthis example the effects of EW’s length and usage limits on itsservicing cost are also studied and iso-warranty cost curves areobtained.Comparing raised practical problems in the offering of EWcontracts for complex products with conducted researches onthis area reveals huge gap between academic researches andpractical needs. In the following, we show this gap byreviewing the reported researches in the EW literature since2000. The researches into the EW contracts can be broadlycategorized into market-related and mathematical modelingresearches. The majority of these researches belong to themarket-related researches (see for example [6-10]). However,mathematical modeling and optimization of EW contracts hasbecome an active area of research especially over the lastdecade. Considerable growth in the conducted researches onthis area shows that there is increasing interest on themathematical modeling and optimization of EW contracts. Inthe following lines we briefly review these researches.Considering only corrective maintenance Kumar andChattopadhyay [11] determined minimum beneficial length ofthe EW contract from consumer’s perspective under minimalrepair at failure assumption. Jack and Murthy [12] assumingminimal repair and Lam and lam [13] in the presence ofperfect repair at failures applied game models to derive theoptimal policies of the manufacturer and the consumer duringan EW period. Wu and Longhurst [14] also minimizedexpected life cycle cost of a product when minor andcatastrophic failures were rectified by minimal repair andreplacement respectively. In the above researches, onlycorrective maintenance is considered. However, assumingpreventive maintenance with imperfect repair and minimalcorrective repairs, Bouguerra et al. [15] determined themaximum acceptable price of an EW contract from theconsumer’s perspective as well as minimum acceptable priceof the EW contract from the manufacturer’s perspective.Chang and Lin [16] also maximized an EW provider’s profitby deriving the optimal length of EW contract as well ascontrolled-limit preventive maintenance strategy during thebase and EW periods. In this research, the corrective andpreventive repairs were assumed to be minimal and imperfectrespectively.In all above mentioned researches, warranty policy assumedto be one-dimensional i.e. warranty coverage region solelydefined by an interval (usually of time). However, for someKeywords— Two-dimensional Extended warranty contract,Multi-component product, Failure modeling, Warranty cost analysis.I. INTRODUCTIONExtended warranty has become increasingly important partof after-sale market and there is increasing interest in theoffering [1] and purchasing [2] of EW contracts for a widerange of products. The EW market study reveals that selling ofEW contracts is among the biggest profit producers of all [3].For example the profit margins of offering EW contracts forelectrical devices estimated to be 40% to 77% [4] while fornew vehicles this may reach upwards of 100 percent [5].However, most of products sold in the market are complexproducts and rapidly changing and increasing technologicalcomplexity of them over time makes predicting future failuresof products and upcoming servicing costs more challengingtask. On the other hand, increasing competition in the EWKamran Shahanaghi is with the Department of Industrial Engineering, IranUniversity of Science and Technology, Tehran, Iran; (e-mail:Shahanaghi@iust.ac.ir).Majeed Heydari is with the Department of Industrial Engineering, IranUniversity of Science and Technology, Tehran, Iran; (As a correspondingauthor his e-mail is: m heydari@iust.ac.ir.Issue 3, Volume 7, 2013247
INTERNATIONAL JOURNAL OF MATHEMATICAL MODELS AND METHODS IN APPLIED SCIENCESthey obtained expected and variance of DWCs. In anotherresearch, Bai and Pham [27] proposed a renewable full-servicewarranty (RFSW) policy for repairable series, parallel, series–parallel and parallel–series systems and obtained the first andsecond centered moments of base warranty servicing costsfrom manufacturer’s point of view. In the proposed model, itis assumed that all failed components under warranty arereplaced with new ones and at the same time systemundergoes perfect repair all free of charge to consumers.Assuming imperfect repair at failures, Park and Pham [28]also applied quasi-renewal processes to obtain reliability andwarranty cost models for several systems, including multicomponent systems.In the reviewed researches on warranty analysis of a multicomponent product, warranty policy was assumed to be onedimensional. However, for some multi-component products,like automobiles, warranty coverage region is twodimensional. To the best of authors’ knowledge, warrantyanalysis of a multi-component product under a twodimensional base warranty has become subject of the only tworeported researches in the warranty literature. In the firstresearch, Manna et al. [29] applied accelerated failure time(AFT) model at components level to study the effect of userate on the components’ time to failures and in turn product’sfailure times. In the second research, for a k-out-of-nrepairable system with a two-dimensional warranty, Park andPham [30] minimized the long-run expected warranty costwhen a periodic preventive maintenance as well as correctivemaintenances are carried out on the system. In the proposedmodel, free repair/replacement and pro-rata warranty policiesare studied and warranty period, repair time limit, and periodicpreventive maintenance cycles are assumed to bemanufacturer’s decision variables.As provided literature review reveals despite of the EWcontracts’ importance, there is no reported research on themodeling and analysis of EW contracts for complex multicomponent products. In this paper, for the first time in EWliterature, considering a product as a multi-component systemcomposed of a series of heterogeneous components, we derivethe failure process of the product and its servicing cost duringthe EW period. In the proposed model the base and EWpolicies assumed to be two-dimensional non-renewable freerepair warranties. The provided model aims to help the EWprovider to effectively utilize available information and moreaccurately estimate the product failures and its upcoming costsduring the EW period. To achieve this goal, product’s internalstructure, heterogeneous characteristics of components as wellas product’s age and usage are investigated to build moreaccurate failure and in turn cost models. Since automobile isthe most well-known example of such a multi-componentsystem with widely offered two-dimensional EW contracts,we use the failure history of a commercial vehicle produced ina plant in Iran to illustrate the proposed model. Through thiscase study and using the proposed formulations, we analyzethe effect of EW’s coverage region on the product’s servicingcost. We also derive iso-warranty cost curves which mayseriously help the EW provider to offer a wide range ofproducts like automobiles time (age) and usage (mileage) areused simultaneously to determine the warranty coverageregion in a two-dimensional plane. Considering this type ofwarranty policy which is called two-dimensional warranty,Majid et al. [17] optimized the EW’s coverage region and itsexpected servicing cost from service provider’s point of view.To do this, assuming minimal repair at failure, they used twodimensional delay time model and determined optimalpreventive maintenance strategy during the EW contract. Inthe presence of three different corrective repair options, Suand Shen [18] derived the expected cost and profit models ofan EW contract when a manufacturer offers nsionalwarranties. For a product sold with a two-dimensionalwarranty, Shahanaghi et al. [19] also minimized the expectedservicing cost of an EW contract from the EW provider’spoint of view. To do this, assuming minimal repairs at failuresduring the base and EW periods as well as assuming apreventive imperfect maintenance during the EW period, theyderived the optimal number and degrees of preventive repairs.In another research, considering the possibility of an upgradeaction at the beginning of the EW period as well as preventivemaintenance with the fixed and pre-specified repair levelsduring the EW period, Heydari et al. [20] maximized the EWprovider’s profit. To do this, by incorporating the demand forEW contracts, they obtained the optimal upgrade improvementlevels and optimal number of preventive repairs during theEW period.In the all previously reviewed researches, the black-boxapproach is used to model the failure process of product andits corresponding costs during the EW period. In thisapproach, regardless of product’s internal structure and itscomponents characteristics, the product treated as a simplesingle-unit product. Since in this approach availableinformation like system structure, the number andcharacteristics of its components are not taking into account,the provided results should be only considered as anapproximation [21]. However, most of products sold in themarket are complex systems composed of manyheterogeneous components with different characteristics. Insuch situations, modeling a product as multi-componentssystem and utilizing available information may considerablyimproves the warranty provider’s insight on the failure processof the product. This may helps the service provider to estimatethe product failures more accurately and derive more effectivemaintenance and inspection policies during the warrantyperiod.The research on the multi-component systems’ failuremodeling and maintenance optimization is vast (see forexample [22-26] and references therein). However, warrantymodeling and optimization by considering a product as acomplex system is almost new topic [21] and there are limitedreported researches in the warranty literature. Assuming onedimensional free repair and pro-rata warranty policies, Bai andPham [21] derived discounted warranty cost (DWC) models ofa repairable series system. To do this, considering continuesand discrete discount functions and minimal repair at failuresIssue 3, Volume 7, 2013248
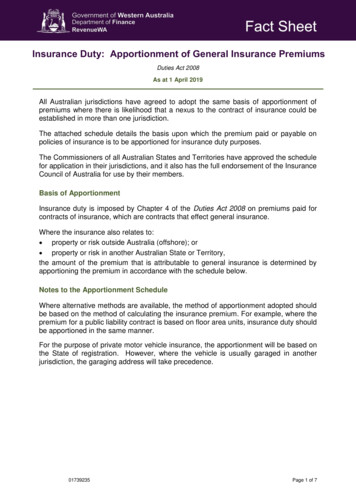
INTERNATIONAL JOURNAL OF MATHEMATICAL MODELS AND METHODS IN APPLIED SCIENCESflexible two-dimensional EW contracts.The remainder of this paper is organized as follows: in thenext section, the coverage region of a two-dimensional EWcontract is determined. In the first two subsections of sectionIII, two-dimensional failure model at components and systemlevels are derived and the EW’s servicing cost is modeled.Then, for a special case where random variables follow fromWeibull distribution, the proposed formulations are derivedand presented in the final subsection of section III. Through acase study, the proposed model is illustrated in section IV.Finally, conclusions are drawn and some future researchdirections are presented in section V.II. TWO-DIMENSIONAL EXTENDED WARRANTY COVERAGEFig 1: The base and extended warranties’ coverage regions when a)𝑟 min {𝑟0 , 𝑟1 }, b): 𝑟1 𝑟 𝑟0 and c): 𝑟0 𝑟 𝑟1 and d) 𝑟 max {𝑟0 , 𝑟1 }.REGIONFor a given product sold with a two-dimensional warranty,like an automobile, let the base warranty coverage region is arectangle region in a two-dimensional plane represented byΩBW (0, 𝑊0 ] (0, 𝑈0 ] where 𝑊0 and 𝑈0 are warrantylength (time/age) and usage (mileage). For this product, basewarranty policy is non-renewable free repair warranty(NRFRW) with minimal repairs at failures and warrantyexpires when the age or usage of the product respectivelyexceeds from 𝑊0 or 𝑈0 whichever occurs first. Suppose thatbefore the expiration of base warranty, the consumerpurchases an EW contract with length 𝑊1 and usage 𝑈1 tocover product failures right after the expiration of basewarranty period. The EW policy is also assumed to be thesame as the base warranty i.e. it is NRFRW.Despite one-dimensional warranty which its expiration timeis known in advance, in two-dimensional case the basewarranty expiration time and equivalently the EW beginningtime are unknown and depends on the consumer’s usage rate.For convenience, suppose that for a given consumer, his/herusage rate over product lifecycle is almost constant anddifferent consumers have randomly different usage rates.𝑈𝑈Therefore, assuming 𝑟0 0 and 𝑟1 1 the base and𝑊0can expect, it may considerably affects the product’sdegradation process, its reliability and in turn warrantyservicing cost. In the next section, the effect of consumer’susage rate on the time to the first failure of product atcomponents and system levels are modeled and the EWservicing cost will be obtained.III. MODELING THE PRODUCT AS A MULTI-COMPONENT SERIESSYSTEMIn essence most of products are multi-component systemscomposed of a collection of interrelated heterogeneouscomponents where any failure of these components may leadto system failure. In this paper, we consider a product as amulti-component system with a series of 𝐾 heterogeneouscomponents. All components are repairable and in the case ofany failure, only failed component is minimally repaired.Repair time and the probability of occurring two or morefailures at the same time are negligible. The warranty policyover both base and extended warranty periods are nonrenewable free repair warranties (NRFRW). We also assumethat failure processes of components are conditionallyindependent i.e. conditioning on the usage rate, for a givenconsumer with usage rate 𝑟 the time to first failures ofcomponents are independent. It is worth to note that when theusage rate varies between consumers the times to the firstfailures of components will also vary and this makes failureprocesses of components unconditionally dependent. For moreinformation on the made assumption and raised issues see[29].Let 𝑋𝑆 and 𝑈 are random variables denoting the time to thefirst failure and total usage of the product respectively. 𝑅 isalso random variable representing consumers’ usage rate andas previously stated in this paper we assume that for a givenconsumer his/her usage rate over product lifecycle is almostconstant. Therefore, under given usage rate 𝑟 the total usage ofthe product will be 𝑈(𝑟) 𝑟𝑋𝑆 (𝑟), where 𝑋𝑆 𝑟 [𝑋𝑆 𝑅 𝑟]. Considering these assumptions, in the next subsection, thefailure process of the product at components and system levelsare presented.𝑊1extended warranties’ coverage regions regarding 𝑟, theconsumer’s usage rate, will be different (see Fig 1).As a result, regarding 𝑟0 and 𝑟1 the EW coverage regionwill be as follows:{Ω𝐸𝑊 𝑟; 𝑟0 𝑟1 }𝑊0 , 𝑊0 𝑊1 𝑟𝑊0 , 𝑟𝑊0 𝑟𝑊1𝑈0 𝑈0, 𝑊1 𝑈0 , 𝑈0 𝑟𝑊1 𝑟 𝑟𝑈0 𝑈0 𝑈1, 𝑈0 , 𝑈0 𝑈1𝑟 𝑟𝑟{Ω𝐸𝑊 𝑟; 𝑟1 𝑟0𝑊0 , 𝑊0 𝑊1 𝑟𝑊0 , 𝑟𝑊0 𝑟𝑊1𝑈1𝑊0 , 𝑊0 𝑟𝑊0 , 𝑟𝑊0 𝑈1 𝑟𝑈0 𝑈0 𝑈1, 𝑈0 , 𝑈0 𝑈1𝑟 𝑟𝑟𝑖𝑓 𝑟 𝑟0𝑖𝑓 𝑟0 𝑟 𝑟1(1)𝑖𝑓 𝑟 𝑟1𝑖𝑓 𝑟 𝑟1𝑖𝑓 𝑟1 𝑟 𝑟0(2)𝑖𝑓 𝑟 𝑟0A seen in Fig 1, consumer’s usage rate affects the expirationtimes of both base and extended warranties. Besides, as oneIssue 3, Volume 7, 2013249
INTERNATIONAL JOURNAL OF MATHEMATICAL MODELS AND METHODS IN APPLIED SCIENCESA. Two-dimensional failure model of a product during anEW periodconditional expected number of failures during the EW periodwill be as follows:𝐸 𝑁𝑆 Ω𝐸𝑊 𝑟; 𝑟0 𝑟1In this paper, we use marginal approach to model the failureprocess of the product in terms of its age and usage atcomponents level and in turn at the system level. To do this,we apply accelerated failure time (AFT) model at componentslevel to investigate the effect of usage rate on the time to thefirst failures of components. Then, based on the systemstructure we model the time to the first failure of product interms of its components failures times. For more informationon two-dimensional failure modeling approaches and relatedresearches please see [31].Let the time to the first failure of 𝑖th component undernominal usage rate 𝑟𝑛 is 𝑋𝑖 𝑟𝑛 𝑋𝑖 𝑅 𝑟𝑛 , 𝑖 1, , 𝐾,(𝑛) (𝑛)and 𝐹𝑋 𝑖 𝑟𝑛 𝑥; 𝛼𝑖 , 𝛽𝑖is its distribution function with scale(𝑛) 𝐹𝑅 𝑟0𝑟 𝛾(𝑛) 𝑟𝑛 𝑖𝑟𝛾(𝑛) 𝑟𝑛 𝑖and 𝛾𝑖 is the𝑟(𝑛)𝛽𝑖 (𝑟) 𝛽𝑖 . As onewhere 𝛼𝑖 𝑟 𝛼𝑖(𝑛), 𝛽𝑖, 𝐹𝑅 𝑟1 𝑈𝑊0 1𝑟𝑊0 𝑅𝑅 𝑟0(3)𝑟𝑥 𝑑𝑥 𝑋𝑆𝑟𝑈0 𝑈1 𝑟 𝑟𝑈0𝑟 𝑋 𝑆𝑊0 𝑊1𝑊0(6)𝑥 𝑑𝑡 𝑋 𝑆𝑟𝑥 𝑑𝑡𝑟𝑥 𝑑𝑥 𝑋 𝑆𝑟𝑈0 𝑈1 𝑟 𝑟𝑈0𝑟(7)𝑥 𝑑𝑡 𝑋 𝑆𝑟𝑥 𝑑𝑡where𝐹𝑅 𝑟 and 𝑅𝑅 𝑟 1 𝐹𝑅 𝑟respectivelyarecumulative distribution function and reliability functionassociated with usage rate random variable 𝑅. Finally, byremoving the conditioning the overall expected number ofproduct failures during the EW period can be obtained.However, since the components of the product are assumedto be heterogeneous, regarding the type of failed componentand age and usage of the component at the time of failure therepair cost might be different. In the next subsection,considering this situation we estimate the expected cost ofproduct’s failures.B. Expected servicing cost of a product during a twodimensional EW contractIn this paper we assume that when the product fails duringthe base and EW periods, only failed component minimallyrepaired and no interventions are made on the other workingcomponents. The repair cost also depends on the type of failedcomponent and its age and usage at the time of failure.Therefore, for a product under usage rate 𝑅 𝑟, the cost ofperforming a minimal repair on 𝑖th, 𝑖 1, , 𝐾, component atthe time 𝑥 with total usage 𝑢 𝑟𝑥 can be given by:𝐾(4)𝑖 1and𝚩 (𝛽1 , , 𝛽𝐾 ).where𝚨 (𝛼1 𝑟 , , 𝛼𝐾 𝑟 )Consequently, conditional probability density and hazardfunctions of the product will be as follows:𝑑𝐹𝑋 𝑆 (𝑟) 𝑥𝑓𝑋 𝑆 (𝑟) 𝑥 𝑑𝑥(5)𝑓𝑋 𝑆 (𝑟) 𝑥 𝑋 𝑆 (𝑟) 𝑥 1 𝐹𝑋 𝑆 (𝑟) 𝑥As a result, the conditional expected number of systemfailures up to time 𝑥 will constitute a non-homogenousPoisson process (NHPP) where its conditional intensityfunction equals to conditional hazard rate of the time to firstfailure of product i.e. 𝜆 𝑥 𝑟 𝑋 𝑆 (𝑟) 𝑥 . Recall that allfailures are assumed to be minimally repaired at negligibletimes. Therefore, considering presented EW coverage regionscenarios in equations (1) and (2) and their correspondingprobabilities of occurrences and conditioning on 𝑅 𝑟 theIssue 3, Volume 7, 2013 𝑋 𝑆 𝐹𝑅 𝑟0 𝐹𝑅 𝑟1AFT parameter of 𝑖th1 𝐹𝑋 𝑖 (𝑟) 𝑥; 𝛼𝑖 𝑟 , 𝛽𝑖𝑈0𝑟𝐸 𝑁𝑆 Ω𝐸𝑊 𝑟; 𝑟1 𝑟0component andcan see, in the AFTmodel it is assumed that changing the usage rate only affectsthe scale parameter and has no effect on the shape parameterof the time to the first failures. For convenience, in thefollowing we use notations 𝐹𝑋 𝑖 𝑟 𝑥; 𝛼𝑖 𝑟 , 𝛽𝑖 or 𝐹𝑋 𝑖 𝑟 𝑥interchangeably to represent the conditional distributionfunction of the time to the first failure of 𝑖th component.Considering components’ time to the first failures distributionfunctions and assuming conditional independency ofcomponents’ failure processes, the conditional distributionfunction of the time to the first of the product under usage rate𝑟 will be as follows:𝑋𝑆 (𝑟) min(𝑋1 (𝑟), , 𝑋𝐾 (𝑟))𝐹𝑋 𝑆 (𝑟) 𝑥; 𝚨, 𝚩 1 𝑈0 𝑊1𝑟 𝑅𝑅 𝑟1(𝑛)𝑥; 𝛼𝑖 (𝑟), 𝛽𝑖 (𝑟) 𝐹𝑋 𝑖 𝑟𝑛 𝑥; 𝛼𝑖𝑖 1, , 𝐾𝑊0 𝐹𝑅 𝑟1 𝐹𝑅 𝑟0parameter 𝛼𝑖 and shape parameter 𝛽𝑖 . Then, based on theAFT model, the distribution of 𝑋𝑖 𝑟 𝑋𝑖 𝑅 𝑟 , the timeto the first of this component under usage rate 𝑟 , will be asfollows:𝐹𝑋 𝑖𝑊0 𝑊1𝐶𝑖 𝑥 𝑟 𝑐𝑖0 𝑐𝑖 𝑥 𝜔 𝑖 (𝑟𝑥)𝜉 𝑖 , 𝑖 1, , 𝐾(8)where, 𝑐𝑖0 is the fixed cost of performing a minimal repair on𝑖th component and 𝑐𝑖 , 𝜔𝑖 and 𝜉𝑖 are real positive numberswhich their values can be estimated using the failure history of𝑖th component. It is worth to mention that the primary versionof this cost function is introduced by Chattopadhyay andMurthy [32] and later extended and used by Shahanaghi et al.[19] and Heydari et al. [20] for two-dimensional case.Consequently, the conditional expected cost of failurerectifications of 𝑖th component during the time interval [𝑎, 𝑏],under usage rate 𝑅 𝑟 , will be as follows:250
INTERNATIONAL JOURNAL OF MATHEMATICAL MODELS AND METHODS IN APPLIED SCIENCES𝐸 𝐶𝑖 𝑎, 𝑏 𝑟𝑏𝑎 𝐶𝑖 𝑥 𝑟 𝑋 𝑖𝑟𝑥 𝑑𝑥 , 𝑖 1, . . , 𝐾C. Proposed Mathematical model for a special caseLet 𝑅, consumers usage rate random variable, follows froma Dagum distribution with scale parameter 𝛼𝑅 and shapeparameters 𝛽𝑅 and 𝑘𝑅 . The time to the first failure of 𝑖thcomponent, 𝑖 1, , 𝐾 under nominal usage rate 𝑟𝑛 i.e.𝑋𝑖 𝑟𝑛 also assumed to be follows from a Weibull distribution(𝑛)(𝑛)with shape parameter 𝛼𝑖 and scale parameter 𝛽𝑖 . In such asituation, 𝐹𝑅 (𝑟) and 𝑓𝑅 (𝑟), CDF and PDF of usage rate, and𝐹𝑋 𝑖 (𝑟) , conditional time to the first failure of 𝑖th component,will be as follows:(9)As a result, the conditional expected servicing cost of theproduct with 𝐾 heterogeneous components during the timeinterval [𝑎, 𝑏] will be:𝐾𝐸 𝐶𝑆 𝑎, 𝑏 𝑟𝑏 𝑏𝑖 1 𝑎𝐾 𝑎 𝑖 1𝐶𝑖 𝑥 𝑟 𝑋𝑖𝑟𝑥 𝑑𝑥(10)𝐶𝑖 𝑥 𝑟 𝑋𝑖𝑟𝑥 𝑑𝑥Finally, considering the usage rate scenarios in equations(1) and (2) and its corresponding probabilities of occurrencesand by removing the conditioning on 𝑅 𝑟, the overallexpected servicing cost of tjhe product during the EW periodwill be as follows:𝐸 𝐶 Ω𝐸𝑊 𝑟0 𝑟1r0 𝐹𝑅 𝑟00𝑊0 𝑊1𝑊0 𝑈0𝐾 𝑊1𝑟𝑟1𝑟0𝑈0𝑟 𝑅𝑅 𝑟1r1 𝐹𝑅 𝑟10𝑊0 𝑈 𝐾𝑊0 1𝑟𝑟1𝑈0𝑟 𝑅𝑅 𝑟0r0(𝑛)𝑥 𝑔(𝑟)𝑑𝑥𝑑𝑟where 𝛼𝑖 𝑟 𝛼𝑖𝑟, 𝑟, 𝛼𝑅 , 𝛽𝑅 , 𝑘𝑅 0𝛽𝑅 𝑘 𝑅 1𝑟𝛼𝑅𝛽𝑅 𝑘 𝑅 1𝑟𝑛 𝛾 𝑖𝑟 𝐹𝑋 𝑆 (𝑟) 𝑥 1 𝑒𝑟𝐾𝐾𝑟𝛽𝑖𝛼𝑖 𝑟𝐾𝑥 𝑔(𝑟)𝑑𝑥𝑑𝑟 𝑋 𝑆 (𝑟) 𝑥 𝑖 1𝑖 1(12)𝐶𝑖 𝑥 𝑟 𝑋 𝑖𝑟𝑟𝑥 𝑔(𝑟)𝑑𝑥𝑑𝑟𝑖 1It is clear that in the provided equations in (11) and (12), if𝐶𝑖 𝑥 𝑟 , 𝑖 1, , 𝐾 is replaced with 1, the overall expectednumber of product’s failures during the EW period will beobtained. As seen, in the provided EW cost model, the type offailed component, its age and usage at the time of failure aswell as the usage rate of consumer are incorporated. To thebest of authors’ knowledge, for a first time in EW literaturethis is done in this paper.In the next subsection, for a special case where thedistributions of consumers’ usage rate and the time to the firstfailures of components are Weibull, the presentedformulations are evaluated.Issue 3, Volume 7, 2013(𝑛 )𝑖𝑖 1, , 𝐾(𝑛)(15) 𝛽𝑖 . The conditional 𝐾𝑖 1𝑥 𝛽𝑖𝛼𝑖 𝑟(16)𝑥𝛼𝑖 𝑟𝛽𝑖𝛼𝑖 𝑟𝛽 𝑖 1𝑥𝛼𝑖 𝑟𝑒 𝐾𝑖 1𝑥 𝛽𝑖𝛼𝑖 𝑟(17)𝛽𝑖 1(18)Finally, the expected overall cost of EW servicing for eachproduct are obtained as follows:𝑥 𝑔(𝑟)𝑑𝑥𝑑𝑟𝐶𝑖 𝑥 𝑟 𝑋 𝑖𝛽𝑥𝛼𝑖 𝑟(14)𝑥 𝑔(𝑟)𝑑𝑥𝑑𝑟𝑖 1𝐶𝑖 𝑥 𝑟 𝑋𝑖, 𝑟, 𝛼𝑅 , 𝛽𝑅 , 𝑘𝑅 0and 𝛽𝑖𝑥 𝑔(𝑟)𝑑𝑥𝑑𝑟𝐶𝑖 𝑥 𝑟 𝑋 𝑖(13)CDF, PDF and hazard function of the product also are givenby𝑓𝑋 𝑆 (𝑟) 𝑥 𝑖 1𝑈0 𝑈1 𝐾 𝑟 𝑟𝑈0𝑟𝑟𝑖 1𝑊0 𝑊1 𝐹𝑅 𝑟0 𝐹𝑅 𝑟1𝑟0𝐶𝑖 𝑥 𝑟 𝑋 𝑖(11)𝐸 𝐶 Ω𝐸𝑊 𝑟1 𝑟0𝑟𝛼𝑅𝛽𝑅 𝑘𝑅𝐹𝑋 𝑖 (𝑟) 𝑥; 𝛼𝑖 𝑟 , 𝛽𝑖 1 𝑒𝐶𝑖 𝑥 𝑟 𝑋 𝑖𝑈0𝑟 𝛽 𝑅 𝑘 𝑅𝛼𝑅 1 𝐾𝑖 1𝑈0 𝑈1 𝐾 𝑟 𝑟r1𝑓𝑅 𝑟 𝑖 1 𝐹𝑅 𝑟1 𝐹𝑅 𝑟0𝑟𝛼𝑅𝐹𝑅 𝑟 1 251
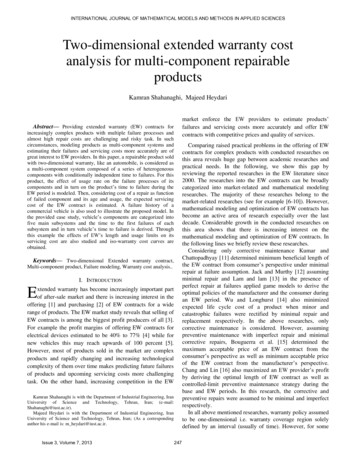
INTERNATIONAL JOURNAL OF MATHEMATICAL MODELS AND METHODS IN APPLIED SCIENCES𝐸 𝐶 Ω𝐸𝑊 𝑟0 𝑟1 𝑘 𝑅𝑟0 𝛽𝑅 1 𝛼𝑅 r00𝑊0 𝑊1𝑖 1𝛽𝑖𝛼𝑖 𝑟 𝑐𝑖 𝑥 𝜔 𝑖 (𝑟𝑥)𝜉 𝑖 1 𝑟1𝛽𝑅 𝑘𝑅 𝛽 𝑅 𝑘 𝑅𝑈0 𝑊1 𝐾𝑟𝑈0𝑟𝑟0𝑟1𝛼𝑅𝑟𝛼𝑅 𝑟1𝛽𝑅 𝑘𝑅 𝑟𝛼𝑅𝛼𝑅𝛽 𝑅 𝑘 𝑅 1𝑑𝑥𝑑𝑟𝛽𝑖𝛼𝑖 𝑟𝑥𝛼𝑖 𝑟𝛽 𝑖 1𝛽𝑖𝛼𝑖 𝑟𝑥𝛼𝑖 𝑟𝛽 𝑖 1(19)𝑑𝑥𝑑𝑟 𝛽 𝑅 𝑘 𝑅𝑐𝑖0 𝑐𝑖 𝑥 𝜔 𝑖 (𝑟𝑥)𝜉 𝑖𝑖 1𝛽 𝑅 𝑘 𝑅 1𝑟1 𝛼𝑅𝛽 𝑅 𝑘 𝑅 1 𝛽 𝑅 𝑘 𝑅𝑟0𝛼𝑅𝑐𝑖0 𝑐𝑖 𝑥 𝜔 𝑖 (𝑟𝑥)𝜉 𝑖𝑈0 𝑈1 𝐾 𝑟 𝑟𝑈0𝑟𝑟𝛼𝑅 1 𝛼𝑅 1 𝛽 𝑅 𝑘 𝑅 1𝑟0𝛼𝑅 1 1 𝑟𝛽𝑅 𝑘𝑅 𝛼𝑅𝛽 𝑖 1𝑖 1𝛽 𝑅 𝑘 𝑅 1𝑟1 𝛼𝑅𝛼𝑅𝑥𝛼𝑖 𝑟𝛽 𝑅 𝑘 𝑅 1𝑑𝑥𝑑𝑟𝐸 𝐶 Ω𝐸𝑊 𝑟1 𝑟0 𝑘 𝑅𝑟1 𝛽𝑅 1 𝛼𝑅 r10𝑊0 𝑊1 𝐾𝑊0𝛽𝑖𝛼𝑖 𝑟 𝑐𝑖 𝑥 𝜔 𝑖 (𝑟𝑥)𝜉 𝑖 1 𝑟0 𝑟0𝛼𝑅𝑟𝛽𝑅 𝑘𝑅 𝛼𝑅𝑟0 𝑈0 𝑈1 𝐾 𝑟 𝑟𝑈0𝑟𝑟𝛽𝑅 𝑘𝑅 𝛼𝑅𝛼𝑅 1 1 𝑟𝛼𝑅 1 𝛼𝑅𝑟1𝛼𝑅𝛽 𝑅 𝑘 𝑅 1𝑑𝑥𝑑𝑟𝛽𝑖𝛼𝑖 𝑟𝑥𝛼𝑖 𝑟𝛽 𝑖 1𝛽𝑖𝛼𝑖 𝑟𝑥𝛼𝑖 𝑟𝛽 𝑖 1In the first step, the primary evaluation of failure datashowed that the number of vehicles with more than one claimis negligible so they are ignored in subsequent analysis. Then,to visualize data and help in model building, a scatter plot offailure times and corresponding total usages as well asmarginal histograms are plotted (see Fig 2).As one can see, the provided scatter plot shows that age andusage are positively correlated and their marginal histogramsare positively skewed. In order to build two-dimensionalfailure model, the distribution function of consumers’ usagerate is estimated. To do this, for failed vehicles usage rates i.e.𝑢𝑟𝑖 𝑖 (104 Km / year) , 𝑖 1, ,682 are calculated where 𝑥(20)𝑑𝑥𝑑𝑟 𝛽 𝑅 𝑘 𝑅𝑐𝑖0 𝑐𝑖 𝑥 𝜔 𝑖 (𝑟𝑥)𝜉 𝑖𝑖 1𝛽 𝑅 𝑘 𝑅 1𝑟𝛼𝑅𝛽 𝑅 𝑘 𝑅 1 𝛽 𝑅 𝑘 𝑅𝑐𝑖0 𝑐𝑖 𝑥 𝜔 𝑖 (𝑟𝑥)𝜉 𝑖𝛽 𝑅 𝑘 𝑅 1𝑟0𝛼𝑅 1 1 𝑟𝛽𝑅 𝑘𝑅 𝛼𝑅𝛽 𝑖 1𝑖 1𝛽 𝑅 𝑘 𝑅 1𝑟𝛼𝑅 1 𝛼𝑅 𝑥𝛼𝑖 𝑟 𝛽 𝑅 𝑘 𝑅𝑈𝑊0 1 𝐾𝑟𝑈0𝑟𝑟1𝑐𝑖0𝑖 1𝛽 𝑅 𝑘 𝑅 1NUMERICAL EXAMPLE ON AUTOMOBILE WARRANTY DATAAutomobile is the most well-known example of a multicomponent repairable product with widely offered twodimensional EW contracts. Therefore, in order to illustrate theproposed model, we use the failure history of a commercialvehicle produced in a plant in Iran to reproduce a numericalexample. For studied vehicle, the manufacturer provides twodimensional base warranty with length 𝑊0 3 years and totalusage 𝑈0 20 ( 104 𝐾𝑚) and warranty expires when theage or usage of vehicle exceeds three years or 200,000kilometer respectively, whichever occurs first. During the firsttwo years of the base warranty period i.e. our observationperiod, from 11200 vehicles under coverage 682 vehicles werefailed. For failed vehicles information on VIN, date of sale,date of failure, km at failure, failed component, cause offailure, failed components supplier and etc were recorded.However, no information on service agent, servicing costs andusage environments were available.Based on the available failure data the following steps areconducted to illustrate the model. Preliminary analyze the data and provide somegraphical representations to extract neededinformation in building intended models. Estimate the consumers’ usage rate distributionfunction and its parameters Categorize the vehicle failures into five mainsubsystems failures Categorize the consumers into three groups based ontheir usage rate Estimate the conditional distributions of the time tothe first failures of subsystems Model and estimate the studied vehicle’s expectedservicing cost under different EW contracts Analyze the effect of EW’s length and usage on theservicing cost and drive iso-warranty cost curves𝑐𝑖0𝑊0 IV.𝐾𝑥𝑖and 𝑢 are age and usage of vehicles at the time of failures.Then, fifteen different parametric distributions are fitted on theusage rate data and their adjusted Anderson–Darling (AD)statistics are calculated. These distributions and their ranks inthe well fitting of consumers’ usage rate based on the ADstatistics are presented in Table 1.𝑑𝑥𝑑𝑟Issue 3, Volume 7, 2013252
INTERNATIONAL JOURNAL OF MATHEMATICAL MODELS AND METHODS IN APPLIED SCIENCESTotal usage (*10000 Km)12.510.07.55.02.50.00.00.40.81.21.6Time to the first failure of the studied vehicle (Year)Fig 3: Probability plot of Dagum distribution functionFig 2: plot and marginal histograms of failure times and usages of thestudied vehicleprocesses are nearly impossible. Therefore, we model thefailure process of the vehicle at subsystems level and treateach subsystem as a component. To do this, we consider thevehicle as a series system composed of following five mainsubsystems: (1) engine, (2) transmission and drive axle, (3)steering, suspension, wheels and brakes, (4) body (includingchassis frame and body) and (5) electrical subsystem. Then,regarding the failed component, we categorize vehicle failuresinto five mentioned subsystems’ categories. The scatter plot ofthe time to the first failures and corresponding usages for thesesubsystems are depicted in Fig 4.Table 1: Fitted distributions on consumers’ usage rate and theirAnderson–Darling umNakagami3-Parameter WeibullGeneralized extreme valueWeibull3-Parameter LognormalGamma3-Parameter LoglogisticLogisticNormalLoglogistic2-Parameter ExponentialExponentialLognormalSmallest Extreme ValueAD 7.32612.22718.94319.24620.22224.499Scatterplot of subsystms' usages versus time to failures0.0Subs 1 Usage*Subs 1 TTF0.81.6Subs 2 Usage*Subs 2 TTFSubs 3 Usage*Subs 3 TTF129630Subs 4 Usage*Subs 4 TTFSubs 5 Usage*Subs 5 TTF120.00.81.696As seen in Table 1, Dagum distribution function with scaleparameter αR 12.455 and shape parameters βR 6.6652and k R 0.13956 is the best fitted distribution on theconsumers’ usage rate random variable . In order to validatewhether the consumers’ usage rate follows from Dagumdistribution function or not, Anderson-Darling, KolmogorovSmirnov and Chi-Square goodness of fit tests are performed.The results show that, all tests do not reject the nullhypothesis, i.e. 𝐻0 : consumers’ usage rate follows fromDagum distribution, at 0.01 up to 0.2 significant levels. Theprobability plot of Dagum distribution function withmentioned parameters is depicted in Fig 3.It is worth to note that in researches reported in theliterature, distributions like Uniform, Weibull, lognormal,Gamma and Normal were cons
servicing cost are also studied and iso-warranty cost curves are obtained. Keywords — Two-dimensional Extended warranty contract, Multi-component product, Failure modeling, Warranty cost analysis. I. I. NTRODUCTION. xtended warranty has become increasingly important part of after-sale market and there is increasing interest in the