Transcription
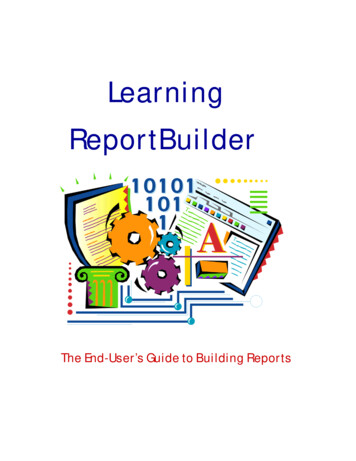
LearningReportBuilderThe End-User’s Guide to Building Reports
Copyright by Digital Metaphors Corporation
iCONTENTSINTRODUCTIONDesign . 1Preview . 1Data . 1About this book . 2A QUICK TEST SPINOverview . 3Getting Started . 3Query Wizard . 3Design Workspace . 4Preview . 7Fixes . 7CALISTHENICSOverview . 9Component Creation . 9Band Adjustment . 10Basic Component Selection . 10Docking Toolbars . 11Sizing, Aligning, and Positioning Components . 13Front-to-Back Order . 16Advanced Component Selection . 18Advanced Sizing 1 . 8Speed Menu. 19Data Tree . 22SUMMARY TUTORIALOverview . 29Query Wizard . 29Design Workspace . 30Preview . 32Fixes. 32
iiCOVER PAGEOverview . 33Design Workspace . 33Preview . 35SIMPLE TABLE LISTINGOverview . 37Query Wizard . 37Design Workspace . 38INVOICEOverview . 41Establish the Basic Design. 41Fit and Finish . 47ORDER SUMMARYOverview . 51Define a Master-Detail Relationship . 51Modify the Basic Report Layout . 56DETAILED ORDER SUMMARYOverview . 59Report Layout. 59MAILING LABELOverview . 65The Label Template Wizard . 65Prepare a Template Manually . 69FISH PHOTO ALBUMOverview . 73Build the Report Layout . 73Fit and Finish . 76
iiiSALES STATISTICSOverview . 79Establish the Basic Layout . 79Modify the Basic Report Layout . 81Fit and Finish . 84FORM LETTEROverview . 87Build the Report . 88FISH REFERENCE BOOKLETOverview . 93Build the Report Layout. 93Fit and Finish . 99CROSSTABOverview . 105Extend the Crosstab Design . 108Understanding Crosstab Layouts . 110APPENDIX A: TOOLBARSOverview . 113Nudge Toolbar . 114Size Toolbar . 115Draw Toolbar . 116Align or Space Toolbar . 117Standard Component Palette . 118Data Component Palette. 119Advanced Component Palette . 120Report Tree . 121Data Tree . 122Standard Toolbar . 123Format Toolbar . 126Edit Toolbar. 125Glossary . 127
ivGLOSSARYA-Z . 127-136INDEXA-Z . 137-139
IntroductionINTRODUCTIONWelcome to Learning ReportBuilder, a series oftutorials developed to teach you how to create stunning reports. The tutorials begin with the basics,such as how to use the Report Designer, and endwith advanced reporting techniques like crosstabcreation. This guide should therefore be helpful toboth the novice and the seasoned report-builder.manipulate the canvas. The canvas is the area thatcontains the report layout. This is where we placethe bands and components that will ultimately control the content of each page of the report.PREVIEWThe preview tab plays an integral role in the reportcreation process because it allows you to see howthe report will look when printed. As you workthrough the tutorials, you'll notice that this workspace is frequently accessed so that we can see howthe report is shaping up. We will make manychanges and corrections based on what we see inthis workspace. The tools in this space allow youto view each page of the report or zoom in to get abetter look at a specific page. You can also printthe report from the preview workspace.DATADESIGNThe Report Designer, pictured above, is the application you will use to build reports. It containsthree workspaces: Data, Design, and Preview.When first displayed, the Report Designer defaultsto the design workspace because this is where youwill spend the majority of your report-buildingtime. The design workspace is divided into twoareas: the workbench and the canvas. The workbench is comprised of toolbars, component palettes, rulers, and other tools that can be used toThe data workspace is often the key to successfulreport creation because it allows us to select andmanipulate the data needed for a given report.These tasks are accomplished via two visual tools:the Query Wizard and the Query Designer. Thesetools greatly simplify the often-difficult task ofdata selection by giving us the ability to select datawithout requiring an in-depth knowledge of databases.1
2IntroductionOnce the data is selected, we can begin laying outthe report. The primary purpose of a report is totransform raw data into information. Our task asreport-builders is essentially to make data meaningful. The following tutorials will show you howto do just that.ABOUT THIS BOOKAs you work through this guide, it is important tokeep in mind that the tutorials build on oneanother, moving from basic concepts to complexreports. Therefore, it may be difficult to completean advanced tutorial without having first completed earlier tutorials. Each tutorial producessome kind of report and brings to light importantaspects of ReportBuilder.A Quick Test Spin gives you a glimpse of theReport Designer's report-building potential.Calisthenics offers a series of exercises that prepare you for the tutorials. You will be a nimbleuser when you complete the calisthenics.The Summary Tutorial concentrates all that youlearned in Calisthenics into a report. Like the tutorials that follow, it gives you an opportunity to useall the tricks you learned in Calisthenics.The Cover Page tutorial illustrates the ease withwhich you can design a cover page so that thereport looks clean and professional.The Simple Table Listing tutorial shows you howto build a report using the Report Wizard and introduces some ways to handle repeating data.The Invoice tutorial illustrates how to export saveddata so that you can use it for a new report and presents the concept of groups.The Mailing Label tutorial introduces the LabelTemplate tool, which allows you to create labelswith ease.The Fish Photo Album shows you how to create acolorful report using the DBImage component andintroduces some concepts in relation to components and the way they work.The Sales Statistics tutorial teaches the differencebetween data and information and further developsthe concept of groups.The Form Letter tutorial shows you how to set up aletter for mass mailing.The Fish Reference Booklet illustrates how to create a report with side-by-side memos and introduces regions.The Crosstab tutorial offers a report in the form ofa spreadsheet, which is useful when a large amountof data needs to be analyzed.Appendix A describes the toolbars and their contents in detail.The glossary provides definitions for terms you'llencounter as you work through the tutorials.
A Quick Test SpinA QUICK TEST SPINOVERVIEWGETTING STARTEDThis simple exercise provides an introduction tothe Report Designer, the Query Wizard, and theprocess of building reports. The purpose of thistutorial is to show you what it takes to build areport, so if this exercise starts to feel a little overyour head, don't worry. We will cover the meaningbehind the actions in later tutorials. The finalreport for this tutorial should contain the followingitems:It will be helpful for you to become familiar withthe following set of directions because you'll repeatthis process to begin each report. A list of company names A contact name for each company A phone number for each contact1 Click the New Report icontoolbar.on the main2 Click on the Data tab.3 Select File New in order to access the NewItems dialog.4 Double-click on the Query Wizard icon. TheQuery Wizard will come up with a list of AvailableTables.QUERY WIZARDThe Query Wizard is a tool that allows you toaccess information from your database to use inyour report.1 Choose the Customer Table by double-clickingon it. The Customer table should now appear inthe list of Selected Tables.2 Once the Customer table is selected, click theNext button.3 Keep clicking the Next button until you reachthe screen with the Set Order option.Note: If this tutorial seems too difficult, proceedto Calisthenics and go through it first, then returnto this tutorial.3
4A Quick Test Spin4 Click on the Set Order button.5 Double-click on Customer.Company so itappears in the list of Selected Fields.Task 1Place and Name Labels1 Locate the label iconon the toolbar.6 Click Finish.2 Click on the icon.7 You've officially completed your first query viathe Query Wizard. You'll notice a new window inthe upper left-hand corner of the data workspace.This is a dataview. It represents the data, which isselected from the database each time the report isgenerated.8 Click on the Design tab in order to begin layingout your report.DESIGN WORKSPACEThe design workspace is the environment in whichyou will build reports. Whatever you put in theheader band (the white space above the word'Header') will appear at the top of each page of thereport; whatever you put in the detail band will bethe body of the report, and whatever you put in thefooter band will appear at the bottom of each pageof the report.3 Click in the white space of the header band inorder to create a label.4 Create two more labels in the header band.5 Select 'Label1'.6 Locate the edit toolbar (below the label component icon on the toolbar). It should contain the text'Label1', which is the caption of the currentlyselected label.7 Highlight the text in the edit toolbar and typeCompany.8 Select Label2 and type Contact Name into theedit toolbar.9 Select Label3 and type Phone No. into the edittoolbar.Task 2Save the Report1 Press Ctrl S to save your work.2 A dialog box will appear that looks like this:
A Quick Test Spin3 Expand the drop-down list at the top of this dialog by clicking on the arrowicon. Select 'AllFolders' from the list. This will allow us to savethe report in this folder.Task 4Create and Choose Data for DBTextComponents1 Locate the DBText icon4 At the bottom of the dialog you should see anedit box that contains the report name. The defaultname is 'New Report.' Select the text and changethe name to 'Quick Test'. Click the Save button.on the toolbar.2 Place a DBText component in the detail band.3 Change the text from bold to regular by clickingon the bold icon.5 Close the Report Designer. Notice that yournew report is listed in 'All Folders'.4 Place two more DBText components in thedetail band.6 Double-click on Quick Test to return to thedesign workspace.5 Select DBText1.Task 3Bold the Text in the Labels1 Select the Company label.2 Hold down the Shift key and then click on theother two labels. All three labels should now beselected. You can tell that they are selected by thesmall gray boxes surrou
nents and the way they work. The Sales Statistics tutorial teaches the difference between data and information and further develops the concept of groups. The Form Letter tutorial shows you how to set up a letter for mass mailing. The Fish Reference Booklet illustrates how to cre-ate a report with side-by-side memos and intro- duces regions. The Crosstab tutorial offers a report in the form of .
