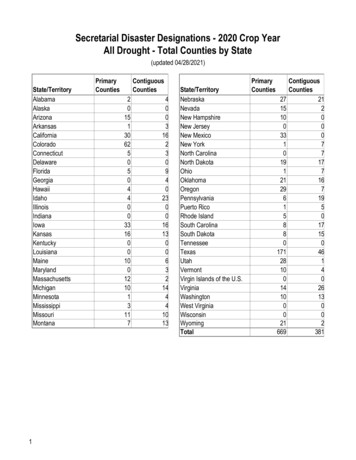
Transcription
Demographic Characteristics andTrends, Texas and Bexar CountyMasters LeadershipProgramOctober 8, 2013San Antonio, Texas
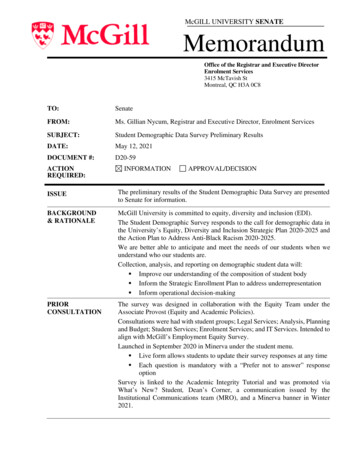
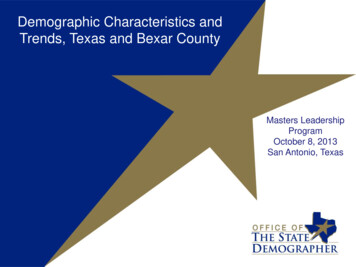
Growing States, 2000-20102000Population*United 531,501,20018.3%North 30,6326,392,0171,261,38524.6%65% (2.8 million) of this change can be attributed to growthof the Hispanic populationPopulation values are decennial census counts for April 1 for 2000 and 2010.Source: U.S. Census Bureau. 2000 and 2010 Census Count.2
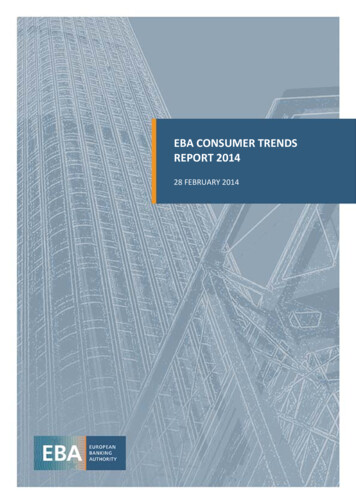
Total Population and Components ofPopulation Change in Texas, 1950-2012Percent ChangeDue 0.654.9445.06201226,059,203913,6423.652.0547.95* All values for the decennial dates are for April 1st of the indicated census year. Values for 2011 are for July 1 as estimated by theU.S. Census Bureau.Source: Derived from U.S. Census Bureau Estimates for dates indicated by the Texas State Data Center, University of Texas at San Antonio.Note: Residual values are not presented in this table.3
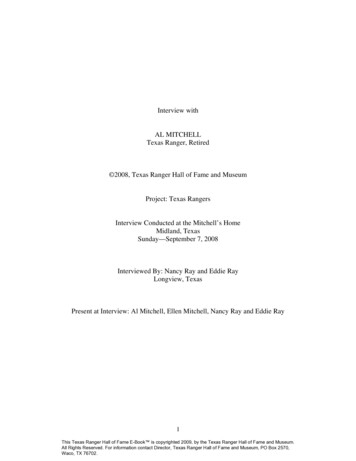
LegendTotal Estimated Population by County, 53,700Along and east of I-35:40% of land86% of population92% of population growth (2011-2012)Source: U.S. Census Bureau 2012 Population Estimates4
Change of the Total Population by County, 2000 to2010Legendco48 d00'PROJECTIONS X '.totpopch0010-3,200 - 079 counties lostpopulation over thedecade1 - 10,00010,001 - 50,00050,001 - 100,000100,001 - 700,000Source: U.S. Census Bureau 2000 and 2010 Census Counts5
LegendChange of the Total Population by County, 2010 to 2012tl 2010 48 county10popchg4201072012LT 01-1,0001,001-20,00096 counties lostpopulation over thetwo year period20,001-80,00080,001-161,252Of counties that lost population90% had net out migration47% had natural declineSource: U.S. Census Bureau Population Estimates, 2012 Vintage.6
The 10 Fastest Growing Metro AreasIncrease from July 1, 2011, to July 1, 2012PercentIncrease1.Midland, Texas4.62.Clarksville, Tenn.-Ky.3.73.Crestview-Fort Walton Beach-Destin, Fla.3.64.The Villages, Fla.3.45.Odessa, Texas3.46.Jacksonville, N.C.3.37.Austin-Round Rock, Texas3.08.Casper, Wyo.3.09.Columbus, Ga.-Ala.2.910.Manhattan, Kan.2.8Source: U.S. Census Bureau, 20127
The 10 Counties with the Largest NumericIncrease from July 1, 2011, to July 1, 2012NumericIncrease1.Harris, Texas80,0052.Los Angeles, Calif.73,7643.Maricopa, Ariz.73,6444.Dallas, Texas45,8275.San Diego, Calif.38,8806.King, Wash.35,8387.Travis, Texas34,3818.Orange, Calif.34,0179.Tarrant, Texas32,99710.Clark, Nev.32,833Source: U.S. Census Bureau, 20138
Texas Total Nonfarm EmploymentQuarterly GrowthSAAR - Seasonally Adjusted Annual Rate9
Estimated domestic migration byLegendcounty, 2000-2010tl 2010 48 county10Compoch .domig-280,000 to --3,000-2999 to 01- 10,00010,001 - 50,00050,001 - 100,000100,000 - 220,000Source: Population Division, U.S. Census Bureau, 2012. Map produced by theTexas State Data Center10
Legend Estimated international migration by county, 2000-2010tl 2010 48 county10Compoch .inmig-1,400 to 01 to 500501 to 2,5002,501 to 50,00050,000 to 280,000Source: Population Division, U.S. Census Bureau, March 19, 2009. Map producedby the Texas State Data Center11
12
n.html13
n.html14
n.html15
n.html16
Texas Racial and Ethnic Composition,2000 and 201020002010Hispanicor Latino32%Hispanicor Latino38%NHWhite53%NHOther4% NH Black11%Source: U.S. Census Bureau. 2000 and 2010 Census countNHOther6%NHWhite45%NH Black11%
0AgeUnder 1 year4 years8 years12 years16 years20 years24 years28 years32 years36 years40 years44 years48 years52 years56 years60 years64 years68 years72 years76 years80 years84 years88 years92 years96 years100 to 104 PopulationTexas White (non-Hispanic) andHispanic Populations by Age, 2010250000200000White (non-Hispanic)150000Hispanic10000050000Source: U.S. Census Bureau 2010 Decennial Census, SF118
Texas Population Pyramid by Race/Ethnicity, 2010NH White MaleHispanic MaleNH Black MaleNH Asian MaleNH Other MaleNH White FemaleHispanic FemaleNH Black FemaleNH Asian FemaleNH Other Female100 to 104 years95 years90 years85 years80 years75 years70 years65 years60 years55 years50 years45 years40 years35 years30 years25 years20 years15 years10 years5 yearsUnder 1 year200,000150,000Source: U.S. Census Bureau 2010 Decennial Census, SF1100,00050,000050,000100,000150,00019200,000
Racial and ethnic composition Bexar County, Texas andthe United States, 2007-2011.Bexar CountyTexasUnited 210024,774,187100306,603,772100Hispanic (any race)985,32958.49,216,24037.249,215,56316.1White 4.2Black Asian (nonHispanic)37,0602.2927,0233.714,333,0344.7Other urce: U.S. Census Bureau, 2007-2011 American Community Survey, DP0520
Percent of the population that is minorityrace/ethnicity by block group, 201021
Percent of students participating in bilingualeducation by school district, 2011Source: Texas Education Agency, 201222
Percent of the CLF employed in management,business, science, and arts, Census Tracts, 2007-2011LegendACS 11 5YR TRACT 48 TEXASDP3 HC03 VC41 Percent; OCCUPATION - Management, business, science, and0-20%21-30%31-45%46-60%61-100%23Source: U.S. Census Bureau, American Community Survey, 5-Year Sample, 2007-2011
Percent of the CLF employed in natural resources,construction, and maintenance, Census Tracts, 2007-2011LegendACS 11 5YR TRACT 48 TEXASDP3 HC03 VC44 Percent; OCCUPATION - Natural resources, construction, and m0-10%11-20%21-30%31-40%41-53%24Source: U.S. Census Bureau, American Community Survey, 5-Year Sample, 2007-2011
Median Household Income by County, 2005-2009 18,000-30,000 30,000-35,000 35,000-40,000 40,000-50,000 50,000-76,000Source: U.S. Census Bureau, American Community Survey, 5-Year Sample 2005-2009
Percent of households with annual income greaterthan 200,000, Census Tracts, 2007-20011LegendACS 11 5YR TRACT 48 TEXASDP3 HC03 VC84 Percent; INCOME AND BENEFITS (IN 2011 %26Source: U.S. Census Bureau, American Community Survey, 5-Year Sample, 2007-2011
Percent of households with annual incomeless than 10,000, Census Tracts, 2007-20011LegendACS 11 5YR TRACT 48 TEXASDP3 HC03 VC75 Percent; INCOME AND BENEFITS (IN 2011 INFLATION0-5%5.1-10%10.1-20%20.1-35% 35%27Source: U.S. Census Bureau, American Community Survey, 5-Year Sample, 2007-2011
Mean travel time (minutes) towork, Census Tracts, 2007-2011LegendACS 11 5YR TRACT 48 TEXASDP3 HC01 VC36 Mean travel time to work5 - 2021-3031-4546-6061-10728Source: U.S. Census Bureau, American Community Survey, 5-Year Sample, 2007-2011
Percent of population aged 25 years and olderwith Bachelors degree or higher. 2005-2009Percent 25 with Bachelors6-15%15-20%20-25%25-35%35-50%Source: U.S. Census Bureau, American Community Survey, 5-Year Sample 2005-2009
Educational Attainment in Texas, 2011Level of EducationalAttainmentHigh school diploma orequivalency or greaterBachelors or greaterPercent ofpersons aged25 years andolder81.1%26.4%Source: U.S. Census Bureau, American Community Survey, One-year Sample, 2011.StateRanking48/49/50(tied with CAand MS)2930
Race/Ethnic Composition by Education Level in theLabor Force (aged 25 years and more), Texas, 20093%9%19%15%6%8%67%71%Less Than High SchoolCollege and GreaterSource: Derived from 2009 American Community Survey 1-Year Estimates by the Office of the State Demographer. 31
Projected Population Growth in Texas, 2010-2050Migration Scenarios60,000,000Zero55,000,000.5 of 2025Source: Texas State Data Center 2012 Population Projections2030203520402045205032
Projected Racial and Ethnic Percent, Texas, r5,000,0000Source: Texas State Data Center 2012 Population Projections , 2000-2010 Migration Scenario33
Projected Population Change, Texastl 2010 48 county10Counties, 2010-2050LegendF6-6,200 - 01 - 2,0002,001 - 10,00010,001 - 100,000100,001 - 1,000,0001,000,001 -3,480,000Source: Texas State Data Center 2012 Population Projections . 2000-2010 Migration Scenario34
ProjectedPercentPopulationLegendChange, Texas Counties, 2010-2050tl 2010 48 county10F5LT 0%0-40%41-100%101-250%251-500%Source: Texas State Data Center 2012 Population Projections . 2000-2010 Migration Scenario35
36
37
Texas ReservoirsOctober 2013Source: ide38
39Source: New York Times 2011/05/01 Week in Review
Teen Birth Rate by State, 2010RankState7MississippiNew ict of Columbia9West VirginiaAlabama12345610Birth rate per 1,000women ages 15-19Source: National Center for Health Statistics at the Centers for Disease Control and Prevention5552.952.552.250.447.746.245.444.843.640
2010 Birth Rates by Zip Code & School DistrictBoundaries (Births per 1,000 females ages 15-19)Zip Codes with 5 births are not includedSource: http://www.healthyfuturestx.org41
Teen Birth Rates (females ages 15-19)1994 - 2010Source: http://www.healthyfuturestx.org42
Projected Increase in Obesity in Texas byEthnicity, 2006 to 2040Source: Office of the State Demographer projections, using 2000-2004 migration scenario population projections43
Prevalence of Unhealthy Weight Children bySchool District-Bexar County 2011-12Total testedUnhealthyweightPercentunhealthyweightEAST CENTRAL ISD4,8372,34048.4%EDGEWOOD ISD5,8413,33557.1%87327831.8%JUDSON ISD10,5734,55743.1%NORTH EAST ISD46,80318,34239.2%NORTHSIDE ISD53,23222,28541.9%SAN ANTONIO ISD23,71112,75153.8%SOMERSET ISD1,24770156.2%SOUTH SAN ANTONIO ISD5,4913,05855.7%DistrictFT SAM HOUSTON ISDIn 2011-2012 school year: a Healthy Weight equals BMIs ranging from 13.9 to 25.1 in boys and from 13.6 to 25.1 in girls (across age and fromthe low to the high end of the Healthy Fitness Zone)FITNESSGRAM includes Grades 3-12 *Unit of measure for BMI is kg-m2 Analysis by San Antonio Health Department44FERPA masked scores, which occur when there are fewer than 5 students in any category, have not been counted in these calculations.Total152,60867,64744.3%
Demographics and Destiny45
ContactLloyd B. Potter, Ph.D.Office: (210) 458-6530 or (512) 463-8390Email: Lloyd.Potter@UTSA.eduInternet: http://osd.state.tx.us46
Masters Leadership Program October 8, 2013 San Antonio, Texas Demographic Characteristics and Trends, Texas and Bexar County . Growing States, 2000-2010 2 2000 Population* . University of Texas at San Antonio. Note: Residual values are not presented in this table. Total Population and Components of