Transcription
CLS STXM and PtychographyData AnalysisDr. Jian Wang10ID-1 Spectro-Microscopy BeamlineCanadian Light SourceUniversity of SaskatchewanDecember 4th, 2020CLS STXM and Ptychography Data Analysis Webinar, December 4th, 2020, CLS, Saskatoon, Canada
Outline aXis2000 Installation and Introduction Images Spectra Linescans Stacks: alignment, spectra, mapping, fitting, etc. Cryo-STXM PyPIE: STXM-Ptychography PCA GUI and Mantis ImageJ Plugins - ScatterJ2
STXM and Ptychography Data Analysis Software aXis2000, Interactive Data Language (IDL) Virtual Machine,http://unicorn.mcmaster.ca/aXis2000.html. Other IDL based: stack analyze.sav, pca gui.sav Python based: Mantis 2.3.02 Ptychography: PyPIE, Sharpcamera, PtychoLib, etc. Other imaging processing: ImageJ and plugins, MATLAB, etc. Other spectroscopy processing: Athena, Fityk 0.9.83
aXis2000 – Analysis of X-ray Images and Spectra4
aXis2000 – Analysis of X-ray Images and SpectraWindows installation location: c:\aXis2000Mac installation location: Users\aXis2000aXis2000.sav is the IDL executable file.Old versions and online tutorials5
6
aXis2000 GUI Structure Think of as a TOOLBOX rather than a Workflow (Mantis is workflow oriented) User can follow pre-set sequence(s)Tutorials on web site http://unicorn.mcmaster.ca/aXis2000.html (rather dated!!)aXis2000 Manual (Help) describes function of each button, not workflowintensityTop level menus organized by process (read/write/zoom/filter/utilities)and by type of data: images / stacks/linescans/spectrax,yMain panel featuresCourtesy A.P. Hitchcock7
Images8
aXis2000 – Read Data Read STXM (sdf), for standard CLS Ambient-STXM data filesRead STXM (NeXus), for CLS Cryo-STXMdata filesRead PEEM (lox), for CLS PEEM data filesRead Images, for many other synchrotroninstruments data files, graphics files, etc.Read Spectra, for many other synchrotroninstruments data files, text files, etc.Read Stacks, for many other synchrotroninstruments data files9
Ambient-STXM Data FormatHeader File: e.g. A091111005.hdr,Scans, STXM, and Beamline settingsImage Data File:e.g. A091111005 a.ximSpectrum Data File:e.g. A100219012 0.xsp10
aXis2000 – Read Ambient-STXM Images Parameters: access all information in the header file Map: obtain a two-image subtraction map directly without alignment1 image: read an image from a selected photon energy fora stackChannel: select data channel if more than one detector isusedRegion: select sample region if more than one imageregion is definedI-ring norm?: normalization to I-ringI-ring norm value: CLS 220 mA First click on image: select the starting point Second click on image: select the ending point, thencalculate the d-X, d-Y, d-R, and d-Z of the two points Third click on image: clear the selected points11
aXis2000 – Image ZoomFunctions Pan: pops-up a zoom window with a 3xexpansion of the region around the cursor Cursor - cut: use cursor to define a stretchablebox on the image to cut Numerical - cut: numerical input of thecoordinates X-min, X-max, Y-min, and Y-max forimage cut12
aXis2000 – Image FilterSome Useful Functions Smooth: Boxcar average overn-points Median: n-point Savitsky-Golayaveraging Clean (FT image filter): 2d-FTfilter. The FT is displayed on a1:1 pixel format.13
aXis2000 – Image Processing OD image Some Useful FunctionsAdd: add/append image or constantAverage pixels: average image or region pixelsClip signal: two clicks to select image intensityrangeConvert to OD: normalize to the maximumintensity value of the imageDelete region: select an image region and replacethe intensity value by arbitrary numberGain: multiply or divide the image intensity by anumberGenerate mask: threshold the image intensity as 0and 1Multiply buffers: multiple two imagesPower: power the image intensityRatio to: divided by another imageReplace line: remove bad/black lines14
aXis2000 – Image DisplaySome Useful Functions 3d plot: X, Y and Intensity 3d image plot Modify image colors: change image colorsChangeableintensity limits Scale bar position: click on image toChangeable X, Y limitsmanually place the scale bar Thumbnails: display multiple imagestogetherChangeable settings15
aXis2000 – Image UtilitiesSome Useful Functions Change dwell: change image dwelltime Change energy: change imagephoton energy Change label: change label forimage or other files like spectra Change mesh: change image X andY pixel number Print: print image or other files likespectra with or without IDLannotation16
aXis2000 – Write Images Some Useful FunctionsAXIS: images written into *.axb binaryformatGraphics: images written into graphicsformats, such as GIF, JPG, PNG andTIF, with and without axes or labelsALS-xyt: images written into X, Y,intensity, X-pixel, and Y-pixelascii image: images written intocoordinates, and 2d array of imageintensityNSLS-image (*.nc): images written intoNSLS netCDF image format (*.nc)17
Spectra18
aXis2000 – Read Ambient-STXM Point SpectraA100219012–point scan–500 ms5 (Io)1 234 First click on spectrum: select the starting point Second click on spectrum: select the ending point, thencalculate the d-X, d-Y, and d-Z of the two points Third click on spectrum: clear the selected points19
aXis2000 – Spectrum ZoomSome Useful Functions Cursor: use cursor to define astretchable box on the spectrumto cut Numerical: numerical input ofthe limits of X-min, X-max, Y-min,and Y-max for spectrum cut20
aXis2000 – Spectrum FilterSome Useful Functions Smooth: Boxcar average overn-points Median: n-point Savitsky-Golayaveraging21
aXis2000 – Spectrum Processing Some Useful FunctionsAdd: add/append spectrum or constantCalibrate: calibrate X or Y scaleClip signal: two clicks to select image intensityrangeConvert to: normalize to an Io spectrum to get ODspectrumCurve fit: linear combination curve fit and otherDelete: delete the region between two selectedpointsGain: multiply or divide the Y scale (intensity) by anumberLinear Background: select two points onspectrum for background baselineMultiply: multiple two spectraPower: power the spectrum intensityRatio to: divided by another spectrumTruncate: truncate the spectral regions beyond thetwo selected points22
aXis2000 – Spectrum DisplaySome Useful Functions Over plot: display multiple spectraon the same plot based on NoRescale, Rescale, Window, andShiftChangeable X, Y limitsChangeable settings23
aXis2000 – Write SpectraSome Useful Functions AXIS: spectra written into *.txtASCII format XAS single/multiple: imageswritten into NSLS XAS format(*.xas)24
Linescans25
aXis2000 – Read Ambient-STXM Linescans First click on spectrum: select the starting point Second click on spectrum: select the ending point, then calculate the d-X, d-Y, andd-Z of the two points Third click on spectrum: clear the selected points26
aXis2000 – Linescans ProcessingSome Useful Functions Add lines: define two lines horizontally andaverage the intensity between the two lines Normalize to Io: normalize the linescan spectoimage to the Io spectrumIo regionIo SpectrumI regionLinescanOD imageODSpectrum27
Stacks28
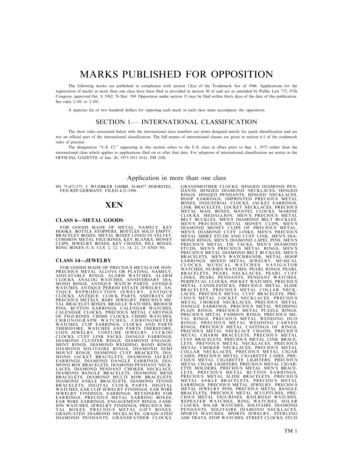
STXM Stacks Data ProcessingRaw Data Nitrogen-doped Carbon Nanotube(Transmission)(N-CNT)ImageStackConverted Data(Absorbance, OD)Combine stacks,FT alignment,Normalized to I0Beer’s LawOD A -lnT ln(I0I0) lIN K-edgeImage Stack(Sequence)Unknown systems:PCA-Cluster Analysisfor all pixel spectraMovie ClipOD( x , y , E )Known systems:Pixel spectrum fit with linearreference spectra (SVD) Constant ( x , y ) a( x , y ,i )OD1(i , E )iQuantitative ColorComposite Map45 nmN-CNTN24.5 nmReference spectrafrom pure regions orexternal0.100.05Linear ReferenceSpectra0.00395400405410415Energy (eV)500 nm01.0420425N AM x iN 1s0.8AbsorbanceAbsorbance (nm-1)N 1sExtract NEXAFSSpectroscopy0.6Chemical andElemental Sensitivity0.4aiiScaled to calculatedelemental X-rayabsorption profiles0J. Zhou, J. Wang et al. J. Phys. Chem. Lett. 1 (2010) 1709.0.2395400405410415420425Energy (eV)29
STXM Data Analysis File Naming Symbols and RulesSymbolsAConly file numberaaodavgc, calicl, clipls, lmmapmasknodod1odapsmsftxOriginal File TypesImagesPoint ScansLinescansStacksDescriptiondesignate letter for CLS Ambient-STXM datadesignate letter for CLS Cryo-STXM dataraw transmission dataaligned stackaligned stack, then converted to od stackaveraged stack image or spectrumenergy calibratedclipped, cleanedlinescanremeshedchemical mapstack masknormalizedoptical densityoptical density per nmoptical density stack, then alignedpart of the stacksmoothed spectrum, imageelemental absorption profiletruncated spectum, stack, clipped stackpoint scanDerived File 053aod-avg.ncbA161216053aodc.ncb, or 16053aodt.ncbxA161216055od.txtNaming RulesA/C date sequence number symbols ( sample)x A/C date sequence number symbols ( sample)ls A/C date sequence number symbols ( sample)ls A/C date sequence number symbols ( sample)(A/C date ) sequence number symbols ( sample)(A/C date ) sequence number symbols sample(A/C date ) sequence number symbols sample(A/C date ) sequence number symbols sample30
aXis2000 – Read Ambient-STXM StacksA091111001.dat Compile raw Ambient-STXM stack data: aXis2000 Read STXM (sdf) Give a stack file name, then generate two files:aXis2000 Stack ProcessIoI One *.dat file that has stack dimensions, pixel numbers, and photonenergies One *.ncb binary stack data file Uncheck “I-ring norm?” if ring current information is missing or wrong for someimages. After stack compiling, the aXis2000 Stack Process will be automaticallylaunched with inputting a ”suggested zoom” number Play movie in “Stack Process” to check if the stack is complete inimages/energies.NEXAFSSpectrum31
aXis2000 – Stacks Some Useful FunctionsStack process: stack data display,manipulation, and outputJacobsen stack analyze: stack datadisplay, alignment, manipulation, andoutputZimba: stack data build, display,alignment, manipulation, and outputAppend: append two stacks with thesame pixel and physical dimensionsChange mesh or size: change stackpixel number or physical sizeMaps: perform fitting like SVD or Stackfit for the stack, and other fittingsStatistical analysis: PCA analysis32
aXis2000 – Stack ProcessaXis2000 Stack Process Io I DISPLAYCONTROLSNEXAFSSpectrum DATAManipulation OUTPUTMenu Some Useful FunctionsGamma: change image Gamma valueE: define stack energy rangeI: region: select sample regionI: ROI file: load a sample ROI region fileI: map: generate a two image subtraction mapI0: file: load an Io fileI0: region: select an Io regionI0: remove image: delete an image of stack- OD: convert to OD stackAvg stack: average all stack imagesProcess: multiple math process for stackPath: saving path, no space in folder namesName: file name for output, click “enter” to activatethe output menu buttonsSpectrum, Region, Stack: commonly saved filetypes33
Stack Analyze (Stony Brook, V2.7) Some Useful FunctionsFlux/OD: display in flux (transmission) or OD(absorption) formatZoom: select the zoom factor for the stackimagesRead stack file: read a stack and choose*.ncb formatSave autoclipped stack file: after iterationsof alignment, save autoclipped stack filebefore select Io region.Align stack: launch the “Stack Align” widget,then process stack alignmentSave spectrum, image, and movie in formatsexcept the “mpg” format that requires IDLlicence34
Stack Analyze (Stony Brook, V2.7) – Stack Align Some Useful FunctionsEdge enhance before aligning: choose“None” for most cases unless the imagecontrast is very poor.Image to align to: choose “Eachpreceding image” for most cases; orchoose a best contrast image for somecases; use the same reference image forall alignment iterations.Use other default settings unless thealignment is very challenging.Save new alignment; go tostack analyze: after each alignment, savethe alignment back to the stack without aseparate alignment file.Align the stack until the X-Shift and Y-Shiftare zero and fully overlapped, or smallerthan 1 pixel.35
Stack Analyze (Stony Brook, V2.7) Some Useful FunctionsFlux/OD: display in flux (transmission) or OD (absorption)formatRemove this image from stack: delete bad images orunwanted images even before stack alignmentAdd I region: select a sample region to check NEAXFSspectroscopySelect I0 from histogram: select the highest intensity peakfor Io, as shown in the window aboveSave I0 spectrum: save the Io spectrum in *.xas formatstack analyze.sav File Read stack file; File Align stack Save autoclipped stack file Select I0 from histogram (click-hold-drag) Save I0 spectrum36
aXis2000 – Stacks – ZimbaaXis2000 Stacks Analyze ZimbaSome Useful Functions Browse *.ncb: browse and open a *.ncbstack List is complete: after loading the stack,click “List is complete” to move to the“ZSTACK Align” widget37
aXis2000 – Stacks – Zimba – ZSTACK AlignaXis2000 Stacks Analyze Zimba ZSTACK Align Some Useful FunctionsReference image for alignment: choose “EachPreceding Image” for most cases; or choose a bestcontrast image for some cases; use the same referenceimage for all alignment iterations.Edge enhancement before alignment: choose “None”for most cases unless the image contrast is very poor.Use other default settings unless the alignment is verychallenging.Start auto-alignment: you will see this function beforealignmentSkip alignment: you will see this function beforealignment; click this button if alignment was done byother softwareKeep alignment – Go to Stack Spectra: afteralignment, move on to “ZSTACK Spectra”Save shifts: after each alignment, need to save analignment file *.alnAlign the stack until the X-Shift and Y-Shift are zero andfully overlapped, or smaller than 1 pixel.38
aXis2000 – Stacks – Zimba – ZSTACK SpectraaXis2000 Stacks Analyze Zimba ZSTACK Align ZSTACK Spectra Some Useful FunctionsAdd I0 region: select an empty region withoutsample for Io; if the stack is already OD stack, don’tneed to select an Io region.Add I region: can select multiple sample regionsBase filename: for convenience, just use stack filenameSelect “xas (tab-separated)” and “File for eachspectrum”, then click “Save Spectra”. Note thesaved spectra are transmission spectra including Iospectrum if the stack is transmission stack; and foran OD stack, the saved spectra are OD spectra.Give a region of interest (ROI) file name, then click“Save ROI as *.roi” to save the ROI file withextension name *.roi.Reset color: if there is display problem, click“Reset color” button.39
aXis2000 – Stack Process – Save OD Stack, StackAverage Image, and SpectraaXis2000 Stacks Analyze stack process select an aligned transmission stack click “No” for alignment file suggested zoom value I0 file (*.*, then choose *.xas Io file) - OD save stackaXis2000 Stacks Analyze stack process select an aligned OD stack click “No” for alignment file suggested zoom value avg stack Store average image in an empty buffer, then save the image select “I: region” click draw a sample region on the stack click “ACCEPT region” give a file name, then hit “enter” click “Spectrum“.txt”” to save the sample NEXAFS spectrumSave OD stack, average stack imageSave Sample Region NEXAFS Spectra40
aXis2000 – Stack Average Image – Generate Mask andUse Mask for SpectrumaXis2000 Read Images AXIS open a stack average OD image Images generate mask threshold histogram adjust lower/upper limit to select desired sample region Save ROI (optional) edit mask Save maskimage Choose Buffer Write AXIS save the mask image in *.axb format Images Delete region selectregions on mask to replace with zero repeat “generate mask” aXis2000 Stacks Analyze stack process select an aligned OD stack click “No” for alignment file suggested zoom value select “I: ROI file” load the mask *.roi file give a file name, then hit “enter” click“Spectrum “.txt”” to save the sample NEXAFS spectrum41
aXis2000 – Stack Average Image – Generate Mask andUse Mask for StackaXis2000 Stacks Analyze stack process select an aligned OD stack click “No” for alignment file suggested zoom value process: select command *image load a mask image in *.axb format weight by 1 select an “I region” to activate the output menu give a file name, then hit “enter” click “Stack “.ncb”” to save thebackground cleaned stack42
aXis2000 – Stacks – Change Mesh or Size – Append Stack A091111006: C 1s stack, 4 µm x 2.5 µm, 100 pixel x 63 pixel, step size: 40 nm Stack A091112001: N 1s stack, 5 µm x 3.0 µm, 167 pixel x 99 pixel, step size: 30 nm Appending stacks procedure Cut A091112001 X-dimension 33 pixels and Y-dimension 17 pixels to have the same physical size as A091111006 Change mesh for the cut A091112001 to 100 pixel x 63 pixel, then append the two stacks togetheraXis2000 Stacks Analyze stack process select a rawtransmission stack click “No” for alignment file suggested zoom value select an “I region” to activate the output menu give a file name, thenhit “enter” click “Stack “.ncb”” keep columns(x) 33 keepcolumns(x) 166 keep rows(y) 17 keep rows(y) 98aXis2000 Stacks change mesh or size click “Yes” for changeMESH (and keep same image size) input “# of X pixels” as 100 input“# of Y pixels” as 63 save the re-meshed stack Stacks Append select STACK1: A091111006.ncb and STACK2: A091112001tm.ncb savethe appended stack file name as A091111006 A091112001.ncbC 1s N 1s43
aXis2000 – Stacks – Elemental/Chemical On/Off MappingaXis2000 Stacks Analyze stack process select an aligned OD stack, e.g. A091111006 A091112001aod.ncb click “No” for alignment file suggested zoom value change the “E: min, max” for pre-edge or post-edge avg stack Store average image in an empty buffer, then save the image change the “E: min, max” again and generate other images click a post-edge image Images Add Buffer choose the pre-edge image scaled by -1 Write AXIS save mapC 1s π* Map(285 286) – (280 282)N 1s π* Map(400 402) – (395 397)44
aXis2000 – Stacks – Maps – Stack Fit / SVDaXis2000 Stacks maps Stack fit or SVD select an aligned OD stack click “No” for parameter file input “#of components (1-8)” choose “Spectrum of component 0” give a very short “Name for component 0” choosethe rest component(s) spectrum give a Name of fit parameter file then click “enters” for the rest default settings result is saved and displayed in butters Output of Stack Fit / SVDBuffer 1: reference spectrum of Component 0, in thiscase it is N2 spectrum obtained from the stack directly, i.e.internal referenceBuffer 2: reference spectrum of Component 1, in thiscase it is NCNT spectrum obtained from the stack directly,i.e. internal referenceBuffer 4: Component 0 distribution map, in this case it isN2 distribution mapBuffer 5: Component 1 distribution map, in this case it isNCNT distribution mapBuffer 8: Constant map (only for Stack Fit)Buffer 9: Residuals map45
aXis2000 – Stack Fit / SVD – Color Composite MapClick “Component 0 map” Images Clip signal histogram click “around 0” and “highest visible intensity” Copy Buffer, and place it to Buffer 1 repeat the procedure for “Component 1” and place it to Buffer 2 in this case ofonly two components, a third blank image of zero intensity needs to be created click any component image Images Gain Multiply by 0 place the blank image to Buffer 3 click a blank buffer like Buffer 7 Display RGBcomposite select RED, GREEN, and BLUE images from Buffer 1 to 3 respectively click “Yes” for Autoscale eachcomponent save the image in *.tif format Buffer 0: color composite map Buffer 1: high contrast image of Component 0 Buffer 2: high contrast image of Component 1 Buffer 3: blank image with zero intensity46
aXis2000 – Spectra Curve Fit – Stack Fit / SVDaXis2000 Read Spectra AXIS open a spectrum for all sample regions like A091112001aod-all.txt click thespectrum Spectra Curve fit linear regression (stack fit) or SVD click “No” for parameter file input“Number of components” choose “Spectrum of component 0” give a very short “Name for component 0” choose the rest component(s) spectrum give a Name of fit parameter file result is displayed in buffers savespectra by Write AXIS Output of Curve Stack Fit / SVDBuffer 1: the original sample spectrumBuffer 2: fitting coefficient times reference spectrumof Component 0, i.e. N2 spectrumBuffer 3: fitting coefficient times reference spectrumof Component 1, i.e. NCNT spectrumBuffer 4: Constant (only for Stack Fit)Buffer 5: simulated fit spectrum47
Principles of STXM QuantitationBeer’s Lawhν: IoT I/IoOD Abs. ln (Io/I) μρlMass Absorption Coefficient for the ElementsOD: optical densityμ: mass absorption coefficientρ: material densityl: thicknessIOptimal STXM Sample Transmission:Optical Density per nm thickness0.1 1 2 OD ln (Io/I) -ln (T) -ln (90% 37% 14%)0.0150.010NEXAFS LinearAbsorbanceSpectrum (nm-1)*n*OC 1s OC5H8O2 density 1.18 g/cm1 nm thickness0.005Calculated Elemental MassAbsorption Coefficient for CompoundsPMMA3NAM x iiiNA: Avogadro’s numberM: molecular weightO 1sxi: number of atom iσi: atomic photoabsorption cross section0.000300400500Photon Energy (eV)48
X-ray – Matter (Atomic) InteractionX-ray Interaction with Carbon AtomsAtomic Cross SectionPhotoabsorptionJ.H. Hubbell et al. J. Phys. Ref. Data9 (1980) 1023.CoherentScatteringIncoherentScatteringAtomic Scattering FactorsPhoton – NucleusInteraction49
aXis2000 – Utilities – Calculate X-ray Parameters (SF)aXis2000 Utilities Calculate X-ray parameters (SF) Formula, e.g. C minimum energy maximum energy transmission density (g/cc), e.g. 2.16 (graphite) thickness (µm): 0.001 click “Yes” to “Convert to OD” accept or update “Header for output file” Write AXIS give a file name and save file50
aXis2000 – Quantitative Scaling Reference SpectraaXis2000 Read Spectra AXIS open a pure sample spectrum, i.e. MWCNT at Buffer 1, and a sf file for MWCNTat Buffer 2 click Buffer 1 Spectra Calibrate Y 1 point click pre-edge baseline, and set “New Y” to zero Copy Buffer, and place it at Buffer 4 click Buffer 2 and change the X display limits to 280 – 340 eV Spectra Truncate, and click 280 and 340 eV positions Copy Buffer, and place it to Buffer 5 calibrate pre-edge to zero andplace it to Buffer 8 click Buffer 4 Spectra Gain divide by 14 Display Over Plot No Rescale, andchoose Buffer 8, until the spectrum and the sf file overlap in both pre-edge and post-edge place the scaled spectrum toBuffer 7 check Buffer 5 pre-edge Y value, and use this value to calibrate Buffer 8 pre-edge Y value place thecalibrated and scaled spectrum to Buffer 9 Write AXIS Process of Quantitative Scaling Reference SpectraBuffer 1: the original MWCNT sample spectrumBuffer 2: sf file of MWCNT, i.e. 1 nm thick elemental X-rayabsorption profileBuffer 4: pre-edge zeroed MWCNT sample spectrumBuffer 5: truncated sf file, i.e. 280-340 eVBuffer 7: pre-edge zeroed and scaled MWCNT spectrumBuffer 8: pre-edge zeroed and truncated sf fileBuffer 9: pre-edge calibrated and scaled MWCNT spectrum, i.e. 1nm thick MWCNT NEXAFS spectrum51
aXis2000 – Stacks – Quantitative Stack Fit / SVDaXis2000 Stacks maps Stack fit or SVD select an aligned OD stack click “No” for parameter file input “# ofcomponents (1-8)” choose “Spectrum of component 0”, i.e. 1 nm thick graphene spectrum give a very short “Namefor component 0” choose the rest component(s) spectrum, i.e. 1 nm thick MWCNT spectrum give a Name of fitparameter file then click “enters” for the rest default settings result is saved and displayed in butters5.1 nmGraphene056.5 nmMWCNT052
Summary: Typical Measure & Analysis of a STXM StackMEASURE1.2.3.4.5.6.Typical Steps:FIND A SUITABLE AREACheck it has suitable properties (based on prior knowledge)Measure stack maps (few images few components) or stacks (good to look for surprises)Check for damagemake sure you have a valid Io - measure at SAME TIME (2nd area if needed)Check energy calibrationANALYSIS - STACKS Convert from raw data to a binary stackAlign - Jacobsen stack analyze or ZimbaConvert to OD(best to use built-in Io; otherwise, measure Io (point or stack) just before or after)Inspect ZimbaIdentify suitable reference spectra - external or internalConvert ref. spectra to OD1FIT - Singular Value Decomposition (SVD) versus Stack Fit (SF)Clean component maps (remove outliers)Display - non-rescale versus rescale RGBCHECK critical aspects: residuals, residual stacks; extract spectra of component-map-masked regions & fit to the referencespectra & inspect QUALITY of FITPerform Multivariate Statistical Analysis (PCA GUI, Mantis) & compareCourtesy A.P. Hitchcock53
Cryo-STXM54
Cryo-STXM Data FormatHDF5 File: e.g. C190126021.hdf5,Scans, STXM, and Beamline settingsImage Preview File:e.g. C190126021.jpg55
aXis2000 – Read Cryo-STXM Images Reset: clear loaded image and information 1 image: read an image from a selected photon energy for a stack I-ring norm?: normalization to I-ring I ring norm value: CLS 220 mA NEXUS source: CLS pySTXM Flip image: flip image up and down Channel: select data channel if more than one detector is used Region: select sample region if more than one image region is defined56
aXis2000 – Read Cryo-STXM Point Spectra Note: even select all regions, only onespectrum can be loaded into aXis200057
aXis2000 – Read Cryo-STXM StacksIoI Compile raw Cryo-STXM stack data:aXis2000 Read STXM (NeXus) Other steps are the same as Ambient-STXMNEXAFS Spectrum58
STXM-Ptychography59
Coherent Diffractive Imaging (CDI)Resolution: 𝜎𝑡 𝐼 𝐹(𝜓)𝜆𝑍𝑆2S (2 - 5 cm)𝜓(𝑟) 𝑃 𝑟 𝑂(𝑟)Z (3 - 6 cm)P(r): Probe functionO(r): Complex object function𝜓(𝑟) 𝑃 𝑟 𝑂(𝑟)SEMOMComplex Refractive Index: 𝑛 1 𝛿 𝑖𝛽 1 𝛼𝜆2 (𝑓1 𝑖𝑓2 )Complex Wavefield of Light: 𝑃(𝑟) 𝐴𝑒 𝑖𝑘𝑡Complex Object Function: 𝑂 𝑟 𝑒 𝑖𝑘𝑛𝑡 𝑒 𝑖𝑘 1 𝛿 𝑖𝛽 𝑡 𝑒 𝑘𝛽𝑡 𝑒 𝑖𝑘𝛿𝑡Absorption: 𝑂(𝑟) 𝑒 𝑘𝛽𝑡Phase: 𝐴𝑟𝑔 𝑂(𝑟) 𝑘𝛿𝑡Diffraction Pattern: Fourier Transform ofProduct of Probe and Object. Inverse FourierTransform and Phase Retrieval to solve Object.CDIJ. Miao et al. Nature 400 (1999) 342.60
From Conventional STXM to STXM-PtychographyZoneZone PlatePlateOSAOSASample CCDSample(raster scanned)yCCDPMTDetectorxConventional STXMSTXM-Ptychography Sample in-focus Sample in-focus or out-of-focus Point (0D) detector: Scintillator PMT or PD 2D detector: X-ray CCD Real-space images Diffraction/spot size limited spatialresolution (1.22*Δrn: 30 nm) Reciprocal-space images Wavelength limited spatial resolution(1 - 2 nm by soft X-rays) Large computation in data process61
CLS-SM STXM Instrumentation Development Highlights– STXM-PtychographyAmbient-STXMAndor DX43 CCD: 13.3x13.3 mm2, PI-MTE CCD: 27.6x27.6 mm2, 2048x20481024x1024 pixels, 13 μm pixel size, pixels, 13.5 μm pixel size, pixel well depthpixel well depth (e-) 100000; 1 fps(e-) 100000; 0.75 fpsSample HolderCCDCryo-STXMGreateyes UHV CCD 27.6 x 27.6 mm2, 2048 x 2048 pixels, 13 μm pixel size Pixel Well Depth (e-): 100000Tomo-goniometer Pixel Frequency: 500 KHz – 3.0 MHzPMTZPCCDCryo-holderPMTOSAZone PlateTucsen sCMOS: 22.5x22.5 mm2, 2048x2048 pixels,11 μm pixel size, pixel well depth (e-) 90000; 23 fpsGoal: sub-10 nm spatial resolutionCryo-Spectro-Ptycho-Tomography !Diffraction from Au/Pdnanoparticles capturedby sCMOSFuture AXIS-SXR: 4 MPixelSoft X-ray sCMOS camera62
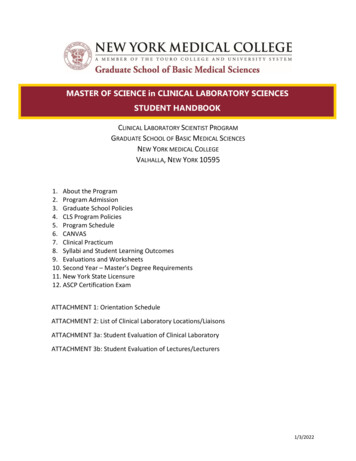
Recent STXM Spectro-Ptychography of LIB CathodeSTXM-PtychographyConventional STXMTransmission(Absorption)1 µmPixels: 300 x 300Resolution: 40 nmAmplitude(Absorption)1 µmPhase1 µmPixels: 2426 x 2426Resolution: 8 nm63
Recent STXM Spectro-Ptychography of LIB CathodeF Mn NiO Mn FPVDF LiF NiSpatial Resolution: 8 nm64
Recent STXM Spectro-Ptychography of LIB Cathode686 eV686.5687687.5688688.5689689.5690690.5691691.5F 1sLiF spectrum 95.5696LiCoO2500 nm65
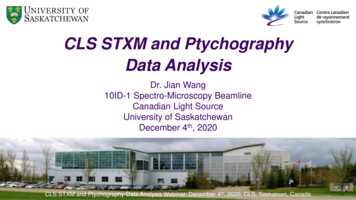
PyPIE – Single Energy Data Reconstruction5. Click-drag to zoom the zone plate center region,or click the double-arrow for additional options.1. Set root directory2. Select a data file (*.fits),*bg* file auto detected6. Check the centerpixel position8. Update the center pixel position4. Display the file3. Select the data file (*.fits)7. Center pixel position displayed here66
PyPIE – Single Energy Data ReconstructionAndor CCDNote: GE CCD pixel: 13.5 µm, d sd: 59.5 mm; zone plate informationand size of the CCD data for reconstruction can be changed.11. Check the extra configuration file9. Check here for single energy14. Click the View Port to check reconstruction result;reconstruction finishes at the set iteration number, default 1000.12. Start reconstruction10. Load the STXM *.hdr file13. Select the Ms-ePIEmode or ePIE modeNote: watch the messages shown here67
PyPIE – Reconstruction OutputNote: reconstruction images and other files are saved at the raw data directory under theAnalysis Data folder and its sub time-tag folders and energy folders.Note: object pixel size times total reconstructed pixels in eachdimension to
CLS STXM and Ptychography Data Analysis Dr. Jian Wang 10ID-1 Spectro-Microscopy Beamline Canadian Light Source University of Saskatchewan December 4th, 2020 CLS STXM and Ptychography Data Analysis Webinar, December 4th, 2020, CLS, Saskatoon, Canada. File:Uofsask logo.svg