Transcription
CH A P T E R6Troubleshooting with Cisco Video AssuranceManagement Solution 2.0This chapter contains the following sections: Monitoring ANA, CMM, and Video Probe Events with TBSM, page 6-3 Monitoring ANA, CMM, and Video Probe Events with Netcool/Webtop, page 6-6 Monitoring ROSA NMS Events with TBSM, page 6-8 Advanced Troubleshooting with CMM and TBSM, page 6-17 Monitoring and Troubleshooting in the Wireline Network, page 6-30 Monitoring and Troubleshooting in the Cable Network, page 6-30 Troubleshooting with Cisco ANA, page 6-31Using the VAMS DashboardsThe components provide operational dashboards that give you a top-down view of video network events.Cisco VAMS 2.0 provides: The TBSM dashboard The Cisco Info Center dashboard Cisco Multicast Manager The ROSA NMS Cisco ANATBSM DashboardThe high-level interface for VAMS 2.0 is the Tivoli Business Service Manager (TBSM). TBSM providesa view of all of the video services in your network that includes a: Service explorer that lists video services and associated devices Service tree that shows a network map of the devices for the selected service Service event list that shows the events for the selected serviceUser Guide for Cisco Video Assurance Management Solution 2.0OL-16498-026-1
Chapter 6Troubleshooting with Cisco Video Assurance Management Solution 2.0Using the VAMS DashboardsThe TBSM event list shows Cisco Info Center events that combine events received from all of thecomponents of VAMS 2.0 and present them in a consolidated event based on processing rules specifiedin Cisco Info Center rules files.You can launch the CMM home page from any event with a right-click. You can also launch a CMM flowtrace with a right-click from any event that includes a Multicast Group Address and a Source IP address.Currently, Digital Content Manager (DCM) events do not contain a Source IP address, so only CMMcross-launch is available for DCM events.Figure 6-2 on page 6-4 shows the TBSM dashboard. For information on how to use TBSM to viewVAMS video events, see: Monitoring ANA, CMM, and Video Probe Events with TBSM, page 6-3 Monitoring ROSA NMS Events with TBSM, page 6-8 Advanced Troubleshooting with CMM and TBSM, page 6-17Cisco Info Center DashboardCisco Info Center also provides an event list. This event list is viewable on UNIX devices, using theUNIX event list and on Netcool Webtop, using a web-based browser.For information on using the Cisco Info Center Event list, see the Netcool/OMNIbus 7.2 User’s Guide,viewable online lp/v8r1/topic/com.ibm.netcool OMNIbus.doc 7.2.0/omn pdf usr master 720.pdfFor information on using the Netcool/Webtop event list, see the Netcool Webtop 2.1 AdministrationGuide, viewable online lp/v8r1/topic/com.ibm.netcool wt.doc/ag/Administration Guide.pdfCisco Multicast ManagerCisco Multicast Manager provides a monitoring interface that allows you to monitor and manage videodevices. For information on the Cisco Multicast Manager interface, see the User Guide for CiscoMulticast Manager 2.5, viewable online ucts user guide list.htmlROSA NMSThe ROSA NMS provides a user interface for monitoring and configuring the Digital Content Manager(DCM) and associated video headend devices. For information on using the ROSA NMS, see the ROSANetwork Management System User's Guide, Version 3.0 Build 18. This document is provided in PDFformat on CD 1 of the ROSA NMS installation media.User Guide for Cisco Video Assurance Management Solution 2.06-2OL-16498-02
Chapter 6Troubleshooting with Cisco Video Assurance Management Solution 2.0Monitoring ANA, CMM, and Video Probe Events with TBSMCisco ANACisco Active Network Abstraction provides several applications for viewing network topology andevents. For information on the Cisco ANA components, see the user guides for Cisco ANA, viewableonline ucts user guide list.htmlMonitoring ANA, CMM, and Video Probe Events with TBSMStep 1Log in to IBM Tivoli Business and Services Manager (TBSM).The main TBSM page appears, as shown in Figure 6-4.The highest severity alarm status is shown in the Service Tree at the left of the page.Figure 6-1Step 2TBSM Main WindowFrom the service tree directory browser at the left of the page, click on a service.The service tree for the selected service appears.NoteStep 3You can sort the service tree by clicking on either the State or Events column head.Click on a specific device address.The Service Viewer displays the service relationships and the Service Details window shows an eventlist for the service, as shown in Figure 6-2.User Guide for Cisco Video Assurance Management Solution 2.0OL-16498-026-3
Chapter 6Troubleshooting with Cisco Video Assurance Management Solution 2.0Monitoring ANA, CMM, and Video Probe Events with TBSMFigure 6-2Step 4Service Viewer and Service Details WindowTo view the details of an event, double-click on the row for the event.User Guide for Cisco Video Assurance Management Solution 2.06-4OL-16498-02
Chapter 6Troubleshooting with Cisco Video Assurance Management Solution 2.0Monitoring ANA, CMM, and Video Probe Events with TBSMA table giving detailed field information for the event appears.Step 5NoteTo launch the CMM application, first left-click on an event to select it, then right-click the event, andfrom the Alerts Menu, choose VAMS Tools Region Name Launch CMM.The Region Name value is configurable from TBSM. For general information on configuring the RegionName, see the IBM Tivoli TBSM documentation at the following om.pFor information on configuring the TBSM menus for Cisco VAMS, see Adding CMM Menu and ToolItems, page 5-36.NoteYou can launch a real-time CMM flow trace or launch the CMM Latest Events page for furthertroubleshooting. it is possible to have one or more CMM servers available to launch to. The example inFigure 6-3 shows two regional CMM servers reporting events to a single Cisco Info Center server.Figure 6-3 shows the menu selections for starting CMM.Figure 6-3Launching CMM from a TBSM Event ListThe CMM application starts.User Guide for Cisco Video Assurance Management Solution 2.0OL-16498-026-5
Chapter 6Troubleshooting with Cisco Video Assurance Management Solution 2.0Monitoring ANA, CMM, and Video Probe Events with Netcool/WebtopFor additional information on the Tivoli TBSM application, and information on how to adjust andcustomize the TBSM window, see the IBM Tivoli TBSM documentation at the following om.pdfMonitoring ANA, CMM, and Video Probe Events withNetcool/WebtopStep 1Log in to IBM Tivoli Business Service Manager (TBSM).The main TBSM window appears, as shown in Figure 6-4.Figure 6-4Step 2TBSM Main WindowFrom the pull-down menu at the top of the TBSM start page, select Webtop Desktop.The Webtop Desktop User page appears.Step 3Click the Event Lists tab.The Active Event List appears, as shown in Figure 6-5.User Guide for Cisco Video Assurance Management Solution 2.06-6OL-16498-02
Chapter 6Troubleshooting with Cisco Video Assurance Management Solution 2.0Monitoring ANA, CMM, and Video Probe Events with Netcool/WebtopFigure 6-5Webtop Active Event ListThe Active Event List shows ANA events and CMM events. These events are sent from the CMM videoprobes by means of the MTTrapd probe. The Active Event List also shows events from the IneoQuest,Bridge Tech, Mixed Signals, and Pixelmetrix video probes.Step 4To view the details of an event, double-click on the row for the event.A table giving detailed field information for the event appears.Step 5To launch the CMM application, first left-click an event to select it, then right-click the event, and fromthe Alerts Menu, choose VAMS Tools Region Name Launch CMM.NoteNoteYou can launch a real-time CMM flow trace or you can launch the CMM Latest Events page forfurther troubleshooting.The Region Name value is configurable. For information on configuring the Region Name in TBSM, seethe IBM Tivoli TBSM documentation at the following om.pdfNoteIt is possible to have one or more CMM servers available to launch to. The example in Figure 6-6 showstwo regional CMM servers reporting events to a single Cisco Info Center server.Figure 6-6 shows the menu selections for starting CMM.User Guide for Cisco Video Assurance Management Solution 2.0OL-16498-026-7
Chapter 6Troubleshooting with Cisco Video Assurance Management Solution 2.0Monitoring ROSA NMS Events with TBSMFigure 6-6Launching CMM from WebtopFor detailed information on the Netcool/Webtop tool, see the following IBM Netcool/Webtop documentson the IBM Tivoli Netcool website: IBM Tivoli Netcool/Webtop QuickStart Guide IBM Tivoli Netcool/Webtop Administration GuideMonitoring ROSA NMS Events with TBSMVAMS 2.0 and TBSM allow you to monitor a variety of events from components in the video headend.These events are collected by the ROSA NMS and forwarded to Cisco Info Center. Cisco Info Centercorrelates the events with additional alerts received from the video network and consolidates theinformation into one alert.You can view the following categories of alerts in TBSM: Service Alerts—Indicate that a service loss has occurred, a service backup has occurred, or atransport stream has been lost. For a complete list, see Viewing Service Alerts, page 6-9. ETR-290 First Priority Alarms—Indicate various fault conditions, such as TS Sync Loss, CCError, Sync Byte Error, PAT Error, PMT Error, or PID Error. For a complete list, see ETR-290 FirstPriority Alarms, page 1-18. Video Transport Events—Indicate errors in video transport, such as UDP Stream Loss, BandwidthExceeded, or Destination IP Unresolved. For a complete list, see Video Transport Events, page 1-19. Additional Video Quality Measurements—Includes additional events that measure video quality,such as Unreferenced PID Error, PMT Section Exceeds 1K, Missing FEC Stream, or Payload BitRate Too Low. For a complete list, see Additional Video Quality Measurements, page 1-19.User Guide for Cisco Video Assurance Management Solution 2.06-8OL-16498-02
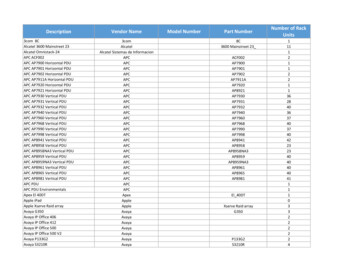
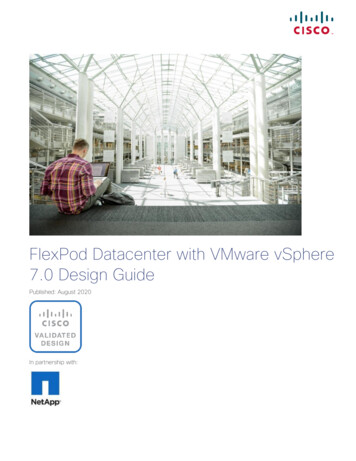
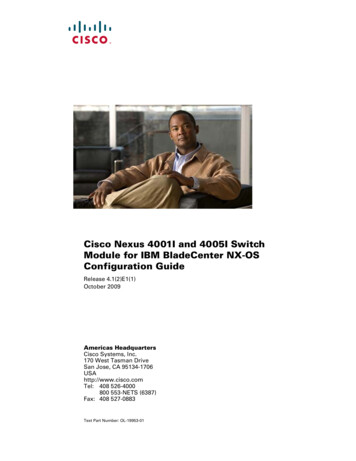
Chapter 6Troubleshooting with Cisco Video Assurance Management Solution 2.0Monitoring ROSA NMS Events with TBSMViewing Service AlertsService alerts indicate the loss of a video service. Cisco VAMS reports four types of service alert: Service Loss—For each incoming service, one or more alarms can be defined to trigger a ServiceLoss alarm. A Transport Stream Loss alarm is triggered when a Service Loss alarm occurs. Service in Backup (Service Loss)—This alarm is generated when a service is in backup statetriggered by a Service Loss alarm. Service Loss at Output—This alarm is generated for an outgoing service for which thecorresponding incoming service and incoming backup services are in Service Loss state. Service in Backup (TS Loss)—This alarm is generated when a service is in backup state triggeredby a TS Loss alarm.Viewing a Service Loss EventTo monitor Service Loss events with Cisco Info Center, bring up a Webtop event list using Cisco InfoCenter/TBSM:Step 1Log in to TBSM.The main TBSM window appears, shown in Figure 6-7.Figure 6-7Step 2TBSM Main WindowFrom the service tree directory browser at the left of the TBSM main window, click on a service.The service tree for the selected service appears.Step 3Click on a specific device address.The Service Viewer displays the network topology an the Service Details window shows an event list forthe service.Figure 6-8 shows a Cisco Info Center/TBSM display that includes a Service Loss event.User Guide for Cisco Video Assurance Management Solution 2.0OL-16498-026-9
Chapter 6Troubleshooting with Cisco Video Assurance Management Solution 2.0Monitoring ROSA NMS Events with TBSMFigure 6-8Viewing a Service Loss EventThe Service Loss Event summary indicates: Board Number—The board on which the service loss occurred on the indicated device. Port Number—The port number on which the video stream was transmitted. TS—A number identifying the Transport Stream affected by the service loss. IP Address—The IP address of the port.Additional Events Related to the Service LossThe TBSM event list shown in Figure 6-8 indicates several additional events related to the service lost. Layer 3 Multicast Rate PPS Rate Below Threshold—Indicates that the multicast PPS rate on therouter used to receive the video service feed from the Digital Content Manager (DCM) is below theconfigured threshold. TS Loss—Indicates a ROSA NMS event that identifies a Transport Stream (TS) from the DCM. UDP Stream Loss—Indicates that the UDP port on the router communicating with the DCM nolonger detects a TS from the DCM.When a service loss occurs, you might see additional ETR-290 First Priority events related to the serviceloss; for example, you might see a CC error event indicating a discontinuity error in the MPEG TSstructure for a program transmitted in the TS.Step 4To launch Cisco Multicast Manager to view additional monitoring information related to the service lossevent:a.Right-click on the event in the event list.User Guide for Cisco Video Assurance Management Solution 2.06-10OL-16498-02
Chapter 6Troubleshooting with Cisco Video Assurance Management Solution 2.0Monitoring ROSA NMS Events with TBSMb.From the pull-down menu, choose VAMS Tools Region Name Launch CMM, whereRegion Name is the name of a region or entity that you have set up in your network.Figure 6-9 shows how to launch CMM to view additional monitoring information for service events.Figure 6-9NoteLaunching CMM to View Service Loss InformationIn this example, the event highlighted in blue has been right-clicked to bring up the cross-launchmenu. The cross-launch is based on the information in the event that has been selected above,which is highlighted in white.Viewing Service Loss on Backup EventsTypically, video content is sourced from the central headend (CHE) to regional headends (RHEs), wherelocal ads are inserted into the video stream. Regional and local content is also inserted into the videostream the resulting streams are sent out to divisions in the multicast network. Each content streamdesignated for a division is transmitted in a different multicast group.User Guide for Cisco Video Assurance Management Solution 2.0OL-16498-026-11
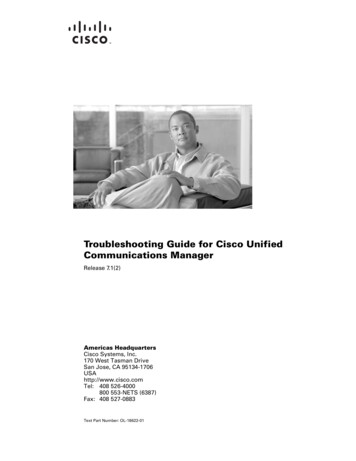
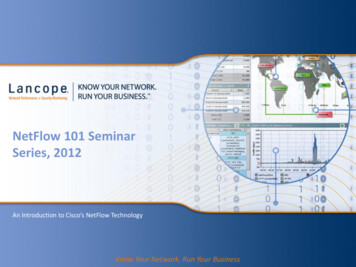
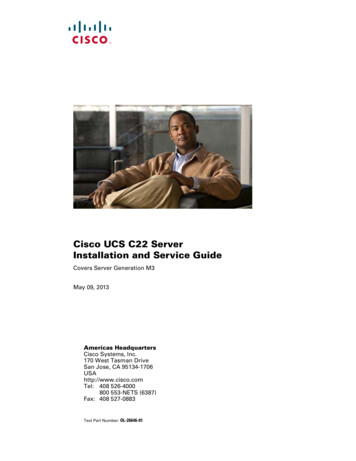
Chapter 6Troubleshooting with Cisco Video Assurance Management Solution 2.0Monitoring ROSA NMS Events with TBSMUsing the ROSA NMS, you can set up the DCM to fail over from the primary video source to a backupvideo source. For example, if the video transmission from a terrestrial antenna is interrupted, you canprogram the DCM to automatically switch to a secondary video source, for example, a satellite receiverdish.When a service backup occurs, the ROSA NMS receives alerts from the DCM at the CHE and generatesa Service Loss event, a Service Loss on Backup, and additional events, such as a TS Loss event.Downstream, the RHE DCM detects ETR-290 alerts on the CHE and also reports a temporary ServiceLoss on Output event due to the CHE service cutover.To view Service Loss on Backup Events.Step 1From the TBSM main window, click on a service that has a high priority (red) alert.TBSM displays the service tree for the event and the associated Cisco Info Center event list. Figure 6-10shows a service tree and event list for the BBC Three service:Figure 6-10Viewing a Service Loss Event Resulting from a Service BackupThe service tree shown in Figure 6-10 shows that the primary video signal has been lost by highlightingit in red and indicates that the secondary video signal is active by highlighting it in green.The event list in Figure 6-10 shows the following events: Below Low Threshold Event—This is received from CMM, indicating that the Layer 3 MulticastRate is under the configured threshold value. Failed to Receive IP Multicast Router Heartbeat—This event is received from the routerconnected the DCM at the CHE, indicating that the multicast heartbeat is no longer detected.User Guide for Cisco Video Assurance Management Solution 2.06-12OL-16498-02
Chapter 6Troubleshooting with Cisco Video Assurance Management Solution 2.0Monitoring ROSA NMS Events with TBSM Step 2UDP Stream Loss—Indicates that the UDP port on the router communicating with the DCM nolonger detects a TS from the DCM.To view the Service Loss in Backup event and associated events, in the service directory at the left ofthe TBSM display, click on the service that shows an alert.TBSM displays a service tree and event list for the selected device, as shown in Figure 6-11Figure 6-11Viewing a Service Loss in Backup EventThe event list in Figure 6-11 correlates the events on the CHE DCM that was receiving the TS from theprimary video source to the events indicating the error conditions on the Multiple Program TransportStream (MPTS) generated at the CHE. The event list includes: Service Loss—A service loss event from the DCM at the RHE indicates the loss of the primaryvideo stream from the CHE. Service in Backup (Service Loss)—A service in backup event from the DCM at the CHE indicatesthat a service backup has occurred: the primary video source has been replaced by the secondaryvideo source. ETR-290 Alerts—The DCM at the RHE reports:– PID Error—Occurs when components referenced in the Program Map Table (PMT) are notfound within a specified time interval.– CC Error—Indicates a discontinuity error in the MPEG TS structure for a program transmittedin the TS.User Guide for Cisco Video Assurance Management Solution 2.0OL-16498-026-13
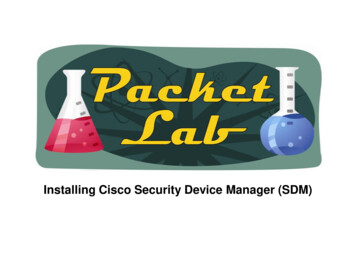
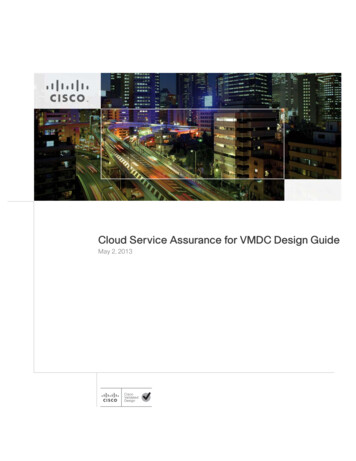
Chapter 6Troubleshooting with Cisco Video Assurance Management Solution 2.0Monitoring ROSA NMS Events with TBSM– Video Probe Media Loss Rate Error—A video probe in the core transport network reports aMedia Delivery Index/Media Loss Rate (MDI/MDR) event from CMM that indicates a MLRabove the configured threshold.You can also view Service Loss at Output events at the CHE and at the RHE downstream from the CHEthat is affected by the video service loss and backup.Step 3To view the Service Loss at Output and Related events at the CHE, in the service directory at the left ofthe TBSM display, click the icon for the CHE service that has a moderate (yellow) alert condition.TBSM displays the service tree and event list for the CHE device, as shown in Figure 6-12:Figure 6-12Viewing a Service Loss at Output Event and Related Events at the CHEFigure 6-12 shows the following CHE and related events: Service Loss at Output—Indicates the Service Loss at Output condition at the CHE DCM. Service Loss—Indicates the service loss event at the RHE affected by the service loss. ETR-290 Alerts—The DCM at the RHE reports:– PID Error—Occurs when components referenced in the Program Map Table (PMT) are notfound within a specified time interval.– TS Loss—The first byte of a Transport Stream packet header is the synchronization byte (0x47).A TS Loss error occurs when the synchronization byte in a sequence of at least two TransportStream packets are not detected.Step 4To view the Service Loss at Output event and related events at the RHE downstream from the CHE, inthe service directory, click the icon for the RHE service that has a moderate (yellow) alert condition.TBSM displays the service tree and event list for the selected RHE device, as shown in Figure 6-13:User Guide for Cisco Video Assurance Management Solution 2.06-14OL-16498-02
Chapter 6Troubleshooting with Cisco Video Assurance Management Solution 2.0Monitoring ROSA NMS Events with TBSMFigure 6-13Viewing a Service Loss at Output Event at the RHEThe event list in Figure 6-13 shows the Service Loss at Output event reported by the DCM at the RHE.Step 5To launch Cisco Multicast Manager to view additional monitoring information related to the service lossevent:a.Left-click on the event in the event list and then right-click to bring up the cross-launch menu.b.From the pull-down menu, choose VAMS Tools Region Name Launch CMM, whereRegion Name is the name of a region or entity that you have set up in your network.Figure 6-14 shows how to launch CMM to view additional monitoring information for service events.User Guide for Cisco Video Assurance Management Solution 2.0OL-16498-026-15
Chapter 6Troubleshooting with Cisco Video Assurance Management Solution 2.0Monitoring ROSA NMS Events with TBSMFigure 6-14NoteLaunching CMM to View Service Loss InformationIn this example, the event highlighted in blue has been right-clicked to bring up the cross-launchmenu. This cross-launch is based on the information in the selected event above, which ishighlighted in white.Viewing ETR-290 First Priority Alarms and Additional Events Related to aService LossBy selecting the services and devices associated with service loss events, you can view Video TransportEvents and Additional Video Quality Measurement Events associated with the service loss events.For examples of the TS Loss, PID Error, CC Error, and UDP Stream loss events, see Viewing a ServiceLoss Event, page 6-9 and Viewing Service Loss on Backup Events, page 6-11.User Guide for Cisco Video Assurance Management Solution 2.06-16OL-16498-02
Chapter 6Troubleshooting with Cisco Video Assurance Management Solution 2.0Advanced Troubleshooting with CMM and TBSMAdvanced Troubleshooting with CMM and TBSMCMM provides a diagnostics tool that gives you a multicast global view and a router-specific view ofyour network. Webtop events that you can view using TBSM allow you to see additional details aboutthe network.Table 6-1 lists important areas of the CMM that you can use to troubleshoot a multicast videodistribution network using Cisco VAMS:Table 6-1Cisco Multicast ManagerTroubleshootingAreaTask and ReferenceViewingnetwork statusView the status of all devices in the current multicast domain. See:Viewing RPstatusView all routers in the database, their RPs, and the active groups. See:IGMPdiagnosticsView the interfaces that have joined a particular group. See:Layer 2switchesView Layer 2 multicast information and host IPs. The table shows, from a Layer 2 perspective, whichmulticast groups are being forwarded out which interfaces. See:http://www.cisco.com/en/US/docs/net mgmt/cisco multicast manager/2.5/user/guide/cmm et mgmt/cisco multicast manager/2.5/user/guide/cmm et mgmt/cisco multicast manager/2.5/user/guide/cmm et mgmt/cisco multicast manager/2.5/user/guide/cmm dt.html#wp1131025Gather accurate packet-forwarding statistics and other information. net mgmt/cisco multicast manager/2.5/user/guide/cmm dt.html#wp11troubleshooting31042Top-20 videoflowsView the top-20 video flows. The top-20 video flows are dynamically updated at every polling interval. See:Video probestatus1View diagnostic information about video probes and the flows that they are monitoring. See:Video FlowTracingVideo flows can be traced through the network. All routers participating in the transport of the multicastflow are listed. A graphical representation of the flow path is provided which includes IneoQuest probes andtheir status for a given flow.PPS/BPSThresholdMonitoringPPS/BPS threshold monitoring allows you to set and monitor thresholds on Cisco routers and switches forhigh or low BPS or PPS rates on a per flow basis. See Monitoring Multicast Tree Changes (Tree Polling),page 6-18 for details on PPS/BPS threshold monitoring.http://www.cisco.com/en/US/docs/net mgmt/cisco multicast manager/2.5/user/guide/cmm et mgmt/cisco multicast manager/2.5/user/guide/cmm dt.html#wp1221364User Guide for Cisco Video Assurance Management Solution 2.0OL-16498-026-17
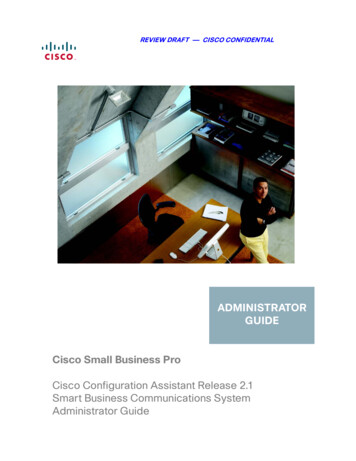
Chapter 6Troubleshooting with Cisco Video Assurance Management Solution 2.0Advanced Troubleshooting with CMM and TBSMTable 6-1Cisco Multicast Manager (continued)TroubleshootingAreaTask and ReferenceMonitoringMulticast TreeChanges (TreePolling)View changes to multicast trees, which might affect video quality immediately, or at some time in the future.Tree polling allows you to monitor the multicast distribution tree of a video service and receive an alert whenchanges to the distribution tree occur. See: Monitoring Multicast Tree Changes (Tree Polling), page 6-18 “Monitoring with the Multicast Monitoring Tool” in the User Guide for Cisco Multicast Manager 2.5at the following location:http://www.cisco.com/en/US/docs/net mgmt/cisco multicast manager/2.5/user/guide/cmm mon.htmlHealth ChecksYou can perform health checks to check and report on the critical components of your network. For example,you can check on the status of Rendezvous Points (RPs), Multicast Source Discovery Protocol (MSDP)peering, the presence of sources and groups, and the status of multicast trees. See: Performing Health Checks, page 6-25 The “Health Check” section in the User Guide for Cisco Multicast Manager 2.5 at the net mgmt/cisco multicast manager/2.5/user/guide/cmm dt.htmlMonitoring IPMulticastHeartbeatYou can configure IP multicast heartbeat monitoring on Cisco routers and switches to verify that data isflowing on the monitored multicast flow(s). See Monitoring IP Multicast Heartbeat, page 6-22.1. Cisco Multicast Manager 2.5.4 supports only the IneoQuest video probe.Monitoring Multicast Tree Changes (Tree Polling)You can monitor multicast tree changes with Cisco Multicast Manager and receive the alert in Cisco InfoCenter. From Cisco Info Center you can then launch CMM for advanced troubleshooting of the treechanges.Monitoring Multicast Tree Changes with Cisco Info CenterTo monitor multicast tree changes with Cisco Info Center, bring up a Webtop event list using Cisco InfoCenter/TBSM:Step 1From the service tree directory browser at the left of the Cisco Info Center/TBSM display, click on aservice.The service tree for the selected service appears.Step 2Click on a specific device address.The Service Viewer displays the network topology an the Service Details window shows an event list forthe service.Figure 6-15 shows a Cisco Info Center/TBSM display and a Webtop event indicating that a MulticastForwarding Tree has changed from its baseline.User Guide for Cisco Video Assurance Management Solution 2.06-18OL-16498-02
Chapter 6Troubleshooting with Cisco Video Assurance Management Solution 2.0Advanced Troubleshooting with CMM and TBSMFigure 6-15Step 3Viewing a Tree Change Event in TBSM/WebtopTo view the details of an event, double-click on the row for the event.A table giving detailed field information for the tree change event appears. Figure 6-16 shows a sampleAlerts Status page with tree change event details.Figure 6-16Detailed Tree Change Event InformationStep 4To launch the CMM application and monitor additional information about the tree change event,highlight an event, and then from the Alerts Menu, choose VAMS Tools Region Name LaunchCMM.Step 5Go to the Monitoring Multicast Tree Changes with CMM, page 6-20 for information on monitoring treechange events with CMM.User Guide for Cisco Video Assurance Management Solution 2.0OL-16498-026-19
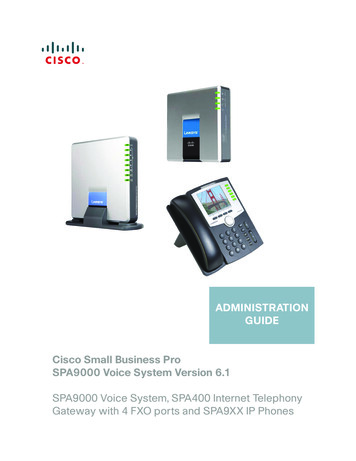
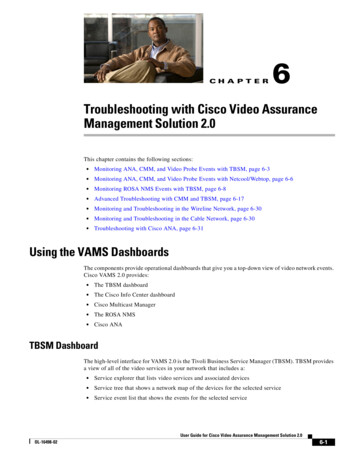
Chapter 6Troubleshooting with Cisco Video Assurance Management Solution 2.0Advanced Troubleshooting with CMM and TBSMMonitoring Multicast Tree Changes with CMMUsing CMM, you can: View the latest tree change events. View a Tree Changed Report that shows details about the changes in the treeWhen you launch CMM from TBSM/Cisco Info Center, the CMM Latest Events list appears.Figure 6-17 shows a Latest Events list from CMM that includes tree change events.Figure 6-17CMM Tree Change EventsThe event list in the figure shows two events: The first event to come in is a Tree Changed event indicating that a tree has been changed.The Tree Changed event indicates the name of the trace file that was used as the baseline to comparethe current distribution tree against. The format of the trace filename shown in the event is the sameformat that you use to specify the trace filename when during Tree Polling configuration for thedomain.The trace filename has this format: channel name ad zone Mcast-Group source-IP where channel name is the name of the channel, ad zone is the name of the Ad zone, Mcast-Groupis the address of the multicast group, and source-IP is the IP address of the source. For example:PBS National 232-0-1-32 12-101-2-18 The second event to come in is a Tree Reverted event that indicates that the tree reverted back to itsprevious state. This trap has the same format as the Tree Changed event (indicates the filename ofthe trace file was used as the baseline to compare against).Viewing a Tree Changed ReportTo view a Tree Changed Report:Step 1If you are in the TBSM/Cisco Info Center interface, highlight an event, and then from the Alerts Menu,choose VAMS Tools Region Name Launch CMM.The CMM Latest Events page appears.Step 2From the CMM Home Page, select Reporting Tree Report.The Multicast Tree Report page appears, as shown in Figure 6-18.User Guide for Cisco Video Assurance Management Solution 2.06-20OL-16498-02
Chapter 6Troubleshooting with Cisco Video Assurance Management Solution 2.0Advanced Troubleshooting with CMM and TBSMFigure 6-18Step 3Selecting a Tree Change ReportSelect the baseline trace file that matches the Tree Changed event.A list of Multicast Tree Change reports for the baseline appears, as shown in Figure 6-19.Figure 6-19Step 4Multicast Tree Change ReportClick the trchange link to view the Tree Changed Report.The selected Tree Changed Report appears. The report s
Monitoring ROSA NMS Events with TBSM Figure 6-6 Launching CMM from Webtop For detailed information on the Netcool/Webtop tool, see the following IBM Netcool/Webtop documents on the IBM Tivoli Netcool website: † IBM Tivoli Netcool/Webtop QuickStart Guide † IBM Tivoli Netcool/Webtop Administration Guide Monitoring ROSA NMS Events with TBSM