Transcription
Monitoring ESXiPerformance Using Server &Application Monitor 2013, SolarWinds Worldwide, LLC. All rights reserved.Share:
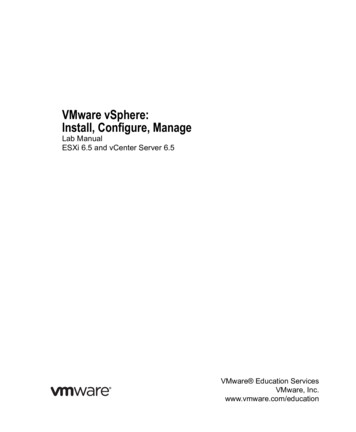
What is VMware ESXi?ESXi is one of VMware’s hypervisors that does not require the vCenter management console. However, ESXiruns on VMkernel. VMware’s operating system is designed to support and manage virtual servers, volumes, virtualmachines (VM), and applications that run on the VMs.Major components of the ESXi system include:Virtualization Layer: This provides the hardware environment and virtualization of underlying physical resourcesto the virtual machines. This consists of the virtual machine monitor, which is responsible for virtualization andVMkernel. The VMkernel manages the physical resources on the hardware.The virtualization layer is used for scheduling VMs’ operating system and the service console of the ESXi host.Hardware Components: VMs use the hardware interface when they need to communicate with hardware such asthe CPU, memory, disk, and network controllers.ESXi EnvironmentShare:2
Why Do We Need To Monitor ESXi Server?Because ESXi does not require VMware’s vCenter management console, VMware admins have limited visibilityinto what is going on with ESXi virtual machines. A server monitoring software will give you more visibility andcontrol over the ESXi virtual machines and their environment.Usually a server monitoring software has plenty of performance counters for monitoring the performance of ESXiand its hosts. Monitoring these counters is an important part of maintaining your VMware environment. In order togain insights into what is happening with critical applications in your VM, it’s essential to monitor the VM and theESXi server performance metrics. For example, your Exchange Server application running on a VMware ESXi hostcould experience performance issues. Here are some of the reasons why these issues might occur: Failure of the application itselfPerformance issues with the operating systemFault with the server hardwarePerformance bottlenecks in the VM or its resourcesProblem with the VM hostIn order to know exactly what failed or had issues, it’s important to monitor key metrics within the ESXi environmentusing a server monitoring software: CPUo CPU Reserved Capacityo CPU UsageMemoryo Memory Balloono Memory Heapo Memory Heap Freeo Memory Reserved Capacityo Memory Sharedo Memory Consumedo Memory Activeo Memory Grantedo Memory Usageo Memory Swap Usedo Memory Sway Ino Memory Swap Outo Memory Used by VMkernelo Memory Unreservedo Memory StateDisk Volumeso Disk UsageNetwork UsageShare:3
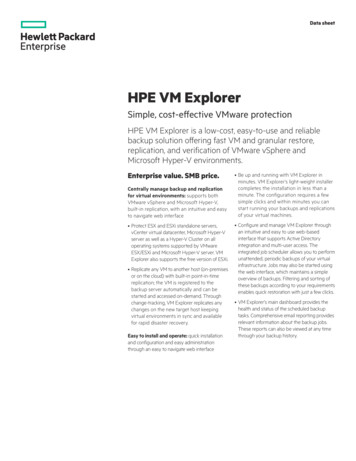
How SolarWinds Server & Application Monitor Monitors YourESXi ServersSolarWinds Server & Application Monitor (SAM) is an agentless server and application monitoring tool. SAMmonitors over 150 applications in your IT environment. With SAM you can discover applications and gain visibilityinto the performance of your applications and their underlying operating systems and servers.SAM has Integrated Virtual Infrastructure Monitoring (IVIM), which allows you to monitor your virtual infrastructureas well as your servers and applications that are part of your environment. Using IVIM, you can monitor your virtualnetworks, virtualized data centers, and private clouds. This helps you ensure that the network performance doesnot affect your virtualization projects.Monitor your entire VMware virtual infrastructure using SAMSAM monitors your entire VMware virtual infrastructure, ESXi hosts, and VMs. If you already have a vCenter, youcan also monitor Datacenter and Cluster layers.In addition, using SAM, you can track availability and performance metrics within the VMware virtual environment.They are CPU load, memory, disk volumes, and network usage.VMware Monitoring in SAMUsing SAM, you can automatically discover, identify, and monitor new virtual machines added to any VMware hostserver. SAM uses Simple Network Management Protocol (SNMP) in order to poll performance data from theVMware ESXi servers. You must ensure that SNMP credentials are enabled on your ESXi servers.Get information about hosts, clusters, and VMs in your environmentShare:4
Agentless Monitoring of Virtual DevicesYou can use SAM’s agentless technology to monitor VMware infrastructures on your network. You can discovernodes in SAM using the following:Add a single node: You can add a single node by using the appropriate credentials, connecting the node, andthen monitoring it.Network Sonar Discovery: This method is recommended when you are adding new virtual servers in SAM.You can scan and discover hardware such as servers and volumes using Network Sonar Discovery. You caneven create a profile and schedule auto-discovery to poll nodes based on the defined times.Discovery Central: This will monitor virtual servers, volumes, interfaces, applications within SAM, and othervirtual devices. Whether you are trying to poll nodes or want to scan existing nodes and devices for applications,using Network Discovery or Application Discovery you can automatically poll and start monitoring.Automatically discover nodes in SAMVirtualization AssetsOnce the nodes are discovered and added for monitoring, you can look at all the virtualization assets monitoredin SAM. You can drill down to any of the assets within your environment and identify what the issues are. Amouse-over on any asset shows you the availability for monitoring that asset even before you drill down.Share:5
Obtain availability monitoring of your virtualization assetsSAM shows various intuitive charts and gauges that provide details about a particular host. You can look at thenode details, ESXi details, VM memory consumption, CPU consumption, alerts within the particular host, VMnetwork traffic, a list of all the VMs within that host, and more.SAM’s interactive dashboard gives a detailed summary of your virtual assetsShare:6
Drill down to a VM to look at various metrics that SAM monitors in the VM. Obtain time-based charts on howcertain metrics have performed over a period of time. SAM shows VM details such as ESXi host information,status of the VM, network, CPU, memory, and host network usages.You can access hundreds of VMs and get critical informationTop 10 – SummarySAM’s Virtualization dashboard offers you a list of top 10 hosts based on performance. It gives you a high-leveloverview of performance issues and it is quite useful before drilling down. SAM shows Top 10 Virtualization Hostsfor: Percentage Memory UsedNetwork UtilizationCPU LoadNumber of Running VMsKey Metrics that SAM Monitors in VMware ESXi Servers and Virtual MachinesOnce the virtual servers are added to SAM, you can start monitoring key metrics in the VMware ESXi environment.Some of the key performance metrics that SAM monitors in the ESXi servers include:CPU Utilization: Monitoring CPU utilization shows whether all the CPUs on the host are completely occupied.Share:7
Look at key metrics within the ESXi serversMemory Usage: Monitor the percentage of memory that is currently being used. You can consider this as activememory—a percentage of total configured or available memory in the server.See how metrics have performed for a given time intervalMemory Ballooning: Monitor the memory usage of multiple VMs running in a host. This is essential to monitorbecause you will know if the hypervisors’ host is running out of memory. This can happen when the guestoperating system running inside a VM cannot detect the host’s memory shortage.Share:8
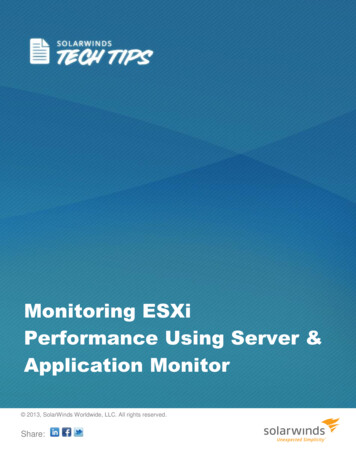
Memory Heap: Monitoring memory heap ensures that you don’t face issues like running out of memory heapspace on the ESXi host, especially when a large quantity of virtual disk space is active.Memory Active: By monitoring this counter, you will know the exact amount of memory needed by all the VMsrunning in a host.Disk Volumes: Monitoring the disk volumes will show the size, space, and availability of the disk volumes that iscurrently used and available.Monitor disk volumes based on current usageNetwork Usage: Monitor the average rate at which the data is sent or received during a specific interval, likemonitoring the rate at which the data is sent or received across each virtual network on the host.Monitor data that is sent/received across the virtual networkShare:9
Virtualization Alerting and ReportingAlert ManagerYou can apply SolarWinds’ native alerting and reporting capabilities seamlessly to your virtual infrastructure. UsingSAM, you can generate alerts for your virtual components that are running in your virtual environment. Use AlertManager to actively monitor and respond to user issues. SAM alert criteria are set based on the industry’s bestpractice threshold values. Base your alert criteria depending on individual ESXi server componentsObtain alerts if any ESXi component reaches critical, up, down, unknown, or warning stageObtain alerts based on statistical data that are specific to the monitored virtual componentsGet alerts on the percentage of CPU that is in use including physical, total, and virtual memoryView alerts in the SAM Web console or, depending on the priority of the alert, you can receive alerts via emailor on your phoneAdvanced Alert ManagerYou use the Advanced Alert Manager to view component events and alerts. Also, using the Advanced AlertManager you can: Configure alerts in a way that virtual components such as the ESXi servers can be monitored for a specific timeperiodLook at recent component events with their description and other information from the events logSelect actions that will occur when Advanced Alert is reset. This ensures that basic alerting still continues forthe specific components you consider criticalView active alerts, which display their description and information from the alerts logReporting CapabilitiesSAM has a set of predefined reports that you can access anytime, such as: Current application and component status of your virtualized assetsCurrent hardware and hardware sensor statusHardware health power consumption cost calculationsHistorical application CPU and memory reportsHistorical hardware sensor daily availabilityHistorical hardware sensor statisticOther historical reportsIn addition to pre-defined reports, you can create new reports and customize existing reports using SolarWindsReport Writer. These reports can give your IT management insights in the performance of the applications andnodes. They can also see how server management software has helped the organization keep their virtualinfrastructure optimized.Share:10
Create customized reports of your ESXi server performance5 Reasons to Download Server & Application Monitor Employ SAM’s Integrated Virtual Infrastructure Monitoring (IVIM) to monitor virtual networks, virtualized datacenters, and your private cloudAutomatically discover, identify, and monitor new VMs added to an ESXi host serverGain visibility into the ESXi VMs and inexpensively monitor ESXi environmentsSolarWinds’ native alerting and reporting capabilities extend seamlessly to your virtual infrastructureSAM includes a Web-based and agentless monitoring platformSolarWinds (NYSE: SWI) provides powerful and affordable IT management software tocustomers worldwide - from Fortune 500 enterprises to small businesses. The companyworks to put its users first and remove the obstacles that have become “status quo” intraditional enterprise software. SolarWinds products are downloadable, easy to use andmaintain, and provide the power, scale, and flexibility needed to address users’management priorities. SolarWinds’ online user community, http://thwack.com, is wheretens of thousands of IT pros solve problems, share technology, and participate in productdevelopment for all of the company’s products. Learn more today athttp://www.solarwinds.com.For additional information, please contact SolarWinds at 866.530.8100 or e-mailsales@solarwinds.com.To locate an international reseller near you, visithttp://www.solarwinds.com/partners/reseller locator.aspxShare:11
How SolarWinds Server & Application Monitor Monitors Your ESXi Servers SolarWinds Server & Application Monitor (SAM) is an agentless server and application monitoring tool. SAM . Monitor your entire VMware virtual infrastructure using SAM SAM monitors your entire VMware virtual infrastructure, ESXi hosts, and VMs. If you already have a .