Transcription
Environmental Health Risk VII59Vibration assessing model:comparison between methodsG. Alfaro Degan, D. Lippiello, S. Lorenzetti & M. PinzariUniversity ROMA TRE, ItalyAbstractThe aim of blasting operations is rock fragmentation. It provides an appropriaterock material granulation or size that is suitable for loading and transportation.However, the blasting process and usage of explosives remain a potential sourceof numerous human and environmental hazards. The aim of this paper is, first ofall, to provide models (and models comparison) concerning one of the majorenvironmental issues related to blasting operations in mining and civilengineering projects: ground vibration propagation. The study displays anassessment of ground vibrations caused by blasting experiments at a whinstonequarry. The vibration source is the blasting of a fixed quantity of explosiveburden (200 Kg of an Ammonium Nitrate Slurry Watergel – Tutagex 110,fragmented in 8 different parallel blast holes with a fixed 2 meter spacing). Theprimary goal of this study was to estimate the peak particle velocity (PPV) of thevibration, in order to protect the dwelling area adjacent to the quarry. Based onthe data obtained from field measurements, a new equation was proposed: toachieve this objective we use geostatistical modelling, the branch of statisticsthat studies the phenomena that are developed on space-based, starting from theinformation derived from the sampling. The decision to describe thephenomenon with geostatistical modelling stems from having a limited numberof samples and a vibration source difficult to repeat, which makes thegeostatistics suitable for this purpose. In fact, it is often used to study phenomenacharacterized by a limited availability of samples. The final goal is thecomparative analysis between the results obtained by the geostatistical equationand common empirical predictors currently used in blasting practice. Theanalysis of the comparison between these two approaches shows that thegeostatistical tool seems to be suitable to the purposed scope.Keywords: geostatistics, vibrations, quarries, blast.WIT Transactions on Biomedicine and Health, Vol 16, 2013 WIT Presswww.witpress.com, ISSN 1743-3525 (on-line)doi:10.2495/EHR130061
60 Environmental Health Risk VII1 IntroductionThe purpose of blasting operations is rock fragmentation. It provides appropriaterock material granulation or size that is suitable for loading and transportation.The blasting process and usage of explosives, however, remain a potential sourceof numerous human and environmental hazards. Singh and Singh [1] indicatethat fragmentation accounts for only 20-30% of the total amount of explosiveenergy used. The remainder of the energy is wasted away in the form of groundvibrations, air-overpressure and flyrock. All of them can, under somecircumstances, cause damage to structures nearby and, apart from this, be thesource of permanent conflict with inhabitants who live close to the operation. Arecent study completed by Raina et al. [2] indicates the degree of humanresponse to blast vibrations and air-overpressure.Ground vibrations are acoustic waves that propagate through the rocks[3, 13]. They differ from the round vibrations caused by earthquakes in terms ofseismic source, amount of available energy and travelled distances [4]. Usually,parameters such as velocity, displacement and acceleration of particles arerecorded during the vibration measurements, but several studies achieved that themost important parameter, that has to be studied, is the Particle velocity. Manyscientists and engineers investigated on PPV prediction and published theirfindings. The first significant PPV predictor equation was proposed by the USBureau of Mines [5]. There are also modified predictors from other researchersor institutions such as Langefors and Kihlström [6], Ambraseys and Hendron [7],Indian Standard Institute [8], Daemen et al. [9], Pal Roy of CMRI [10], etc.However, the PPV predictor established by USBM is still the most widely usedequation in the literature. To the knowledge of the author, no work has beenreported in the literature that addresses the application of geostatistical approachfor the estimation of ground vibration. This paper explains the usage ofgeostatistical modeling for estimation of ground vibration and comparisonbetween principal common vibration predictors including geostatistical one. Toreach these goals measurements were performed of vibrations at Basalt Quarry incentral Italy, Rome.2 Instrumentation and measurement on siteMeasurement campaign was carried out at Dark-Grey Basalt Quarry, nearbyRoma. The quarry was created in the early years of the century, with the purposeof providing Basalt to Rome-Ostia railway line, and still continues its activitiesextracting Granite for B1 line of Rome subway. The instrumentations used tomeasurement complies with IEC 60651, IEC 60804, IEC 61672-1, IEC 60260and IEC 61260 Class 0 and consisted of 4 Sinus Soundbook units, on which havebeen connected accelerometer terns.Due to instrumentation availability, it was possible to estimate the value ofthe vibrations in 4 different points simultaneously. Table 1 shows points P1, P2,P3, P4 coordinates (X is the perpendicular distance from the blast face, Y is theparallel distance starting from midst of bench edge, D is the X-Y sum vector.WIT Transactions on Biomedicine and Health, Vol 16, 2013 WIT Presswww.witpress.com, ISSN 1743-3525 (on-line)
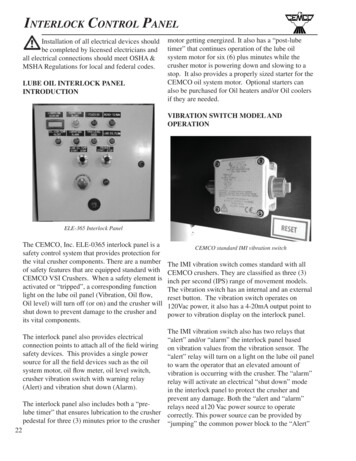
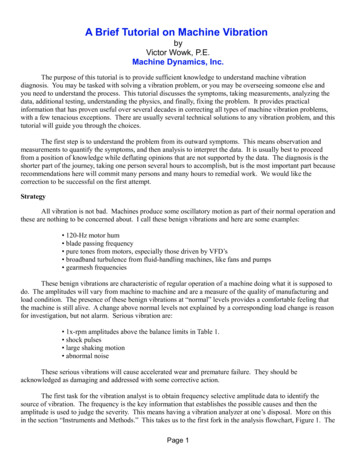
Environmental Health Risk VIITable 1:Measurement pointP1P2P3P461Measurement 5The accelerometer terns were placed radially, transversely and vertically fromthe edge of bench. The data were acquired using 1000Hz sampling frequency;accelerometers have been buried 40cm depth (figure 1).Figure 1:Bench edge and accelerometer tern.The blast design and characteristics are set out below.Explosive: NITRAM; charge weight: 200kg; bench height: 18m; benchwidth: 20m; bench thickness: 2m; number of blast holes: 8; last hole array: singlerow; spacing: 1m; delay: 25ms; burden: 1 (burden and explosive ratio).Data collected were processed by SAMURAI 2.0 (Sinus Acoustic Multichannel Universal Real-time Analysis Instrument); integrating the accelerationhas been obtained the velocity and its PPV. Table 2 reports PPVi associated toi measurement points.Table 2:Measurement pointP1P2P3P4PPV associated to measurement 5PPVi(mm/s)142,08246,93138,49181,63AxleZZZZ3 Processing of physical modelSimultaneously, with the implementation of geostatistical model, a theoreticalmodel was used to predict ground vibrations in our interest area. Thanks to theknowledge of the explosive used and characteristic rock parameter, a grid ofPPV values was calculated.WIT Transactions on Biomedicine and Health, Vol 16, 2013 WIT Presswww.witpress.com, ISSN 1743-3525 (on-line)
62 Environmental Health Risk VIITo reach this goal, a theoretical model developed by Berta [11] was used.Berta considered that the seismic energy transmitted to the rock by the explosivecan be evaluated with the two following equations:E2πA f 2πDS ρ VC T 10En n n ET Qwhere A displacement (m), f frequency (Hz), DS distance from theexplosion point (m), ρ density of the rock (kg/m ), VC seismic velocity(m/s), T duration of the vibration(s), n breaking factor (charges laid on theground n 0.4; charges without a free face n 0.4), ET energy per unit of mass,Q amount of explosive. n and n are, respectively, impedance factor andcoupling factor shown which are represented by the following formulas:n1nEDZZZZ,where Z impedance of explosive (kg m s ), Z impedance of rock(kg m s ), D blast hole diameter (mm), d charge diameter (mm). Fromprevious equations the following is obtained:ET QA mDS1VC TThe significant duration of vibrations is considered to be five times the period:T5T, and the ground frequency is calculated with:flogDSwhereis a characteristic ground constant which influences the reduction offrequency with distance. As a result, equation (1) can now be written as follows:ET QA mDS(2)π DS ρ VC TIntegrating equation (2),V m/sQDSDSVC(3)Table 3 shows explosive characteristics and rock parameters referring to ourcase, considering measurement point number 1.Solving equation (3), using values listed in Table 3, PPV in P1 result0.14477 (m/s), so 144.77(mm/s).4 Geostatistical modellingGeostatistics is the branch of statistics that studies the space-based developedphenomena, starting from the information derived from their sampling.WIT Transactions on Biomedicine and Health, Vol 16, 2013 WIT Presswww.witpress.com, ISSN 1743-3525 (on-line)
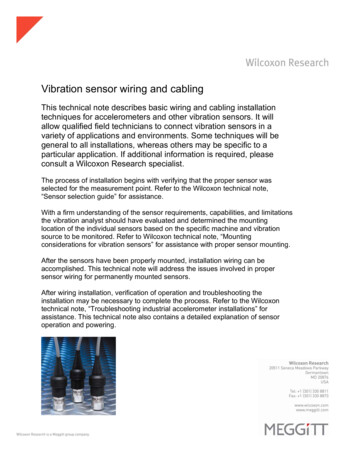
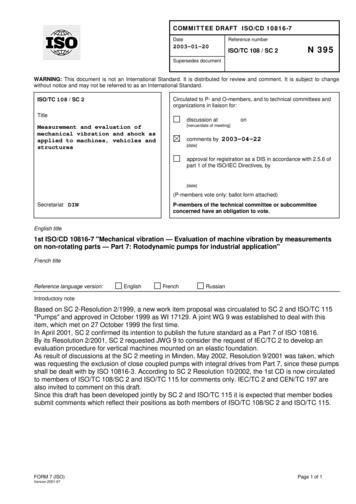
Environmental Health Risk VIITable 3:63Explosive characteristics and rock parameter.Q200 kg3,3 [MJ/kg]0.01540 [m]2900 [Kg/m³]5400 [m/s]0.40.830.9The aim of geostatistical analysis is to assign a value to the regionalizedvariable at the points where it is not known. In this study as regionalizedvariable has been considered, according to literature, the highest value among X,Y and Z peak particle velocity (PPV). There are several methods for effectingsuch estimates that depends on the characteristics of the phenomenon underinvestigation, stationary or non-stationary. For stationary phenomena, the bestestimation method, which provides the best results, is the Ordinary Kriging,whereas for non-stationary phenomena is generally used the UniversalKriging estimator. The choice of the right method to estimate, is often difficult todetect. To reach this goal, variograms are exploited, covariance and generalizedcovariance, this is a process for attempts based on statistical assumptions. Inpractice these discrete functions are calculated using available samples, thenthese data are pooled by continuous functions, obtaining full information aboutvariability of the phenomenon. This is the main tool that estimator use tocalculate the regionalized variable at the points where it is not known.4.1 Stationary modelThe starting point has been geostatistical modeling, by using the softwareMultigeo, assuming a stationary phenomenon, and then estimating a regionalizedvariable using Ordinary Kriging. Initially the model has been implemented usingthe grid points found with theoretical physics model, so considering those pointsas sampled values: it was decided to interpolate the main direction, 90 , that wasapproximated by Gaussian function with range 110 m from blast point. Figure 2shows the PPV map obtained and Table 4 lists the cross validation analysisresults.To further improve the model reliability, it was proceeded to applyan external drift to the model, directly interpolating some measured PPVvalues (Table 5).4.2 Non-stationary modelStationary geostatistical analyses are based on the assumption of studying aphenomenon whose average does not present a trend.The next step was to work out non-stationary geostatistical modeling, soassuming that the average of the regionalized variable presents a trend.WIT Transactions on Biomedicine and Health, Vol 16, 2013 WIT Presswww.witpress.com, ISSN 1743-3525 (on-line)
64 Environmental Health Risk VIIFigure 2:PPV geostatistical map arising from stationary modeling.Table 4:Cross validation results.ErrorsMean errorMean square errorSqrt (mean square error)Mean standard errorMean square standard errorSqrt (mean square standard error)Table 2710.003110.164710.40958Geostatistical results summary table.Drift freeWithexternaldriftDrift .320.450.30-0.050.08The software used has been FAIPACK, which is a tool that allows us to studya phenomenon assuming it is a non-stationary, analyzing it with random intrinsicfunctions of order K (FAI-K). The FAI-k substantially filters the trend of thephenomenon through flat surfaces or quadric surfaces, which brings us back tothe study of stationary increments; that is to say, average constant alongthe surface. The type of surface available is indicated with k: k 0 is a horizontalsurface, k 1 is an inclined surface, k 2 is a quadratic surface, k 3 is acubic surface. In current practice it does not exceed grade 2.WIT Transactions on Biomedicine and Health, Vol 16, 2013 WIT Presswww.witpress.com, ISSN 1743-3525 (on-line)
Environmental Health Risk VII65Under these assumptions, we have analyzed the variability of thephenomenon with the Generalized Covariance, and the estimation has been doneusing the Universal Kriging.As result, has been identified the k order of the function, and according to theresults obtained with the various orders, has been chosen k 1.Then, has been calculated the Generalized covariance and interpolated withthe function with the best approximation (Table 5 shows the values obtained).4.3 Non-stationary model conclusionEven using non-stationary simulations there were improvements and best resultby using external drift (Table 5).4.4 Geostatistical model conclusionTable 5 reports the PPV1 (PPV value obtained at P1) and errors related to theevaluation at point P1. Values related to points P2, P3, P4, are obtained by directmeasurements in three different points (Table 1).As reported, it is clear as adding one external drift in this geostatistical model(in both stationary and non-stationary cases), the error related to the evaluationsare lower.It is evident, moreover, how non-stationary analysis is one that gives bestresults, in all four simulations (drift-free and with external drift), showing thatthe phenomenon of vibrations produced by blasting operation, is a phenomenonthat, using geostatistical modeling, has to be studied assuming a non-stationarystatistical framework, so assuming that the random variable average is notconstant.So far, even if we are allowed to claim that theoretical Berta’s model is closeto reality, it generates results with 1.9% of error, because Berta’s model ignoressome borders effects. By using geostatistical modeling is possible to correct,partially, the theoretical Berta model’s errors. Indeed, using the correctgeostatistical model, and in particular an external drift with only one real valuewhich contribute significantly to correct the error of modeling, it is possible tohave some predictive results with more accuracy.5 Comparison between modelsThe next step has been to evaluate PPV on point P1 by experimental equations[11, 12], and after that to compare models results with geostatistical results.5.1 Common predictorsAmong the massive literature regarding blasting operations, it was considered toanalyze only 6 models, the ones that best fit for this case. The most accreditedpredictor is Duval and Fogelson’s of the US Bureau of Mines. They performed10 years of experimentations, 171 blasts in 26 different quarries across the US,and they gave birth to a new equation in 1963, able to connect PPV values andWIT Transactions on Biomedicine and Health, Vol 16, 2013 WIT Presswww.witpress.com, ISSN 1743-3525 (on-line)
66 Environmental Health Risk VIIstructural damages. This equation has been the first PPV predictor and is still themost used. In particular assuming cylindrical explosive geometry for longcylindrical charges, they concluded that any linear dimension should be scaledwith the square root of the explosive charge weight based on dimensionalanalysis. The equation proposed by USBM is:PPVKD Wwhere,PPV is peak particle velocity (mm/s), D is the distance between blast face andmonitoring point (m), W is maximum explosive charge used per delay (kg), andK, n are site constants which can be determined by multiple regression analysis.Later, Langefors and Kihlstrom [6] proposed the following relationships toestimate PPV:PPVKWDIn 1968, Ambraseys and Hendron [7] suggested that any linear dimensionshould be scaled to the cube root of the explosive charge weight for sphericalgeometry. An inverse power law was suggested to relate amplitude of seismicwaves and scaled distance to obtain the following relationship:PPVKDWIndian Standard [8] suggested that the blast should be scaled to the equivalentdistance or the scaled distance, defined as the explosive charge weight dividedby cube root of square of real distance. The proposed equation is:PPVKWDThe Ghosh–Daemon predictor [9] proposed that various inelastic effects causeenergy losses during wave propagation in various medium. This inelastic effectleads to a decrease in amplitude in addition to those due to geometricalspreading. They modified the propagation relations of USBM in terms of addinginelastic attenuation factor (α). The equation proposed is:PPVKD WeDwhere,PPV is peak particle velocity (mm/s),D is the distance between blast face and monitoring point (m),W is the maximum explosive charge used per delay (kg), andK, B and α are the site constants which can be determined by multiple regressionanalysis.WIT Transactions on Biomedicine and Health, Vol 16, 2013 WIT Presswww.witpress.com, ISSN 1743-3525 (on-line)
Environmental Health Risk VII67In order, Pal Roy [10] of the Central Mining Research Institute proposed anew predictor equation based on the data collected from different Indian geomining conditions. This equation is only valid in the zone of disturbance, whenW 0 and PPV 0.PPVnK WDTable 6 summarizes all the above described equations.Table 6:Common predictor equations.Agency/institution and authorsPredictor equationDUSBM predictor equation (Duval and Fogelson, 1962) Langefors et al. (1963)Ambraseys-Hendron equation (1968)Indian standard (1973)Ghosh–Daemen (1983) CMRI equation (Pal Roy, 1991)5.2 Common predictors comparisonTo obtain values of PPV in a given point, using common predictors, it isnecessary to find out values of K, n andα. To do this the equations have to besolved by setting systems of 2 or 3 equations in 2 or 3 variables. Thanks to theavailability of the measures in P2, P3 and P4 has been possible to solve systemsof equations, to calculate the value of the PPV1 by each predictor, and then tocompare the results obtained using the 6 equations and those obtained with thegeostatistical modeling. Table 7 shows values of K, n and α that solve theequations systems.K, n and α values.Table nStandard0.0311.70CMRI1.2550.024Therefore PPV1 has been calculated (value of the PPV obtained in P1) byusing each predictor.WIT Transactions on Biomedicine and Health, Vol 16, 2013 WIT Presswww.witpress.com, ISSN 1743-3525 (on-line)
68 Environmental Health Risk VIITable 8 shows values of PPV1, errors and percentage errors, compared to themeasured value of PPV1Table 8:PPV 1(mm/s)ΔPPV1(mm/s)ΔPPV1%PPV1 by common predictors, errors and percentage 40.66From the results is possible to see that using the predictors USBM, Langefors,Ambraseys and Indian standard, the result does not change. Using the equationsof Gosh and CMRI, the PPV1 differ from the previous ones, in particular thebest prediction is achieved by the use of the USBM, Langefors, Ambraseys andIndian standard formulas, while the predictor processed by Gosh-Daemen hascalculated a very different result from the true value.6 Comparison between common predictors andgeostatistical modelsTable 9 summarizes the results of all the simulations performed withgeostatistical modeling and those obtained using common predictors.The results have been listed in table in descending order. As we can see fromthe table, results obtained with geostatistics are considerably better than thoseobtained by use of the common predictors. In fact, apart from the 0.55% errorobtained with the formulas (USBM, Langefors, Ambraseys and Indian Standard,which rank between the two geostatistical solutions without the use of drift) allthe geostatistical simulations have provided better results.Table 9:Non- Stationary with external drift P3Non- Stationary with external drift P4Stationary with external drift P3Non- Stationary with external drift P2Stationary with external drift P4Stationary with external drift P2Non- Stationary drift freeUSBM, Langefors, Ambreseys, IndianStationary drift freeCMRIGoshPPV1 summary .090.300.320.380.450.550.590.661.947 ConclusionsThe purpose of this study has been to verify whether and how the geostatisticalmodeling lends itself to the prediction of the phenomenon of vibrations causedby blasting operation.WIT Transactions on Biomedicine and Health, Vol 16, 2013 WIT Presswww.witpress.com, ISSN 1743-3525 (on-line)
Environmental Health Risk VII69The results show that geostatistics, is not only a valid tool for assessing thesephenomena, but it also allows a prediction considerably more efficient than thosealready used. Using only the knowledge on the characteristics of the site underexamination, the parameters associated to the firing procedures, and, performinga single measurement on site, it is possible to implement a geostatistical modelwith external drift, which significantly reduces the estimation error made bycommon predictors. The error passes from 0.55% resulting from the use of themodel USBM to -0.05% by implementing a non-stationary geostatistical modelwith external drift.References[1] Singh, T.N. and Singh, V. An intelligent approach to prediction and controlground vibration in mines, Geotech. Geologic. Eng., 23: 249–262, 2005.[2] Raina, A.K., Haldar, A., Chakraborty, A.K., Choudhury, P.B. andBandyopadhyay, R.M. Human response to blast-induced vibration and airoverpressure. Bull. Eng. Geol. Environ., 63: 209–214, 2004.[3] Berry P., Dantini, E.M., Blasting Techniques Used in the 1950's and theirProbable Effects on Mechanical Characteristics of Rock Vis-à-Vis CurrentMethods, Proc. Int. Conf. on Rock Eng. and Excav. in an UrbanEnvironment, IMM, pp. 517–521, Hong Kong, 1986.[4] Oriard, L.L., The scale of effects in evaluating vibration damage potential,Society of Explosives Engineers, pp. 161–176, 1989.[5] Duvall, W.I. and Fogelson D.E., review of criteria to estimating damage toresidences from blasting vibrations, USBM-I, 5968, 1962.[6] Langefors, U., Kihlström, B., The modern technique of rock blasting, 1963.[7] Ambraseys, N.R., Hendron, A.J., Dynamic behaviour of rock masses, Rockmechanics in engineering practices, p. 203–7, 1968.[8] Indian Standard Institute. Criteria for safety and design of structuressubjected to underground blast, ISI Bull, 1973.[9] Daemen, J.J.K., Barkley, R.C., Ghosh, A., Morlock, C.R., and Shoop, S.A.,Ground and air vibrations from caused by surface blasting., Vol. .biblio.jsp?osti id 6613826)[10] Pal Roy, P., Vibration control in an opencast mine based on improved blastvibration predictors, Mining Science and Technology, Volume 12,Pages 157–165, 1991.[11] Berta, G., L'esplosivo strumento di lavoro. Italesplosivi (Mi), 1985.[12] Mancini, R., Cardu, M., Scavi in roccia: gli esplosivi, Hevelius, Aprile2002. ISBN: 8886977484, ISBN-13: 9788886977487[13] Giraudi, A., Cardu, M., Kecojevic, V., An Assessment of BlastingVibrations: A Case Study on Quarry Operation, American Journal ofEnvironmental Sciences 5 (4): 467–473, 2009. ISSN 1553-345X[14] Berry P., Dantini, E.M., Sismicità indotta da volate in galleria. II Congr.Italo-Brasileiro de Engenharia de minas, Vol. 1, pp. 283–295, San Paolo,Brazil, 1993.WIT Transactions on Biomedicine and Health, Vol 16, 2013 WIT Presswww.witpress.com, ISSN 1743-3525 (on-line)
analysis of the comparison between these two approaches shows that the geostatistical tool seems to be suitable to the purposed scope. Keywords: geostatistics, vibrations, quarries, blast. comparison between methods Environmental Health Risk VII 59 WIT Transactions on Biomedicine and Health, Vol 16, www.witpress.com, ISSN 1743-3525 (on-line)