Transcription
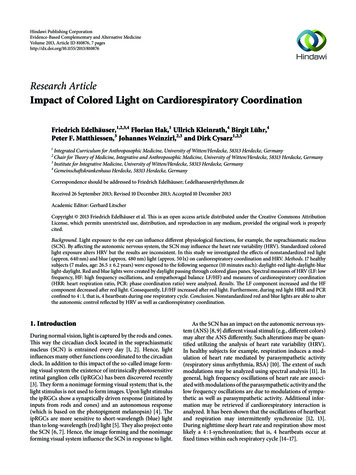
Hindawi Publishing CorporationEvidence-Based Complementary and Alternative MedicineVolume 2013, Article ID 810876, 7 pageshttp://dx.doi.org/10.1155/2013/810876Research ArticleImpact of Colored Light on Cardiorespiratory CoordinationFriedrich Edelhäuser,1,2,3,4 Florian Hak,1 Ullrich Kleinrath,4 Birgit Lühr,4Peter F. Matthiessen,3 Johannes Weinzirl,2,3 and Dirk Cysarz1,2,31Integrated Curriculum for Anthroposophic Medicine, University of Witten/Herdecke, 58313 Herdecke, GermanyChair for Theory of Medicine, Integrative and Anthroposophic Medicine, University of Witten/Herdecke, 58313 Herdecke, Germany3Institute for Integrative Medicine, University of Witten/Herdecke, 58313 Herdecke, Germany4Gemeinschaftskrankenhaus Herdecke, 58313 Herdecke, Germany2Correspondence should be addressed to Friedrich Edelhäuser; f.edelhaeuser@rhythmen.deReceived 26 September 2013; Revised 10 December 2013; Accepted 10 December 2013Academic Editor: Gerhard LitscherCopyright 2013 Friedrich Edelhäuser et al. This is an open access article distributed under the Creative Commons AttributionLicense, which permits unrestricted use, distribution, and reproduction in any medium, provided the original work is properlycited.Background. Light exposure to the eye can influence different physiological functions, for example, the suprachiasmatic nucleus(SCN). By affecting the autonomic nervous system, the SCN may influence the heart rate variability (HRV). Standardized coloredlight exposure alters HRV but the results are inconsistent. In this study we investigated the effects of nonstandardized red light(approx. 640 nm) and blue (approx. 480 nm) light (approx. 50 lx) on cardiorespiratory coordination and HRV. Methods. 17 healthysubjects (7 males, age: 26.5 6.2 years) were exposed to the following sequence (10 minutes each): daylight-red light-daylight-bluelight-daylight. Red and blue lights were created by daylight passing through colored glass panes. Spectral measures of HRV (LF: lowfrequency, HF: high frequency oscillations, and sympathovagal balance LF/HF) and measures of cardiorespiratory coordination(HRR: heart respiration ratio, PCR: phase coordination ratio) were analyzed. Results. The LF component increased and the HFcomponent decreased after red light. Consequently, LF/HF increased after red light. Furthermore, during red light HRR and PCRconfined to 4 : 1, that is, 4 heartbeats during one respiratory cycle. Conclusion. Nonstandardized red and blue lights are able to alterthe autonomic control reflected by HRV as well as cardiorespiratory coordination.1. IntroductionDuring normal vision, light is captured by the rods and cones.This way the circadian clock located in the suprachiasmaticnucleus (SCN) is entrained every day [1, 2]. Hence, lightinfluences many other functions coordinated to the circadianclock. In addition to this impact of the so-called image forming visual system the existence of intrinsically photosensitiveretinal ganglion cells (ipRGCs) has been discovered recently[3]. They form a nonimage forming visual system; that is, thelight stimulus is not used to form images. Upon light stimulusthe ipRGCs show a synaptically driven response (initiated byinputs from rods and cones) and an autonomous response(which is based on the photopigment melanopsin) [4]. TheipRGCs are more sensitive to short-wavelength (blue) lightthan to long-wavelength (red) light [5]. They also project ontothe SCN [6, 7]. Hence, the image forming and the nonimageforming visual system influence the SCN in response to light.As the SCN has an impact on the autonomic nervous system (ANS) [8, 9] different visual stimuli (e.g., different colors)may alter the ANS differently. Such alterations may be quantified utilizing the analysis of heart rate variability (HRV).In healthy subjects for example, respiration induces a modulation of heart rate mediated by parasympathetic activity(respiratory sinus arrhythmia, RSA) [10]. The extent of suchmodulations may be analyzed using spectral analysis [11]. Ingeneral, high frequency oscillations of heart rate are associated with modulations of the parasympathetic activity and thelow frequency oscillations are due to modulations of sympathetic as well as parasympathetic activity. Additional information may be retrieved if cardiorespiratory interaction isanalyzed. It has been shown that the oscillations of heartbeatand respiration may intermittently synchronize [12, 13].During nighttime sleep heart rate and respiration show mostlikely a 4 : 1-synchronization; that is, 4 heartbeats occur atfixed times within each respiratory cycle [14–17].
2Evidence-Based Complementary and Alternative MedicineRecent attempts to capture alterations of cardiovascularcontrol caused by colored light were heterogeneous. Brightlight ( 5000 lx) acutely increased the average heart rate inhealthy subjects with blue light being most effective [18].In neonates with physiologic jaundice the phototherapyincreased heart rate and decreased respiratory rate duringactive sleep compared to active sleep without phototherapy[19]. In healthy subjects visual stimuli with different colorsdid not change the average heart rate but caused changes ofHRV. During exposure to green or red light (700 lx) very lowoscillations increased whereas during blue light these oscillations decreased compared to darkness [20]. Another studyshowed that after exposure to red or blue dim light (illuminance below 1 lux) the low frequency oscillations of HRVincreased in healthy subjects with symptoms of anxiety anddepression [21]. These studies indicate that each color stimulimay alter cardiovascular regulation differently.The aim of this study was to investigate simultaneouseffects during the exposure to red or blue lights on HRV, respiratory rate, and cardiorespiratory coordination in healthysubjects. We used a “naturalistic setting” which consisted ofcolored glass panes in front of a window illuminated by daylight. This way the level of illuminance is low (30 to 100 lx) andnot standardized.2. Methods2.1. Subjects. 20 healthy subjects participated in the study (10females, average age: 27 6 years). None of the subjects hadany history of cardiovascular diseases, especially, nor hypoor hypertension or antiarrhythmic therapy. None of the subjects had any experience with any kind of light therapy. Threemale subjects had to be excluded from the study because theydeliberately changed their respiration. Hence, these subjectsnot only focused on the different visual stimuli but also onrespiration. All subjects gave their written informed consent.The study was approved by the ethics committee of theUniversity of Witten/Herdecke.2.2. Protocol. The subjects sat comfortably in an armchairapprox. 1.5 m in front of a window. The size of the window wasmatched to the size of the colored glass panes (approx. 0.6 m 1.1 m) with black opaque curtains. A red and a blue glass panewere used to generate two different color stimuli. (The redcolored pane was produced by addition of gold, the bluecolored pane by addition of ferrous oxide. They were manufactured by Lucien Turci and Marianne Altmaier, Lichtblicke.V., Lörrach, Germany.) Each glass pane was mounted ona stand with reels which allowed the quick change of thevisual stimuli. During color vision the black opaque curtainswere placed such that color light was the only visual stimulus.Each subject was exposed to the following sequence of visualstimuli (level of illuminance: 30 to 100 lx):daylight-red ligh-daylight-blue light-daylight.(1)The duration of each stimulus was 10 min (total duration:50 min). In order to minimize a bias caused by circadianvariations of HRV [22] the procedure was carried out between10 am and 1 pm.2.3. Data Acquisition. A 1-channel Holter electrocardiogram(ECG) and a respiratory trace (nasal/oral airflow capturedby a thermocouple) were recorded during each session(Medikorder MK2, Schiller Engineering, Graz, Austria). Thedevice’s sampling rate of the ECG was 3000 Hz and, hence, thetimes of the device’s internal R-peak detection had a precision 1 ms. To reduce memory consumption, the ECG was savedat a sampling rate of 250 Hz and the nasal airflow was savedat a sampling rate of 100 Hz. After transferring the ECG, theairflow trace and times of the R-peaks to a personal computer,the ECG, and the times of the R-peaks were inspected visually.In case of artefacts the times of associated R-peaks werecorrected where necessary (e.g., by removing artifacts or bycorrecting the time of the R-peak). Less than 0.01% of R-peaksidentified by the device had to be corrected.The airflow trace was analyzed as follows. Inspiratoryonsets were defined as local minima of the airflow becausethey were caused by the change from exhaling warm air(warmed be the respiratory tract) to inhaling air at the temperature of the environment. The times of the automaticallyidentified inspiratory onsets were also inspected visually.Again, in case of artifacts the timings of inspiratory onsetswere corrected.The visual inspection of R-peaks, the subsequent HRVanalysis (see Section 2.4) and the analysis of the airflow tracewas carried out using custom programs written with Matlab(The Mathworks, Natick, MA, USA).2.4. Heart Rate Variability. The normal-to-normal intervalsbetween successive R-peaks (RR-interval series) served asthe basis for the calculations. To avoid effects of transitionsbetween different visual stimuli only the 5-minute epoch inthe middle of each visual stimulus was analyzed. The meannormal-to-normal intervals and the accompanying standarddeviation (SDNN) were calculated as basic time domainparameters. In the frequency domain, the extent of very low,low and high frequency oscillations of heart rate variations(VLF: 0.04 Hz, LF: 0.04–0.15 Hz, and HF: 0.15–0.4 Hz) andthe ratio LF/HF were calculated using the fast Fourier transformation [11]. In addition to the spectral measures of HRVwe also quantified self-similarity of the heart rate time seriesusing the Detrended Fluctuation Analysis (DFA) [23, 24].2.5. Cardiorespiratory Coordination. The mean respiratoryrate and its standard deviation were calculated. Cardiorespiratory coordination was quantified by two differentapproaches. (a) The ratio of heart rate and respiratory rate(HRR, heart respiration ratio) served as a simple indicatorof intermittent cardiorespiratory coordination [25]. (b) Furthermore, the “phase coordination ratio” (PCR) [14, 26] wascalculated because it also takes into account the temporalcoordination of heartbeat and respiration in more detail.This approach is advantageous compared to for example,analyzing cardiorespiratory synchronization using so-calledsynchrograms [12] because it is able to detect short and
Evidence-Based Complementary and Alternative Medicineintermittent epochs of cardiorespiratory coordination (coordination can be detected after only two consecutive respiratory cycles) [14], whereas the analysis of synchrograms needslonger epochs to detect cardiorespiratory synchronization[13, 17].The analysis was carried out as follows. First, the RRtachogram RR𝑖 (𝑖 1, . . . , 𝑁) was transformed into a symbolic sequence symbolizing the acceleration and decelerationof heart rate (Figure 2):𝑆𝑖 {0, if RR𝑖 RR𝑖 1 0,1, if RR𝑖 RR𝑖 1 0.(2)Next, 𝑚 : 𝑛-coordination of heartbeat and respirationleads to specific sequences of 0 s and 1 s. For example, a 7 : 2coordination (7 heartbeats during 2 respiratory cycles) isunambiguously characterized by the following binary pattern (Figure 1): 1001100. To minimize spurious detection ofcardiorespiratory coordination the respective pattern mustappear and also at least three subsequent symbols mustbelong to the same pattern. The following 7 𝑚 : 𝑛-ratios ofcardiorespiratory coordination contain large parts of relevantinformation: 3 : 1, 7 : 2, 4 : 1, 9 : 2, 5 : 1, 11 : 2, and 6 : 1 [14].The binary patterns reflecting these 𝑚 : 𝑛-ratios are listed inTable 1. Subsequently, the PCR was calculated as the weightedmean of the detected 𝑚 : 𝑛-ratios:PCR 7𝑖 1 𝑚 : 𝑛 𝑁 (𝑚 : 𝑛) 7𝑖 1 𝑁 (𝑚 : 𝑛).(3)Here, 𝑁(𝑚 : 𝑛) is the number of occurrences of the respective 𝑚 : 𝑛-ratio. To quantify cardiorespiratory coordinationHRR and PCR were calculated for the middle 5-minuteepochs of each visual stimulus.2.6. Statistics. The objective of this exploratory pilot studywas to assess the effects of red and blue visual stimuli onHRV and cardiorespiratory coordination. Each 5-minuteepoch was quantified by the following parameters: mean RRinterval, SDNN, VLF, LF, HF, LF/HF, mean and standarddeviation of respiratory rate, HRR, and PCR. To minimizeeffects of transitions between successive visual stimuli the5-minute epoch in the middle of each visual stimulus wasanalysed. A nonparametric 1-way analysis of variance withrepeated measurements (Friedman test) was used to quantifydifferences within the succession of different visual stimuli.Post hoc differences between different visual stimuli werecalculated using mean ranks and a correction for multiplecomparisons according to Bonferroni. A 𝑃 0.05 was considered statistically significant.A specific feature of HRR is the centering towards a ratioof 4 : 1 during nighttime sleep [17, 27]. We analyzed whethercardiorespiratory coordination centers more strict to this4 : 1-ratio during the exposure to colored light. Centering ofHRR towards 4 : 1 during color light is defined asHRRdur col HRRbef col 0,if HRRbef col 4 : 1,HRRdur col HRRbef col 0,if HRRbef col 4 : 1.(4)31 12:56:400 0 12:56:431 0 0 12:56:46Time1 1 0 0 12:56:49Figure 1: A short example of an ECG recording and the respiratorytrace (dashed line). The symbols denote the encoding of acceleration(1) and deceleration (0) of the instantaneous heart rate as aconsequence of respiratory sinus arrhythmia, that is, the modulationof heart rate by respiration. The sequence of binary symbols canbe used to detect cardiorespiratory coordination. In this example,a cardiorespiratory coordination with a ratio of 7 : 2 (7 heartbeats in2 respiratory cycles) would be detected.Table 1: Binary patterns used for the analysis of the different 𝑚 : 𝑛ratios of cardiorespiratory coordination.𝑚 : 𝑛-ratio3:17:24:19:25:111 : 26:1Binary patternComplementarybinary 111001110011100111000111000111000Furthermore, the larger the deviation of HRR before thecolor stimulus (HRRbef col ) from the 4 : 1-ratio the larger thecorresponding difference to achieve a centring (or confinement) towards 4 : 1 during the color stimulus (HRRdur col ).To quantify this centring, we plotted HRRbef col versus(HRRdur col HRRbef col ). According to the definition, centring is indicated by a negative correlation in this diagram.Hence, we calculated Pearson’s correlation coefficient 𝑟 andits accompanying 𝑃 value. Spurious correlations caused byoutliers were detected as follows: the correlation coefficientwas also calculated omitting the points of minimal and maximal difference HRRdur col HRRbef col . The correlation wasconsidered significant only if the 𝑃-value of both correlations(original and without outliers) was 𝑃 0.05. The centeringof PCR towards the 4 : 1-ratio was analyzed analogously.3. ResultsAn example of a complete RR-interval series, II-intervalseries, and heart respiration ratio (HRR) is shown in Figure 2.Note that the 5-minute epoch in the middle of each visualstimulus was analyzed. The level of illuminance was approx.50 lx during colored light. The average RR-interval was1002 ms (i.e., approx. 60 beats per minute) at the beginningand did not change during the succession of the differentvisual stimuli (see Table 2). SDNN as a measure in the time
Evidence-Based Complementary and Alternative Medicine1.2DaylightRedDaylightBlueDaylightII interval (s)RR-interval (s)41.00.80.68RedDaylightBlueDaylight64212:55 13:00 13:05 13:10 13:15 13:20 13:25 13:30 13:35 13:40TimeDaylight12:55 13:00 13:05 13:10 13:15 13:20 13:25 13:30 13:35 ht64212:55 13:00 13:05 13:10 13:15 13:20 13:25 13:30 13:35 13:40Time(c)Figure 2: Example of the RR-interval series, II-interval series, and the heart respiration ratio (HRR) of one subject. The sequence of the visualstimuli is shown in each diagram.Table 2: Results of HRV and cardiorespiratory coordination. All values are mean SD.RR-interval (ms)SDNN (ms)VLF (ln ms2 )LF (ln ms2 )§§HF (ln ms2 )§ln (LF/HF)§§§𝛼§§Resp. rate (min 1 )SD (resp. rate) (min 1 )HRRPCRDaylight1002 14973 316.61 0.756.84 ,# 0.887.33# 1.00 0.24 ,## 0.930.80 ,##, 0.1915.5 2.02.3 0.94.1 1.24.1 1.1Red light999 13274 336.88 0.756.94 0.987.10 1.000.12 0.870.94 0.2215.6 2.02.4 1.04.2 1.14.2 1.1Daylight992 12379 356.99 0.837.31 1.077.02 1.030.47 0.911.03 0.2315.8 2.03.0 0.94.2 1.24.1 1.2Blue light995 111378 337.31 0.757.18 0.996.91 1.230.39 0.741.06 0.2416.4 2.13.0 1.24.0 1.24.0 1.1Daylight986 10883 287.51 0.757.39 0.776.86 1.060.64 0.811.08 0.1916.2 2.82.9 1.84.2 1.34.0 1.1𝑃 0.05, §§ 𝑃 0.01, and §§§ 𝑃 0.001; 𝑃 0.05 versus daylight (end); 𝑃 0.01 versus daylight (end); # 𝑃 0.05 versus daylight (middle); ## 𝑃 0.01versus daylight (middle); 𝑃 0.05 versus blue light.§domain was constant throughout the procedure (73 ms). Inthe frequency domain LF, HF, and LF/HF showed variationswith respect to the sequence of the visual stimuli, whereas thechanges of VLF were slightly above the level of significance(𝑃 0.0526). LF was lower during daylight at the beginningcompared to daylight in the middle (6.84 ln ms2 versus7.31 ln ms2 , 𝑃 0.05) and daylight at the end (6.84 ln ms2versus 7.39 ln ms2 , 𝑃 0.05). Furthermore, LF was also lowerduring red light compared to daylight at the end (6.94 ln ms2versus 7.39 ln ms2 , 𝑃 0.05). On the contrary, HF was onlyhigher during daylight at the beginning compared to daylightin the middle (7.33 ln ms2 versus 7.02 ln ms2 , 𝑃 0.05). LF/HFwas lower during daylight at the beginning compared todaylight in the middle ( 0.24 versus 0.47; 𝑃 0.01) andcompared to daylight at the end ( 0.23 versus 0.64, 𝑃 0.01).With respect to fractal properties of heart rate variations theself-similarity parameter 𝛼 was also lower during daylight atthe beginning compared to daylight in the middle, blue lightand daylight at the end (0.80 versus 1.03, 𝑃 0.01; 0.80 versus1.06, 𝑃 0.05 and 0.80 versus 1.08, 𝑃 0.01).The average respiratory rate was 5.5 to 16.4 cycles perminute (cpm). The standard deviation of respiratory rateranged from 2.3 to 3.0 cpm. Both parameters did not changeduring the succession of the different visual stimuli. The average 𝑚 : 𝑛-ratio of cardiorespiratory coordination as quantifiedby HRR and PCR did not also change. They were both closeto 4 during the different visual stimuli.The centring (or confinement) of cardiorespiratory coordination with respect to the 4 : 1-ratio was as follows. Duringred light a clear linear relation was found in the centeringdiagram as indicated by the correlation coefficient 𝑟 (seeFigures 3(a) and 3(c); HRR: 𝑟 0.72, 𝑃 0.01; PCR:𝑟 0.68, 𝑃 0.01). Hence, the larger the deviation from 4during daylight before the color stimulus the larger the difference HRRdur col HRRbef col to achieve the centring (confinement) during the color light stimulus. As centring leads to
Evidence-Based Complementary and Alternative Medicine5Red2.0r 0.721.5r 0.35n.s.1.5P 0.011.0HRRdur col HRRbef col1.0HRRdur col HRRbef colBlue2.00.50.0 0.50.50.0 0.5 1.0 1.0 1.5 1.5 2.034HRRbef col5 2.0634HRRbef col(a)1.5r 0.68P 0.011.00.50.0 0.5r 0.64n.s.1.0PCRdur col PCRbef colPCRdur col PCRbef col6(b)1.50.50.0 0.5 1.0 1.0 1.553.03.54.04.5PCRbef col5.05.5 1.53.03.54.04.55.05.5PCRbef col(c)(d)Figure 3: Analysis of centering of cardiorespiratory coordination towards 4 : 1 during exposure to red and blue color lights. (a), (c) Duringred light the significant negative correlation coefficient 𝑟 for HRR and PCR indicates a centering towards 4 : 1. (b), (d) During blue light acentring does not occur; that is, the correlation is not significant. Note that in diagram (d) the high correlation 𝑟 is spuriously caused by theoutlier in the lower right part of the diagram. Dashed lines indicate average HRRbef col (and PCRbef col ) and average HRRdur col HRRbef col(and PCRdur col PCRbef col ), respectively.a narrower distribution of HRR (and PCR) the standard deviation of HRR (and PCR) was also lower during red light (seeTable 1). Note that centring does not affect the average HRR(and PCR). During blue light HRR and PCR did not centre(Figures 3(b) and 3(d); HRR: 𝑟 0.35, n.s., PCR: 𝑟 0.64,n.s.). Note that the relatively large correlation coefficient inFigure 3(d) is caused by the outlier (correlation coefficientwithout outlier: 𝑟 0.44, 𝑃 0.10). We also checkedcentring diagrams for all other combinations of visual stimuli.None of these centring diagrams showed a significant negative correlation, that is, centring towards the 4 : 1-ratio.4. DiscussionVisual stimuli of red and blue light without standardization ofilluminance did not change average heart rate and respiratory
6rate throughout the procedure. In brief, LF oscillationsincreased during the procedure whereas HF oscillationsdecreased during the first part of the procedure. LF/HFshowed more detailed results: this parameter only increasedduring the exposure to daylight. That is, red and blue lightsdid not alter LF/HF, whereas daylight in the middle anddaylight at the end did. The self-similarity parameter 𝛼increased during daylight at the end compared to daylightat the beginning. Furthermore, during red light cardiorespiratory coordination as expressed by HRR and PCR centred(confined) towards 4 : 1 (4 heartbeats in one respiratorycycle). That is, HRR and PCR were closer to 4 : 1 during redlight than during daylight at the beginning. Blue light did notshow any effect on cardiorespiratory coordination.Recent studies showed clear effects of visual stimuli onheart rate and HRV. Healthy subjects exposed to bright light( 5000 lx) showed an increase of the average heart rate [18].The authors state that the increase of heart rate may beprimarily dependent on the light-induced increase of sympathetic activity of the ANS. In another study, HRV was alteredduring the exposure to colored light for 10 minutes, whereasthe average heart rate did not change [20]. VLF oscillationsincreased during red and green lights, whereas they decreasedduring blue light. Straight after the color stimuli HRVreturned to the values that were observed before the colorstimulus. The origins of the VLF component are still a matterof debate [11, 28]. Some authors suggest that both, the verylow frequency variations of vagal baroreflex sensitivity andthe very low frequency variations of HRV, are caused by vagalmodulations [29]. Hence, the changes of the VLF componentcould be cautiously interpreted in terms of changes of vagalactivity. LF oscillations did not change and HF oscillationsdecreased during green light only. Hence, vagal activitydecreased during green light. These results were obtainedonly during the visual stimulation with a standardized level ofilluminance (700 lx). Visual stimuli with dim light (1 lx) alsoled to alterations of the ANS [21]. However, these results wereobtained after the visual stimulation. Heart rate decreasedafter visual stimulation with dim red, blue, and green lightscompared to baseline. LF oscillations increased after red andblue lights, whereas HF decreased after red light. As a consequence, the sympathovagal balance LF/HF decreased afterred light.In the present study we found an increase of LF oscillations and a decrease of HF oscillations after the visualstimulation with red light. That is, sympathetic oscillationsincreased, whereas parasympathetic oscillations decreasedafter red light. Consequently, LF/HF increased. These findings are in accordance with the above mentioned findings ofChoi et al. [21]. Furthermore, we found an increase of theself-similarity parameter 𝛼 after the red light stimulus. Thisincrease is associated with changes in the overall spectral density as 𝛼 reflects the 1/𝑓𝛽 decay of the spectrum. In this particular case, more power is shifted to lower frequencies after thered light stimulus. In contrast to previous findings, we did notfind any alteration of the average RR-interval, that is, averageheart rate, caused by a color light stimulus. The differencesduring the color light stimulus as described by Schäfer andKratky [20] could also not be confirmed.Evidence-Based Complementary and Alternative MedicineThe differences of the results with respect to the study bySchäfer and Kratky could be caused by the different levelsof illuminance (700 lx versus 30 to 100 lx). Even low levelsof illuminance may have an impact on the ANS because theipRCGs of the nonimage forming visual system even respondto few photons [30] and, hence, may also affect the SCN andthe ANS. The synaptically mediated response of the ipRCGscaused by low light stimulus [4] supports this notion.The only simultaneous effect during colored light exposure was the centring of cardiorespiratory coordinationtowards 4 : 1 during red light as indicated by HRR and PCR.Note that HRR is a simple measure of cardiorespiratorycoordination [25], whereas PCR is more strict with respect tothe temporal coordination of heart beat and respiration [14].Hence, during red light the coordination was adjusted suchthat the 4 : 1-ratio emerged. Such a coordination has beenobserved in healthy subjects during quiet rest [12, 13] as wellas during nighttime sleep [17, 27, 31]. The emergence of thiscoordination indicates a process of relaxation and recovery ofthe organism. We note that this kind of relaxation is differentfrom, for example, an increase of the high frequency oscillations of HRV as an indicator of increased vagal activity [32].With respect to the limitations we note that especiallythe effects of blue light may be confounded by the previousred light stimulus. The response of the ipRGCs upon visualstimuli is more sustained than that of conventional RGC [4].Hence, carry over effects could be responsible for the resultsof the blue light stimulus. A randomized balanced designwith respect to the succession of colored light stimuli mayalso reveal specific effects of blue light on HRV or cardiorespiratory coordination. Ideally, each color stimulus shouldbe investigated separately to avoid carry over effects. Theincrease of LF oscillations and decrease of HF oscillationsduring the procedure could be avoided if more time wouldbe allowed to acclimatize before starting the procedure.However, a longer adaptation period could also lead to anincreased tiredness caused by low levels of alertness duringthe adaptation period.In conclusion, the exposure to red light showed a centering of cardiorespiratory coordination towards 4 : 1. Furthermore, red and blue lights altered autonomic nervous functions as expressed by HRV. These results may lead to a rationale for the application of colored light as a therapeutic meansas used in Anthroposophic Arts Therapies. The physiologicalmechanisms leading to these alterations need to be explored.Conflict of InterestsThe authors declare that they have no conflict of interests.AcknowledgmentsThis study was supported by grants of Software AG Stiftung,Darmstadt, Germany (to Dirk Cysarz, Peter F. Matthiessen).The production of the colored glasses was also supported bythe Software AG Stiftung.
Evidence-Based Complementary and Alternative MedicineReferences[1] T. Roenneberg, S. Daan, and M. Merrow, “The art of entrainment,” Journal of Biological Rhythms, vol. 18, no. 3, pp. 183–194,2003.[2] T. Roenneberg, C. J. Kumar, and M. Merrow, “The humancircadian clock entrains to sun time,” Current Biology, vol. 17,no. 2, pp. R44–R45, 2007.[3] D. M. Berson, F. A. Dunn, and M. Takao, “Phototransduction byretinal ganglion cells that set the circadian clock,” Science, vol.295, no. 5557, pp. 1070–1073, 2002.[4] K. Y. Wong, F. A. Dunn, D. M. Graham, and D. M. Berson,“Synaptic influences on rat ganglion-cell photoreceptors,” TheJournal of Physiology, vol. 582, no. 1, pp. 279–296, 2007.[5] C. Papamichael, D. J. Skene, and V. L. Revell, “Human nonvisual responses to simultaneous presentation of blue and redmonochromatic light,” Journal of Biological Rhythms, vol. 27, no.1, pp. 70–78, 2012.[6] E. Drouyer, C. Rieux, R. A. Hut, and H. M. Cooper, “Responsesof suprachiasmatic nucleus neurons to light and dark adaptation: relative contributions of melanopsin and rod-cone inputs,”The Journal of Neuroscience, vol. 27, no. 36, pp. 9623–9631, 2007.[7] S. Hattar, H.-W. Liao, M. Takao, D. M. Berson, and K.-W. Yau,“Melanopsin-containing retinal ganglion cells: architecture,projections, and intrinsic photosensitivity,” Science, vol. 295, no.5557, pp. 1065–1070, 2002.[8] F. A. J. L. Scheer, A. Kalsbeek, and R. M. Buijs, “Cardiovascularcontrol by the suprachiasmatic nucleus: neural and neuroendocrine mechanisms in human and rat,” Biological Chemistry,vol. 384, no. 5, pp. 697–709, 2003.[9] F. A. J. L. Scheer, G. J. Ter Horst, J. Van Der Vliet, and R. M.Buijs, “Physiological and anatomic evidence for regulation ofthe heart by suprachiasmatic nucleus in rats,” American Journalof Physiology—Heart and Circulatory Physiology, vol. 280, no. 3,pp. H1391–H1399, 2001.[10] J. A. Hirsch and B. Bishop, “Respiratory sinus arrhythmia inhumans: how breathing pattern modulates heart rate,” AmericanJournal of Physiology—Heart and Circulatory Physiology, vol.241, no. 4, pp. H620–H629, 1981.[11] Task Force of the European Society of Cardiology and the NorthAmerican Society of Pacing and Electrophysiology, “Heart ratevariability: standards of measurement, physiological interpretation, and clinical use,” Circulation,
e ratio of heart rate and respiratory rate (HRR, heart respiration ratio) served as a simple indicator of intermittent cardiorespiratory coordination [ ]. (b) Fur-thermore, the phase coordination ratio (PCR) [ , ]was calculated because it also takes into account the temporal coordination of heartbeat and respiration in more detail.