Transcription
European Central BankDirectorate Risk ManagementRisk Analysis DivisionKen NyholmA Practitioner’s Guide to Yield CurveModellingLecture notes for an internal risk management training courseNovember 7, 2018First draftPlease note that: (1) the examples and MATLAB code contained in these lecture notes are provided withoutwarranty; (2) the presented materials do not necessarily reflect the official view of the European Central Bankon how yield curve modelling should be performed; and (3) the views presented in these lecture notes are notnecessarily shared by the European Central Bank.
PrefaceThese lecture notes were written during the fall of 2018 and are intended as background readings for aninternal two-day course in the Risk Management Directorate of the European Central Bank. I have strivedto be as comprehensive as possible in the coverage of the included materials, while adhering to the over allpremise that the notes should have a strong focus on the practical application of term structure models.To emphasise the applied nature of the lecture notes, I have included MATLAB transcripts at the endof most chapters, and the lecture notes are accompanied by a set of newly programmed MATLAB objectoriented classes that facilitates estimation the yield curve models used in the notes. Almost all the empiricalexamples and results shown in the notes can be replicated using the included MATLAB code. Of course,no warranty is provided for the code, and bugs are very likely still lurking around.A tentative course outline is given below (times are naturally tentative and depends on how much timeyou want to spend on the different topics):ChapterTopicsIntroductionLearning objectivesTimeDay 1. 9:30-9:451Empirical analysis of yield curve dataDay 1. 9:45 - 11:152The P and Q measuresDay 1. 11:15 - 12:15LunchDay 1. 12:15 - 13:153The basic yield curve modelling set-upDay 1. 13:15 - 15:154Modelling yields under the Q- measureDay 1. 15:15 - 17:155Model implementationDay 2. 10:00 - 11:156Scenario generation with yield curve modelsDay 2. 11:15 - 13:15LunchDay 2. 12:15 - 13:15Summary, discussion, and feedbackDay 2. 13:15 - 15:00The objective of the course is to make participants able to implement existing dynamic term structuremodels and to use them for scenario-generation purposes. The materials and examples cover both arbitragefree affine and Nelson-Siegel type models. Emphasis is put exclusively on developing practical modellingskills, and selected parts of the underlying theory are presented to meet this end.
VIPrefaceAn overview of the MATLAB classes that I have programmed to help digest the content of this course isprovided below. In addition to these generic functionalities I provide MATLAB scripts at the end of eachempirically tilted chapter. To provide an overview, a list of these script files is also provided below. Notethat all the provided codes can be inspected in MATLAB by typing edit and then the name of the codeyou want to see. It is recommended that the attached zip file is unpacked in a separate directory, and thatthe path (with sub-folders) is added to the MATLAB path.The data that are used throughout these lecture notes are contained in the MATLAB files:Data TSM Course 2018.mat and Data GSW factors Course 2018.mat .To illustrate how shadow-short rate models work, I have created a small graphical MATLAB add-in.This add-in can be installed by double clicking on the file name: ShadowRateExample.mlappinstall. Moreinformation on this is provided in chapter 3.5.GSW.m is a class-file that can be used to convert Gurkaynak, Sack, and Wright (2006) yield curve factors,and in general Svensson and Söderlind (1997) factors, into yields at a set of pre-specified maturity points.The help file for this class is shown below.
PrefaceVIITSM.m is a class-file that allows for the estimation of various term structure models. The help file forthis class is reproduced below.
VIIIPrefaceTSM2SSM.m is a class that translates an estimated TSM model into MATLAB’s state-space format. Thisis for example relevant if we want to use MATLAB’s built-in kalman-filter routines to generate conditionalprojections for the estimated yield curve factors. Once a TSM model has been estimated, the TSM2SSMclass can be used to translate the model into SSM format. The help file for this class file is shown below.EX Script Classes.m is a script filed that provides information on how class files are run. Many more examplesare given in the end-chapter codes listed below:1.2.3.4.5.6.7.1Empirical Investigation of Observed Yields.mP and Q Measure Vasicek State Space.mP and Q Measure Vasicek 2 step approach.mBasic yield curve setup.mModelling yields under Q.mP and Q Measure 1.m1Scenario and forecasting.mUsed just for illustration, not shown as end-chapter code.
Contents1Empirical analysis of term structure data . . . . . . . . . . . . . . . . . . . . . . . . . . . . . . . . . . . . . . . . . . . 11.1 Introduction . . . . . . . . . . . . . . . . . . . . . . . . . . . . . . . . . . . . . . . . . . . . . . . . . . . . . . . . . . . . . . . . . . . . . 11.2 Exploring yield curve data . . . . . . . . . . . . . . . . . . . . . . . . . . . . . . . . . . . . . . . . . . . . . . . . . . . . . . . . . 21.3 A first look at Principal Component models . . . . . . . . . . . . . . . . . . . . . . . . . . . . . . . . . . . . . . . . . 61.4 Exercises . . . . . . . . . . . . . . . . . . . . . . . . . . . . . . . . . . . . . . . . . . . . . . . . . . . . . . . . . . . . . . . . . . . . . . . . 151.5 MATLAB code . . . . . . . . . . . . . . . . . . . . . . . . . . . . . . . . . . . . . . . . . . . . . . . . . . . . . . . . . . . . . . . . . . . 162The P and Q measures . . . . . . . . . . . . . . . . . . . . . . . . . . . . . . . . . . . . . . . . . . . . . . . . . . . . . . . . . . . . . .2.1 Introduction . . . . . . . . . . . . . . . . . . . . . . . . . . . . . . . . . . . . . . . . . . . . . . . . . . . . . . . . . . . . . . . . . . . . .2.2 Switching between measures . . . . . . . . . . . . . . . . . . . . . . . . . . . . . . . . . . . . . . . . . . . . . . . . . . . . . . .2.3 A simplified empirical example . . . . . . . . . . . . . . . . . . . . . . . . . . . . . . . . . . . . . . . . . . . . . . . . . . . . .2.4 A generic discrete-time one-factor model . . . . . . . . . . . . . . . . . . . . . . . . . . . . . . . . . . . . . . . . . . . .2.4.1 Estimating the short-rate model . . . . . . . . . . . . . . . . . . . . . . . . . . . . . . . . . . . . . . . . . . . . . .2.5 Summary . . . . . . . . . . . . . . . . . . . . . . . . . . . . . . . . . . . . . . . . . . . . . . . . . . . . . . . . . . . . . . . . . . . . . . . .2.6 Appendix: MATLAB code . . . . . . . . . . . . . . . . . . . . . . . . . . . . . . . . . . . . . . . . . . . . . . . . . . . . . . . . .2.6.1 A discrete-time Vasicek model: state-space estimation . . . . . . . . . . . . . . . . . . . . . . . . . . .2.6.2 A discrete-time Vasicek model: two-step estimation procedure . . . . . . . . . . . . . . . . . . . .232323262833363838423The Basic Yield Curve Modelling Set-up . . . . . . . . . . . . . . . . . . . . . . . . . . . . . . . . . . . . . . . . . . .3.1 Introduction . . . . . . . . . . . . . . . . . . . . . . . . . . . . . . . . . . . . . . . . . . . . . . . . . . . . . . . . . . . . . . . . . . . . .3.2 The factor structure of yields . . . . . . . . . . . . . . . . . . . . . . . . . . . . . . . . . . . . . . . . . . . . . . . . . . . . . .3.3 Rotating the yield curve factors . . . . . . . . . . . . . . . . . . . . . . . . . . . . . . . . . . . . . . . . . . . . . . . . . . . .3.3.1 A short rate based model . . . . . . . . . . . . . . . . . . . . . . . . . . . . . . . . . . . . . . . . . . . . . . . . . . . .3.3.2 Using yields as factors . . . . . . . . . . . . . . . . . . . . . . . . . . . . . . . . . . . . . . . . . . . . . . . . . . . . . .3.4 The building blocks that shape the yield curve . . . . . . . . . . . . . . . . . . . . . . . . . . . . . . . . . . . . . . .3.5 Modelling yields at the lower bound . . . . . . . . . . . . . . . . . . . . . . . . . . . . . . . . . . . . . . . . . . . . . . . .3.6 Summary . . . . . . . . . . . . . . . . . . . . . . . . . . . . . . . . . . . . . . . . . . . . . . . . . . . . . . . . . . . . . . . . . . . . . . . .3.7 Appendix: MATLAB code . . . . . . . . . . . . . . . . . . . . . . . . . . . . . . . . . . . . . . . . . . . . . . . . . . . . . . . . .3.7.1 Yield curve model estimation via the SSM toolbox . . . . . . . . . . . . . . . . . . . . . . . . . . . . . .45454554555658697577774Modelling Yields under the Q-measure . . . . . . . . . . . . . . . . . . . . . . . . . . . . . . . . . . . . . . . . . . . . .4.1 Introduction . . . . . . . . . . . . . . . . . . . . . . . . . . . . . . . . . . . . . . . . . . . . . . . . . . . . . . . . . . . . . . . . . . . . .4.2 A discrete-time 4-factor SRB model . . . . . . . . . . . . . . . . . . . . . . . . . . . . . . . . . . . . . . . . . . . . . . . . .4.2.1 The relationship between the SRB model and the Joslin, Singleton and Zhu (2011)framework . . . . . . . . . . . . . . . . . . . . . . . . . . . . . . . . . . . . . . . . . . . . . . . . . . . . . . . . . . . . . . . . .4.2.2 The relationship between the 4-factor SRB model and the Svensson-Söderlind model4.3 Appendix: MATLAB code . . . . . . . . . . . . . . . . . . . . . . . . . . . . . . . . . . . . . . . . . . . . . . . . . . . . . . . . .4.3.1 Yield curve model estimation via the SSM toolbox . . . . . . . . . . . . . . . . . . . . . . . . . . . . . .8989899599101101
X56ContentsModel implementation . . . . . . . . . . . . . . . . . . . . . . . . . . . . . . . . . . . . . . . . . . . . . . . . . . . . . . . . . . . . . .5.1 Introduction . . . . . . . . . . . . . . . . . . . . . . . . . . . . . . . . . . . . . . . . . . . . . . . . . . . . . . . . . . . . . . . . . . . . .5.2 Implementing the Joslin, Singleton and Zhu (2011) model . . . . . . . . . . . . . . . . . . . . . . . . . . . . .5.3 Implementing the arbitrage-free SRB model . . . . . . . . . . . . . . . . . . . . . . . . . . . . . . . . . . . . . . . . . .5.4 Constructing a model with the short rate and the 10-year term premium as underlyingfactors . . . . . . . . . . . . . . . . . . . . . . . . . . . . . . . . . . . . . . . . . . . . . . . . . . . . . . . . . . . . . . . . . . . . . . . . . .103103103108Scenario generation with yield curve models . . . . . . . . . . . . . . . . . . . . . . . . . . . . . . . . . . . . . . . .6.1 Introduction . . . . . . . . . . . . . . . . . . . . . . . . . . . . . . . . . . . . . . . . . . . . . . . . . . . . . . . . . . . . . . . . . . . . .6.1.1 The horse-race . . . . . . . . . . . . . . . . . . . . . . . . . . . . . . . . . . . . . . . . . . . . . . . . . . . . . . . . . . . . .6.1.2 Conditional projections . . . . . . . . . . . . . . . . . . . . . . . . . . . . . . . . . . . . . . . . . . . . . . . . . . . . .6.1.3 Fix-point scenarios . . . . . . . . . . . . . . . . . . . . . . . . . . . . . . . . . . . . . . . . . . . . . . . . . . . . . . . . .6.2 MATLAB code . . . . . . . . . . . . . . . . . . . . . . . . . . . . . . . . . . . . . . . . . . . . . . . . . . . . . . . . . . . . . . . . . . .111111111116121124109References . . . . . . . . . . . . . . . . . . . . . . . . . . . . . . . . . . . . . . . . . . . . . . . . . . . . . . . . . . . . . . . . . . . . . . . . . . . . . . 131
1Empirical analysis of term structure data1.1 IntroductionBefore looking at the empirical behaviour of yields, we need to introduce some notation. Let ytτ denote aset of yields that together form a yield curve, i.e. a vector that stacks individual annual yields, with thesame dating, t, but that are observed at different maturities, τ . In the practical examples included in theselecture notes, we will typically use τ {3, 12, 24, . . . , 120} months, but τ can naturally take any value, atwhich yields are observed. When referring to a panel of yield observations (of dimension number of datesby number of maturities), i.e. a collection of yield curves observed at different dates, we will either writey, y τ , or Y .In a factor model, X, will denote the extracted factors, and H, G, or B, will typically denote thecorresponding loading matrix. Vector autoregressive models will be written as zt m Φ · (zt 1 m) et ,when written in mean-adjusted form, and sometimes as zt c Φ · zt 1 et , when written in constantform, i.e. m [I Φ] 1 · c.At this point it may also be worth recalling that the yield curve is a by-product of the financial markettrading process. Agents trade bonds that are quoted in prices, pτt . A risk free bond, the ones we primarilydeal with here, guarantee to pay Eur 1 (in reality some scaling of 1, most often Eur 100) at the maturityof the bond. The price today is therefore, as always in finance, the discounted value of the future promise(to avoid confusion on the notation used, note that here ytτ refers to a number, e.g. 0.05 (5%), and not toa number that is raised to the power τ (the same goes for Ptτ ), however, on the RHS of the equation, the τexpression is raised to the power of τ ): Ptτ 1 · (1 ytτ )Ptτ 1 · e ytτ ·τ1/ τ ytτ (Ptτ ) 1, in discrete time, and ytτ τ1 · log (Ptτ ), in continuous time.We will exclusively be modelling Zero coupon bonds. Such data are important because they form thebasis for fixed income pricing: since all coupon paying bonds can be expressed as portfolios of zero couponbonds (of relevant maturities), once we know the prices of zero coupon bonds, we can also find the marketequilibrium price all existing coupon paying bonds. Most often, however, we do not work with prices, butinstead focus on rates/yields, i.e. on the annualised percentage return the bonds gives, if we hold it to
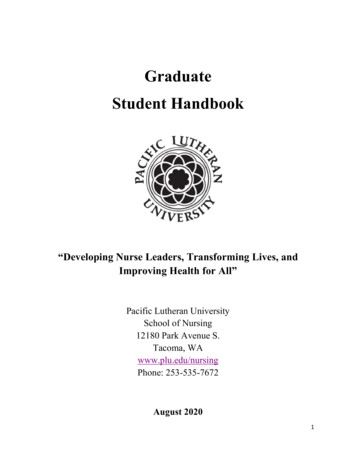
21 Empirical analysis of term structure datamaturity. As implied by its name, a zero coupon bond does not pay any coupons during its life, and itscashflow stream is therefore simple, as illustrated in figure 1.1 for zero coupon bonds of 1, 2, and 10-yearmaturities.1ePtτ 1y1y1e1y2y1e1y2y10yPtτ 2yPtτ 10yFig. 1.1. Zero coupon cashflowsTypically, we get zero coupon data from Bloomberg, Reuters, or the ECB’s statistical data warehouse.These data are available at daily, weekly, and monthly observation frequencies, and at predefined targetmaturities, for example at {0.25, 1, 2, . . . , 10, 15, 20, 30} years.1.2 Exploring yield curve dataThe example data used in this section are stored in the MATLAB workspace file named ”Data TSM Course 2018.Data are available for the US, Germany, and for the euro area OIS curve. For each segment we have yieldsin percent per annum across maturities, as well as model based estimates for the expectations componentand the term premium, both for the 10 year maturity point. We will return to these latter two variableslater on, and for now only focus on the yield curve data. Let’s load and plot these data: each data setcontains monthly observations for the following variables: date, yield3m, yield1Y, yield2Y, ., yield10Y,and spans the period from January 1999 to April 2018, i.e. a total of 232 time series observations for each ofthe 6 included maturities per yield curve segment. In addition to the time series evolution of yields shownin Figure 1.2 it is also informative to see what the yield curve looks like in the cross sectional dimension.For example, what does the average yield curve look like? And, what are some of the most extreme shapesand locations that yield have displayed historically? These questions are explored below.
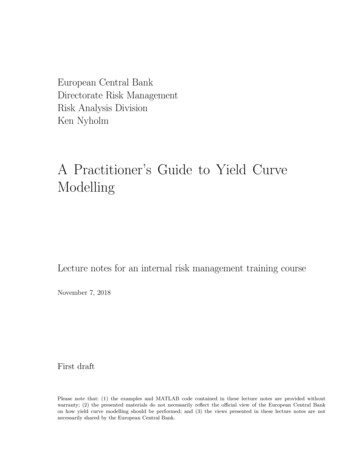
1.2 Exploring yield curve dataUS yield n-17Jan-20(pct)Germany yield data420Jan-99Jan-02Jan-05Jan-11Euro he figure shows the time series of yields, observed monthly and covering the period from January1999 to April 2018, for maturities of 3-months, 1-year, 2-year, 5-year, 7-year, and 10-year. Yieldsfor the US, Germany, and the euro area are included in the plot.Fig. 1.2. Yield curve ec-20090.50m3y1y2y5y7y10The figure shows German yield curves on the days when the slope (y τ 10y -y τ 3m ) reached itsminimum, maximum and average value, for the period from January 1999 to April 2018.Fig. 1.4. German yields with varying slopes3
41 Empirical analysis of term structure data654Pct3210MeanMedianMinMax-1-2m3y1y2y5y7y10The figure shows the mean, median, min, and max of the German yields observed at a monthlyfrequency and covering the period from January 1999 to April 2018. The statistics are calculatedacross maturities.Fig. 1.3. Summary of German yield curve dataNone of the curves shown in Figures 1.3 and 1.4 may actually have materialised historically, since thecalculations are done for each of the maturity points separately.Going back to the time series plots of the yields observed for the US, German, and OIS market segments,it is also interesting to observe that there is a very high degree of correlation among yields within a givenmarket segment, and that a similarly high degree of correlation exists between market segments. It almostseems as if every little up- and down-ward movement in one maturity is mirrored by the other maturitiesin that market segments, with more pronounced movements the higher the maturity. Similarly, the secularswings that yields display over the 20 years of data are equally well visible across market segments.A more structured view on the within and between segment correlation is illustrated below. Forpresentational purposes, correlations are shown only for a subset of the included maturities.Figure 1.5 provides a visual representation of the correlation between German and US yields. If wehad included other or additional yield curve segments, in addition to the 3months, 5year, and 10yearmaturities, we would get qualitatively identical results. As expected based on the visual inspection of thetime series plots, the cross correlations confirm our suspicion: yields within and across yield segments arevery highly correlated. Note that a red number in the above correlation matrix indicates that the correlationis statistically significant from zero at a 1% significance level.We could repeat the above correlation analysis for the first differences of the yield series - this wouldfor example make sense, if yields were believed to be I(1) processes (i.e. integrated of order one). And, ifwe did this, we would obtain a correlation picture that is qualitatively identical to the one above.
1.2 Exploring yield curve data5The figure shows the pair-wise correlation between US and German yields observed at a monthlyfrequency and covering the period from January 1999 to April 2018. Correlations are calculatedbetween the 3-month, 5-year, and 10-year maturity points. In each sub-element of the figure, thered number indicates the correlation coefficient, and the red line shows the fitted regression line.On the diagonal, histograms of the series are plotted.Fig. 1.5. Yield curve dataNow, looking at the time series plots of the yield curve segments above, the conclusion that one mayreach, based on a preliminary and casual visual inspection, is that the behaviour displayed by yields issomewhat different from what most people have in the back of their mind, when they think about thetrajectory of a stationary I(0) process. While this is a relevant thought, the discussion of stationarity willbe taken up later on, when we discuss the eigenvalues of estimated vector autoregressive processes (VARmodels - not to be confused with VaR, i.e. value-at -risk). For now, we treat observed yields as comingfrom a stationary data generating process.How can the overwhelming degree of correlation between yields be exploited? The answer is: by usingPrincipal Component Analysis (PCA)/ factor models. At this stage, it is worth noting that virtually allterm structure models, as well as many other important financial models, e.g. ATP and CAPM for equityreturn modelling, rely heavily on PCA modelling principles. In fact, this econometric technique is quite
61 Empirical analysis of term structure datapossibly the single mostly important modelling idea, in the field of quantitative time-series finance - to mymind, it is as important as PDEs (partial differential equations) are to the branch of finance that dealswith derivative pricing. It is therefore fairly important to master this technique. The good news is, that itis not difficult at all.Before embarking on the factor modelling principle, it is worth spending a few minutes on realising thatmodelling multiple yields directly is generally not a good idea. Arguments against this modelling strategyare, amongst others: The number of yields modelled may vary from market to market and over time. It is therefore not clearwhich maturities that should be included in the model. One may need to adapt the dimension of the model, depending on which market that is modelled. Thisis inconvenient as well as model results may not be comparable. Since correlation between yields is so high, we may run into the problem of multicollinearity Projected yield curves and yield curve forecasts may turn out to violate standard regularities, e.g.individual yield curve points may be out of sync with the rest of the curve. The econometrician has very little control over the simulations, for example, it is difficult to steer theprojections in a certain direction, if that is desired. Likewise, it is difficult to avoid certain (unrealistic)yield curve shapes and developments.This last point is illustrated in Figure 1.6, using the German data. It is dangerous these days to makestatements about whether a given simulated yield curve has a realistic shape or not - and the futuremay prove me wrong - but despite what we have seen over the past years, I believe that the depictedsimulated curves in Figure 1.7 are too oddly shaped to be considered for financial analysis (unless for somewild economic scenario): this applies to their shape and location, and to the overall simulated trajectory(Figure 1.6) for the yields over the coming 42 months. One may of course have a rule-of-thumb and programa routine that kicks out too oddly looking yield constellations and trajectories, but why bother? Why notsimply follow the mainstream and well proven approach, i.e. to rely on factor models? This is what we willdo next.1.3 A first look at Principal Component modelsDimension reduction is one of the great feats of PCA / factors models: the core idea is that the majorityof the variability of a given data set derives from a few underlying (sometimes not directly observable)factors. This concept is familiar, for example, the well-known CAPM prescribes that a single market factoris responsible for the expected return on all equities traded in the economy. Recall that the security marketline is written as: E[ri ] rf βi · (rm rf ), where investors are rewarded only for taking market risk inexcess of the risk free rate. rm is the return on the market portfolio, i.e. the underlying factor in this model,
1.3 A first look at Principal Component 0Jan-21Jan-22The figure shows how one can do naive forecasts of the yield curve, and what problems this maybring. A VAR model is fitted to individual maturity points using the full historical sample (from1999 to 2018) of German yields. Each maturity is then projected 42 monthly periods ahead usingthe VAR. These projections are started at the last observation covered by the data sample.Fig. 1.6. Yield curve datarf is the observable risk free rate, and βi is the sensitivity of the i’th security’s return, ri . In factor modellanguage, rf is the constant, rm is the underlying factor, and βi is the factor sensitivity that translatesthe factor observation into something that is applicable to the i’th security. We can naturally operate withmore than one factor. Typically, term structure models include between 1 and 5 factors.In general terms, and using matrix notation, we can write a factor model for the yield data in thefollowing way:Yt {z}nτ 1G {z}·Xt {z}nτ nF nF 1Σ {z}·et {z}et N (0, I)(1.1)nτ nτ nτ 1The dimensions of the variables are recorded below each entry, with nτ being the number of maturitiesthat together form the yield curve, and nF being the number of included factors. So, our first job whenusing factor models is to settle on an appropriate number of factor to extract, i.e. to choose nF . But beforegetting to that point lets first get more familiar with the factor model concept.Looking at the expression for Yt in (1.1) indicates that if we know the factor loadings G, then we canfind the factors Xt using linear regression, or by inversion. Underline the previous sentence! - we will usethis ’trick’ extensively when dealing with Nelson-Siegel type yield curve models later on. To preview a bit,
81 Empirical analysis of term structure 3122460Nov-21-0.5-1-1.5-23122460The figure shows randomly selected sample curves picked among the 42 projected curves.Fig. 1.7. Yield curve datalet’s quickly see how to back out the factors X using the full set of data - as mentioned, we will return tothis issue in greater detail later on. First we write the above expression in terms of the full data set:E [Y ] {z }(nτ nObs) G {z}·X {z}nτ nF nF nObswhere nObs is the number of dates the data spans. Assume G is known, then, in the context of an OLSregression, G represents the explanatory variables and X the parameters to be estimated. We can thereforefind X in the following ways:X̂ G 1 · Y(1.2)orX̂ (G0 · G) 1 · G0 · Y(1.3)where the first equation in (1.2) represents a pure inversion, and the second is the standard OLS formula.Returning to the main topic of this section, i.e. factor models, let’s see if the OIS and US data hide someinteresting underlying patterns (i.e. factors), and let’s try to construct a completely data-driven joint modelfor these to yield curve segments on the basis of such underlying factors.
1.3 A first look at Principal Component models9The intention here is only to show how factor models can be useful for modelling term structure data,without infusing any term structure modelling knowledge - in other words, the illustrated strategy may bewhat an econometrician would choose to do, if she had not received any term structure schooling. Lateron in the course, it will become clear, that such an econometrician can actually be quite successful atmodelling term structure data!A clarification about the term “factor models” is warranted here. When I refer to ”factor models”and ”factors” I do in fact mean ”Principal Components”, i.e. the outcome of applying the PCA functionin MATLAB. So, through-out, it assume that yield curve factors can be formed as weighted averages ofobserved yields. Alternatively, if a true factor modelling approach was applied, the starting point would besome underlying latent factors that were causing the evolution observed in the yield curve, and we wouldtry to extract these factors. As we shall see, we will typically revert to factors that are directly interpretablein terms of yield curve observables, e.g. the level, slope and curvature of the yields curve, or actual maturitypoints on the yield curve - we will not, however, include unobservable quantities, such as e.g. the effectivestance of monetary policy, or the natural long-term rate, as factors in the models that we work with inthese lecture notes.Individual eigenvalues express how much of the overall variability in the data set, the respectiveeigenvector explains. To help decide how many factors that we need to include in our model, we cantherefore link the number of factors to the overall variance that we want our model to capture. Table 1.3shows the cumulative fraction explained by the first six extracted principal components/factors explain ofthe US and euro area OIS data. So, 4 factors capture 100% of the historical variability of both US yields1st2nd3rd4th5th6thUSEA OIS0.9453 0.97550.9958 0.99820.9992 1.00000.9999 1.00001.0000 1.00001.0000 1.0000The table shows the cumulative fraction of variability explained by the principal componentsextracted from US and euro area yield curve data. The data covers the period from January 1999to April 2018 and are observed monthly. The following yearly maturity points are included in thedata sets: 0.25, 1, 2, 5, 7, 10.Table 1.1. Cumulative variability explained by the extracted yield curve factorsand OIS rates. That such a low number of factors explain all the variability underscores the high degreeof cross-sectional correlation that we also documented above. If we believe that some of the variability inthe observed data is due to noise, we should chose to model less than 4 factors: we don’t want a model
101 Empirical analysis of term structure datathat propagates idiosyncratic noise from the past into the future. 3 factors also look to be on the high side,so a sensible choice may be to include 2 factors. In fact, the explained variability may suggest that only 1factor is needed, since the most important factor explains 95% of the variability in the US data, and 98% ofthe variability in the OIS data. But, a model with just one factor is quite boring: in terms of e.g. scenariodynamics, it can only generate parallel shifts of the yield curve (i.e. duration effects), so also with a viewto the type of yield curve perturbations a model can generate, it may be advisable to include a minimumof 2 factors.But wait. If we want to construct a joint model for the two yield curve segments, perhaps it makessense to include only one base segment and model the other segment as a spread curve against the chosenbase-curve. What does the load
1 Empirical analysis of yield curve data Day 1. 9:45 - 11:15 2 The P and Q measures Day 1. 11:15 - 12:15 Lunch Day 1. 12:15 - 13:15 3 The basic yield curve modelling set-up Day 1. 13:15 - 15:15 4 Modelling yields under the Q- measure Day 1. 15:15 - 17:15 5 Model implementation Day 2. 10:00 - 11:15