Transcription
PUBLICHEALTHBULLETINVOLUME 23 NUMBER 2APRIL 2011In this issue: Packaging and shipping infectious substancesHospital discharge survey, South Dakota 2000-2009South Dakota rabies surveillance, 20102011 child and adolescent immunization schedulesSelected morbidity report, January - February 2011page 3page 4page 30page 35page 38Colorectal Cancer in South DakotaBy the South Dakota Cancer Registry, South Dakota Department of HealthThe South Dakota Cancer Registry has released the 2008 colorectal cancer data. For 2004-2008, theaverage number of new colorectal cancer cases per year was 433 and the average number of annualdeaths due to colorectal cancer was 160.Incidence 2008Number of casesTotal425Males226Females199White396American Indian24Median age at diagnosis72 yrsMode76 yrsAge range at diagnosis31-102 yrsSD age-adjusted incidence rate51.9US SEER age-adjusted incidence rate (2007)*45.5Rates per 100,000 US 2000 standard population* 2008 US SEER age-adjusted rates not availableSource: South Dakota Department of HealthMortality 2008Number of deathsTotal153Males79Females74White138American Indian13Median age at death73 yrsMode63 yrsAge range at death39-104 yrsSD age-adjusted death rate18.3US SEER age-adjusted death rate (2007)*16.7Unknown6%Insitu4%The graph at the right displays the SEER (Surveillance,Epidemiology, and End Results) Summary Stage atDistantdiagnosis for 2008 colorectal cancer cases. As16%shown, almost half of the cases were diagnosed at themore advanced stages of regional and distant. Patientsurvival rates decline when diagnosed at a more advancedstage.Regional28%Source: South Dakota Department of HealthLocalized46%
See below for the age-adjusted colorectal cancer incidence rates for the United States andSouth Dakota for 2001-2007. Except for 2002, South Dakota rates have been close to thenational rates.Colorectal Incidence Rates, US and SD100United StatesSouth : SEER and South Dakota Department of HealthThe age-adjusted colorectal cancer mortality rates are shown below for the United Statesand South Dakota for 2001-2007.Colorectal Mortality Rates, US and SDUnited States25South Dakota201510502001200220032004200520062007Sources: SEER and South Dakota Department of HealthColorectal Cancer Screening Program in South DakotaTo increase colorectal cancer screening, the South Dakota Department of Healthimplemented a colorectal screening program June 1, 2010. While the program focus is toraise awareness for all South Dakotans, the program provides direct colorectal screeningservices through participating medical providers for patients that qualify.Colorectal Cancer Screening Program eligibility criteria are based on the following: Age:50 and older Income:200% of the Federal Poverty Guideline Insurance:Underinsured or uninsured for colorectal cancer screeningBRFSS Colorectal Cancer Screening DataThe recommendation for colorectal cancer screening is a blood stool test every year or asigmoidoscopy/ colonoscopy every ten years for persons age 50 years of age or older. ForSouth Dakota Public Health Bulletin – April 2011 – Page 2
Behavioral Risk Factor Surveillance System (BRFSS) data, see below for percentages ofcolorectal cancer screening in South Dakota. As shown, a third of South Dakotans do notparticipate in screening.South Dakotans 2010 Participation InRecommended Colorectal Cancer ScreeningsParticipatedNo Participationin Screeningin ScreeningBlood Stool Test OnlySigmoidoscopy/Colonoscopy OnlyBoth – Blood StoolTest andSigmoidoscopy/ColonoscopyTotal2.7%South Dakotans 2001-2010 Participation InRecommended Colorectal Cancer urce: Behavior Risk Factor Surveillance System 2001-2002, 2004, 2006, 2008 *2010 (*2010 data is provisional)For additional information, please contact Kay Dosch, SD Cancer Registry Coordinator, at605-773-6345 or 800-592-1861 or see the website at http://getscreened.sd.gov/registry/ for theentire colorectal cancer monograph.Packaging and Shipping Infectious Substances Class OfferedThe South Dakota Public Health Laboratory is offering a 2011 update training on packaging andshipping infectious substances. Instructors for the course are from the Hazardous MaterialsDivision of the U.S. Department of Transportation Safety Institute.The course will cover an overview of federal Hazardous Materials Regulations (49 CFR Parts100-185); definition of infectious substances; exceptions; packaging; documentation; marking,labeling, and placarding; emergency response information; training; and ICAO/IATA.There is no cost for the course but registration is required as class size is limited to 20 studentsper location. Classes will be held April 26 in Chamberlain, April 27 in Brookings and April 29in Rapid City and run from 8 a.m. to 5 p.m. Registration information is available athttp://doh.sd.gov/Lab/.South Dakota Public Health Bulletin – April 2011 – Page 3
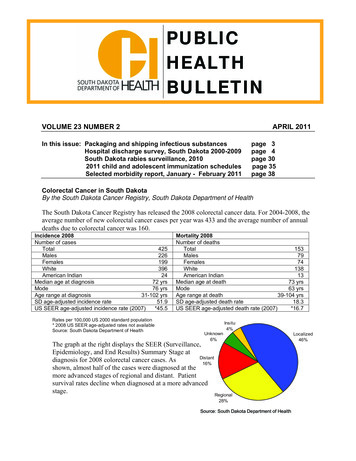
Hospital Discharge Survey, South Dakota, 2000-2009This report summarizes a decade of South Dakota hospital discharge data from 2000 through2009. These inpatient data are presented as numbers, percentages and population-based rates forthe overall state, four geographic sub-regions, gender, race groups and age groups.The principal diagnosis hospital discharge data were collected, coded and submitted by SouthDakota community and specialty hospitals to the South Dakota Association for HealthcareAssociation (SDAHO). The data were purchased by the South Dakota Department of Healthfrom SDAHO including admission date, age, sex race, county of residence, and diagnosis codesgrouped by principal diagnosis based on the International Classification of Diseases 9th Revision(ICD-9). The datasets contained no identifiable patient or hospital-specific information. Federalhospitals did not submit discharge data, i.e., Veterans Administration and Indian Health Servicehospitals, and neither did the South Dakota Human Services Center. South Dakota residentswho were hospitalized out of state are not included. The data analysis is done by the SouthDakota Department of Health using SAS Enterprise Guide (Version 4.2, SAS Institute, Inc., Cary, NC).The 4 regions include the following counties which are grouped according to patient county-ofresidence and the rates were calculated using the 2009 population estimates as denominators:1. Northeast (population 199,771; 25%): Beadle, Brookings,Brown, Campbell, Clark, Codington, Day, Deuel, Edmunds,Faulk, Grant, Hamlin, Hand, Hughes, Hyde, Kingsbury,Marshall, McPherson, Potter, Roberts, Spink, Sully,Walworth.2. Northwest (population 78,166; 10%): Corson, Butte,Dewey, Haakon, Harding, Lawrence, Meade, Perkins,Stanley, Ziebach.3. Southeast (population 376,092; 46%): Aurora, BonHomme, Brule, Buffalo, Charles Mix, Clay, Davison,Douglas, Gregory, Hanson, Hutchinson, Jerauld, Lake, Lincoln, McCook, Miner, Minnehaha, Moody,Sanborn, Turner, Union, Yankton.4. Southwest (population 158,354; 19%): Bennett, Custer, Fall River, Jackson, Jones, Lyman, Mellette,Pennington, Shannon, Todd, Tripp.Figure 1. Number of principal hospital discharges reported, South Dakota, 1110,428111,802112,846112,5832005 (58hospitals)2006 (58hospitals)2007 (58hospitals)2008 (58hospitals)2009 (58hospitals)102,88398,21094,58890,0002000 (42hospitals)2001 (46hospitals)2002 (46hospitals)2003 (49hospitals)2004 (51hospitals)In the decade 2000-2009 there were 1,063,683 principal hospital discharges, includingnewborns, reported. Of these 86% were residents of South Dakota and 14% were residents ofother states who received health care in South Dakota hospitals. The hospitalization numbersranged from 94,588 in 2000 to 112,846 in 2008 (Figure 1). During the decade the number ofhospitals reporting increased from 42 hospitals in 2000 to 58 in 2005 and thereafter.South Dakota Public Health Bulletin – April 2011 – Page 4
The overall discharge rate was 11,284 per 100,000 population per year for South Dakotaresidents. Fifty-nine percent of the hospitalizations were of female patients and 41% malepatients. Females had higher hospitalization rates than males in all disease groups, exceptcongenital anomalies, conditions in the perinatal period, and diseases of the circulatory system.Eighty-one percent of hospitalizations were Whiterace patients, 8% American Indian patients, and lessthan 1% for any of the other race groups, but 9% ofpatient’s race were unknown or not reported (Table1). The rate of American Indian patients is notrepresentative of the full state, since Indian HealthService hospitals did not submit discharge data.Table 1. Race of hospitalizations, South Dakota,2000-2009NumberPercentRaceWhiteAmerican IndianAfrican American / BlackAsianHispanic of any RaceHawaiian/Pacific 986,7453,589798118212099,2781,063,68381%8% 1% 1% 1% 1% 1% 1%9%100%The hospitalization numbers vary by life-stage ofthe patients (Figure 2 and Table 2). The first yearof life has the most hospitalizations with 12%overall and an average of 12,836 per year (infants 1 year not shown in Figure 2). The first dayof life (i.e., birth day) accounted 111,057 hospitalizations, which were 10% of allhospitalizations, and 86% of first-year hospitalizations. The elderly age group, 65 years andolder, account for 40% of all hospitalizations, followed by middle age adults ages 40-64 yearsaccounting for 22% of hospitalizations.Figure 2. Average annual hospitalizations by age and sex, South Dakota, 2000-2009 (infants 1 yr not included)Male971011059389858177736965Age in 1,5001,2501,0007505002500Males were hospitalized at a higher rate than females from birth through age 12 years, thereafterfemale hospitalization was higher in all age groups, especially during the peak childbearingperiod, 18-38 years, when the female hospitalization rates were double to nearly six-times themale hospitalization rates. The female hospitalizations were also highly increased over males inthe advanced elderly group, 90 years, likely due to the fewer males remaining in the population.Between ages 12 - 18 years there is a rapid increase in hospitalization due to three causes:mental health disorders in both sexes; complications of pregnancy, childbirth and puerperiumamong females; and injuries among males. The peak at age 27 years is due to child-bearing. Atage 65 years there is a 16.5% increase in hospitalization over the 64 year olds, supposedly due toMedicare accessibility. At age 79 years hospitalizations peaked at an average 1,841 per year.Subsequently, hospitalizations decrease for each age-year until age 107 years. The raresthospitalizations were among 8-year old girls children with 68 average hospitalizations per year.South Dakota Public Health Bulletin – April 2011 – Page 5
Table 2. Age and gender of hospitalizations, South Dakota, 2000-2009PercenPercenAge groupMaletFemaletInfants, 12 monthsPre-school, 1-4 yearsSchool-age, 5-14 yearsYouth, 15-24 yearsAdults, 25-39 yearsMid-age, 40-64 yearsElderly, 65 he overall leading cause of hospitalization was live birth, including cesarean and non-cesareandelivery, which included 10% of all hospitalizations (Table 3). The next leading causes ofhospitalizations were pneumonia and coronary atherosclerosis.Table 3. Top specific conditions of hospitalization, South Dakota, 2000-2009Name (ICD-9 code)NumberSingle liveborn, without mention of cesarean delivery (V30.00)79,192Pneumonia, organism unspecified (486)38,820Single liveborn, cesarean delivery (V30.01)26,474Coronary atherosclerosis of native coronary artery (414.01)21,628Congestive heart failure (428.0)20,062Osteoarthrosis, localized, not specified whether primary or secondary, lower leg (715.36)19,887Care involving rehabilitation procedures, other (V57.89)12,715Obstructive chronic bronchitis with (acute) exacerbation (491.21)11,352Previous cesarean delivery, delivered with or without mention of antepartum condition (654.21) he top 10 leading causes of hospitalizations stratified by age group and gender are shown inTable 4. Throughout the age groups females have an appreciably higher numbers ofgenitourinary system diseases than males. Males however have considerably higher numbers ofhospitalizations related to injury and poisoning than females. In the middle adult group, 40-64years of age, men had over double the hospitalizations due to diseases of the circulatory system,whereas women had over twice as many cancer hospitalizations than men.Table 4. Top conditions of hospitalization by age and gender, South Dakota, 2000-2009FemalePercentMaleInfants 1 year of age56,35Supplementary classification of factors (V01-V89)*53,31949%Diseases of the respiratory system (460-519)2,85340%4,285Certain conditions originating in perinatal period (760-779)1,82443%2,416Symptoms, signs and ill-defined conditions (780-799)64645%787Infectious and parasitic diseases (001-139)60345%726Congenital anomalies (740-759)36032%765Diseases of the digestive system (520-579)45042%630Endocrine, nutritional and metabolic, immunity (240-279)39946%477Injury and poisoning (800-999)14441%211Diseases of the genitourinary system (580-629)26676%86Pre-school children 1-4 years of ageFemaleDiseases of the respiratory system (460-519)3,874Endocrine, nutritional and metabolic, immunity (240-279)1,019Infectious and parasitic diseases (001-139)749Symptoms, signs and ill-defined conditions (780-799)684Injury and poisoning (800-999)481Diseases of the digestive system (520-579)450Diseases of the skin and subcutaneous tissue (680-709)260Congenital anomalies (740-759)206Diseases of nervous system & sense organs (320-389)213Diseases of the genitourinary system outh Dakota Public Health Bulletin – April 2011 – Page 77467445
School-age children 5-14 years of ageFemaleMental disorders (290-319)3,361Diseases of the respiratory system (460-519)1,458Injury and poisoning (800-999)974Diseases of the digestive system (520-579)901Endocrine, nutritional and metabolic, immunity (240-279)649Symptoms, signs and ill-defined conditions (780-799)477Infectious and parasitic diseases (001-139)394Diseases of the genitourinary system (580-629)464Diseases of nervous system & sense organs (320-389)269Diseases of the skin and subcutaneous tissue 0591,268992844682515460Youth 15-24 years of ageFemaleComplications of pregnancy, childbirth & puerperium (630-679) 42,589Mental disorders (290-319)8,498Injury and poisoning (800-999)2,716Diseases of the digestive system (520-579)2,166Diseases of the respiratory system (460-519)1,241Diseases of genitourinary system (580-629)1,664Endocrine, nutritional and metabolic, immunity (240-279)1,094Symptoms, signs and ill-defined conditions (780-799)1,000Infectious and parasitic diseases (001-139)611Supplementary classification of factors ,9902,3381,9801,8111,6451,1541,076Adults 25-39 years of ageFemaleComplications of pregnancy, childbirth & puerperium (630-679) 74,351Mental disorders (290-319)8,525Injury and poisoning (800-999)3,920Diseases of the digestive system (520-579)4,723Diseases of the genitourinary system (580-629)6,618Diseases of musculoskeletal system & connective tissue2,137Symptoms, signs and ill-defined conditions (780-799)2,314Endocrine, nutritional and metabolic, immunity (240-279)2,812Diseases of the respiratory system (460-519)2,082Diseases of the circulatory system 5699,5908,4127,5584,4194,1214,0313,6963,204Mid-age 40-64 years of ageFemaleDiseases of the circulatory system (390-459)13,561Diseases of the digestive system (520-579)13,774Diseases of musculoskeletal system & connective tissue 13,984Injury and poisoning (800-999)10,238Neoplasms (140-239)12,753Mental disorders (290-319)10,108Diseases of the respiratory system (460-519)10,218Diseases of the genitourinary system (580-629)13,853Symptoms, signs and ill-defined conditions (780-799)8,404Endocrine, nutritional and metabolic, immunity 510,000Elderly 65 years of ageFemalePercentMale PercentDiseases of the circulatory system (390-459)54,16151%53,0849%Diseases of the respiratory system (460-519)29,21151%28,2449%Diseases of musculoskeletal system & connective tissue 26,50563%15,3537%Diseases of the digestive system (520-579)24,26559%17,1741%Injury and poisoning (800-999)25,06264%14,1036%Symptoms, signs and ill-defined conditions (780-799)14,44859%9,84541%Neoplasms (140-239)12,67453%11,0747%Supplementary classification of factors (V01-V89)*13,48260%9,01640%Diseases of the genitourinary system (580-629)11,35055%9,24745%Endocrine, nutritional and metabolic, immunity (240-279)8,15863%4,77037%*Supplementary classifications of factors influencing health status and contact with health 23,75222,49820,59712,928South Dakota Public Health Bulletin – April 2011 – Page 7
Table 5. Hospital discharge disease groups by region, gender, race and age group, South Dakota 2000-2009RegionsDisease groupTotalNECirculatory system151,04738,956Musculoskeletalsystem & connective73,42015,519tissueInjury and poisoning82,97516,541Endocrine, nutritional,metabolic, &32,9637,219immunity disordersInfectious & igestive system84,18819,921Mental disorders65,19110,096Blood & blood6,6531,552forming organsGenitourinary system49,56211,398Nervous system &13,6352,761sense organsRespiratory system101,69925,405Congenital anomalies3,145570Pregnancy, childbirth119,28524,775& the puerperiumSkin and15,4643,266subcutaneous tissueCertain conditionsoriginating in the4,289894perinatal periodSymptoms, signs, &50,19511,536ill-defined conditionsFactors influencinghealth status & contact 142,14331,081with health servicesTOTAL*1,063,683 415,33154911,10052,021961 65 79811,964128,39619,375144,750239,157438,139 625,478864,6230 yr1-4 yrAge als may not add up to total due to missing or unknown gender or race values, or out-of-state region residence.South Dakota Public Health Bulletin – April 2011 – Page 822,364 83,873425,768
The overall rate of hospitalization for South Dakota residents was 0.11 hospitalizations perperson per year. Generally, the county’s number of hospitalizations (Table 6 and map below) isin direct relation to the size of the population, with Minnehaha and Pennington counties havingthe most hospitalizations. There is variation in hospitalization rates with Gregory and Buffalocounties having the highest rates (0.23 hospitalizations per person per year) and Perkins Countyhaving a nearly 10-times lower hospitalization rate. The counties with the highesthospitalization rates are in the central swath of the state. The counties with the lowesthospitalization rates (Perkins, Campbell, Corson and Union) are all counties without hospitalsand bordering other states. Some of the county numbers maybe lower than expected becausetheir local hospital did not submit discharge data to SDAHO for all 10 years, or an IHS facilitymay be the main hospital in their area.Table 6. Hospitalization numbers and rates* by county, South Dakota 2000-2009.Discharges 4660.05McCook7,318Charles rn3,443Edmunds5,5604,0710.14Shannon11,774Fall bach1,664Hutchinson12,5387,3430.17South Dakota916,715Hyde2,0961,4200.15*Rate: hospital discharges per person per year calculated using 2010 census counts.Public Health Bulletin – April 2011 – Page 0.050.140.120.06814,1800.11
Table 7. Average length of stay in days of patient hospital discharges, South Dakota, 2000-2009Disease - ConditionAll conditionsInfectious and parasitic diseasesSepticemiaNeoplasmsMalignant neoplasmsBenign neoplasmsEndocrine, nutritional and metabolic, immunityDiabetes mellitusVolume depletionDiseases of the blood and blood-forming organsAnemiasMental disordersPsychosesSchizophrenic disordersDiseases of the nervous system and sense organsDiseases of the circulatory systemEssential hypertensionHeart diseaseAcute myocardial infarctionCoronary atherosclerosisOther ischemic heart diseaseCardiac dysrhythmiasCongestive heart failureCerebrovascular diseaseDiseases of the respiratory systemAcute bronchitis and bronchiolitisPneumoniaChronic bronchitisAsthmaDiseases of the digestive systemAppendicitisIntestinal obstructionDiverticula of intestineCholelithiasisAcute pancreatitisDiseases of the genitourinary systemCalculus of kidney and ureterUrinary tract infectionComplications of pregnancy, childbirth & puerperiumDiseases of the skin and subcutaneous tissueCelulitis and abscessDiseases of the musculoskeletal system & connective tissueOsteoarthrosis and allied disordersIntervertebral disc disorderCongenital anomaliesCertain conditions originating in the perinatal periodSymptoms, signs and ill-defined conditionsInjury and poisoningFractures, all sitesFracture of neck of femurPoisoningsCertain complications of surgical and medical careFactors influencing health status & contact with health servicesFemales with deliveriesSD: standard deviation of length of stay in days.Public Health Bulletin – April 2011 – Page 10Mean (SD)4.4 (7.1)5.9 (7.5)8.9 (11.1)5.5 (7.5)6.2 (8.2)3.0 (2.9)3.8 (5.6)5.0 (28.2)3.1 (2.7)4.4 (5.1)4.2 (5.3)5.1 (9.6)5.6 (7.0)6.0 (5.7)6.2 (19.4)4.3 (6.0)3.7 (6.5)4.9 (6.3)4.7 (5.1)3.5 (4.4)4.9 (5.1)3.3 (3.5)4.9 (7.7)4.8 (7.3)5.0 (5.9)3.3 (2.8)4.7 (4.4)4.7 (4.1)3.4 (3.0)4.6 (6.2)3.8 (4.9)5.8 (5.9)5.2 (4.5)3.7 (3.6)6.1 (9.6)3.3 (4.2)2.0 (2.4)4.2 (4.5)2.5 (2.7)5.9 (8.5)4.9 (4.8)3.7 (3.9)3.6 (2.5)2.6 (2.9)5.1 (11.4)10.6 (19.5)3.1 (5.1)5.0 (6.5)4.8 (6.9)5.8 (4.0)2.2 (3.0)5.6 (6.9)5.0 (9.9)3.2 2,143105,666
Map 2: Hospitalization numbers and rates by county, South Dakota 2000-2009.The average length of stay for all conditions was 4.4 days (standard deviation 7.1 days). Thelongest average stay was 10.6 days for certain conditions originating in the perinatal period,followed by septicemia (8.9 days) and malignant neoplasms (6.2 days). The shortest averagestay was 3.2 days for calculus of kidney and ureter.On the following pages are summary pages for the 18 major diagnostic categories.Reference:National Hospital Discharge Survey: 2007 summary. MJ Hall, CJ DeFrances, SN Williams, AGolosinskiy, A Schwartzman. National health statistics reports; Number 29. Hyattsville, MD:National Center for Health Statistics. 2010. ents:Thanks to those who contributed to this summary report: Nato Tarkhashvili, Lon Kightlinger,Everett Putnam, South Dakota Department of Health (SD-DOH); Gilbert Johnson South DakotaAssociation of Healthcare Organizations (SDAHO). Particular thanks to those who made thediagnoses and the many people who assigned and entered the ICD-9 codes.Public Health Bulletin – April 2011 – Page 11
Diseases of the Circulatory System (ICD-9 390-459)Diseases of the circulatory system are the leading causes ofdeath nationwide and in South Dakota. During 2000–2009there were 151,047 hospitalizations due to diseases of thecirculatory system in South Dakota (average 15,105 peryear).Diseases of the Circulatory System, SD, 2000-200918,000 16,03116,53215,280 15,228 15,505 15,309 15,46315,05216,00013,294 13,35314,00012,00010,0008,0006,0004,0002,00002000 2001 2002 2003 2004 2005 2006 2007 2008 2009The northeast region had the highest rate of hospitalization(higher than the state rate of 1,541). Male were affectedmore than females (54% vs. 46%). Disease frequency wasincreased with advanced age (71% of hospitalizations inpopulation aged 65 years). Out-of-state residentsaccounted for 18% of all hospitalizations.Gender and RaceMaleFemaleWhiteAmerican IndianOther raceUnknown raceNumber mber 3,9608965,7221,97812,5162,790Rate 1%89.2%4.7%0.5%5.7%Coronary atherosclerosis of native coronaryartery was the most frequent cause ofhospitalization for diseases of the circulatorysystem, followed by congestive heart failure.414.01: Coronary atherosclerosis of nativecoronary artery, 21,628 (14%)2. 428.0: Congestive heart failure, 20,062 (13%)3. 427.31: Atrial fibrillation, 10,453 (7%)4. 410.71: Acute subendocardial infarction, initialepisode of care, 9,763 (6%)5. 434.91: Cerebral artery occlusion, unspecified,with cerebral infarction, 6,999 (5%)6. 433.10: Occlusion and stenosis of carotid arterywithout mention of cerebral infarction, 4,127(3%)7. 415.19: Pulmonary embolism and infarction,other, 3909 (3%)8. 435.9: Unspecified transient cerebral ischemia,3,762 (2%)9. 410.41: Acute myocardial infarction of otherinferior wall, initial episode of care, 3467 (2%)10. 427.89: Other specified cardiac dysrhythmias,other, 2,922 (2%)11. 410.11: Acute myocardial infarction of otheranterior wall, initial episode of care, 2,586 (2%)12. 410.91: Acute myocardial infarction, unspecifiedsite, initial episode of care, 2,449 (2%)13. 436: Acute, but ill-defined, cerebrovasculardisease, 2,422 (2%)14. 427.81: Sinoatrial node dysfunction, 2,278 (2%)15. 453.8: Other venous embolism and thrombosisof other specified veins, 2,151 (1%)16. 440.21: Atherosclerosis of the extremities withintermittent claudication, 1,907 (1%)17. 441.4: Abdominal aneurism without mention ofrupture, 1,808 (1%)18. 411.1: Other acute and subacute forms ofischemic heart disease, intermediate coronarysyndrome, 1,783 (1%)19. 414.00: Coronary atherosclerosis of unspecifiedtype of vessel, native or graft, 1,671 (1%)20. 431: Intracerebral hemorrhage, 1,537 (1%)All others 1%1.Diseases of the circulatory system by ageNumber of casesRegionNortheast residentsNorthwest residentsSoutheast residentsSouthwest residentsSouth Dakota totalOut-of-state residentsLeading diseases of the circulatorysystemICD-9 code: Name, Number ,0
Hospital Discharge Survey, South Dakota, 2000-2009 This report summarizes a decade of South Dakota hospital discharge data from 2000 through 2009. These inpatient data are presented as numbers, percentages and population-based rates for the overall state, four geographic sub-regions, gender, race groups and age groups.