Transcription
XV. Mathematics, Grade 10
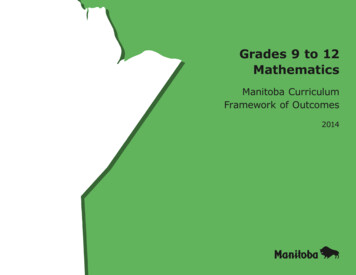
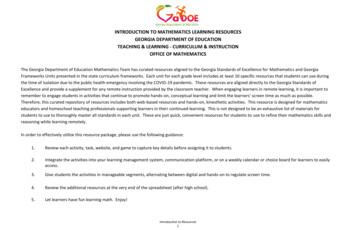
Grade 10 Mathematics TestThe spring 2018 grade 10 Mathematics test was based on standards in the 2011 Massachusetts Curriculum Framework forMathematics that match content in the grade 9–10 standards from the 2000 Massachusetts Mathematics Curriculum Framework.The standards in the 2011 Framework on the grade 10 test are organized under the five major conceptual categories listed below. Number and Quantity Algebra Functions Geometry Statistics and ProbabilityThe Massachusetts Curriculum Framework for Mathematics is available on the Department website atwww.doe.mass.edu/frameworks/archive.html. More information and a list of standards assessable on the spring 2018 test areavailable at www.doe.mass.edu/mcas/transition/?section math10.Mathematics test results for grade 10 are reported under four MCAS reporting categories, which are based on the five Frameworkconceptual categories listed above.The table at the conclusion of this chapter indicates each item’s reporting category, the 2011 Framework standard it assesses, and the2000 Framework standard it assesses. The correct answers for multiple-choice and short-answer items are also displayed in the table.Test SessionsThe grade 10 Mathematics test included two separate test sessions, which were administered on consecutive days. Each sessionincluded multiple-choice and open-response items. Session 1 also included short-answer items.Reference Materials and ToolsEach student taking the grade 10 Mathematics test was provided with a grade 10 Mathematics Reference Sheet. A copy of thereference sheet follows the final question in this chapter.During Session 2, each student had sole access to a calculator with at least four functions and a square root key. Calculator use wasnot allowed during Session 1.During both Mathematics test sessions, the use of bilingual word-to-word dictionaries was allowed for current and former Englishlearner students only. No other reference tools or materials were allowed.314
Grade 10 MathematicsSession 1You may use your reference sheet during this session.You may not use a calculator during this session.DIRECTIONSThis session contains fourteen multiple-choice questions, four short-answer questions, andthree open-response questions. Mark your answers to these questions in the spaces provided inyour Student Answer Booklet.1 2 3 Which of the following equations istrue?A. 7 (23)3(7 2)B. 7 (23)7(2 3)C. 7 (23)3 (27)D. 7 (23)7 (32)A container of soup is in the shape of aright circular cylinder. The container andits dimensions are shown below.8 cm10 cmWhich of the following is closest to thevalue of the expression below?3A.4B.5C.9120What is the volume, in cubiccentimeters, of the container?D. 11A. 200πB. 160π315C.80πD.40π
Mathematics 4 Session 17 Which of the following is equivalent tothe expression below?(p4 )( p22p8B. p 24p2C. p 28D. p 22A. pThe weights, in pounds, of 7 packagesare listed below.2)25, 10, 20, 4, 6, 3, 9The weight of an 8th package is addedto the list. The mean weight of the8 packages is 12 pounds.What is the weight, in pounds, of the8th package?A. 195 B. 16Which of the following values of x is asolution of the equation below?x2A.4B.16C. 11D. 102568 C. 128D. 512Point S is the midpoint of RT . Thecoordinates of point R and point T arelisted below. R (211, 212) 6 T (27, 24)A waiter received a 15% tip for arestaurant bill of 59.14. Which of thefollowing estimates is closest to the tipthe waiter received?What are the coordinates of point S ?A. (22, 24)B. (28, 210)A. 5.00C. (29, 28)B. 7.50D. (218, 216)C. 9.00D. 12.00316
Mathematics 9 Session 111 Which of the following is equivalent tothe expression below?x2A set of data is shown in the scatterplotbelow.y144A. ( x1)( x144)B. ( x1)( x144)C. ( x12)( x12)D. ( x12)( x12)54321–5 –4 –3 –2 –110 A rug in the shape of a square has anarea of 33 square feet. Which of thefollowing estimates is closest to thelength of each side of the rug?0–1–2–3–4–51 2 3 4 5xA. 5 14 feetWhich of the following equations bestrepresents the line of best fit for thedata in the scatterplot?B. 5 43 feetA. y12x2C. 6 43 feetB. y12x1D. 8 14 feetC. y12x2D. y12x1317
Mathematics 12 Session 114 A parallelogram and some of itsdimensions are shown below.15 in.Two groups are going on a trip to atheater. The first group has 30 studentsand 4 adult chaperones. The secondgroup has 25 students and 4 adultchaperones.The cost, in dollars, for each studentticket, s, and each adult ticket, a, canbe determined using the system ofequations below.h in.The area of the parallelogram is90 square inches. What is h, the heightin inches of the parallelogram?A.6B.830s 1 4a 5 72025s 1 4a 5 620What is the cost for each student ticket?A. 5C. 10B. 20D. 12C. 25D. 3013 Which of the following expressions isequivalent to 17?3A. 3 B.171 3 173C.3D.3 171733318
Mathematics Session 1Questions 15 and 16 are short-answer questions. Write your answers to these questions in the boxesprovided in your Student Answer Booklet. Do not write your answers in this test booklet. You may doyour figuring in the test booklet.15 What is the value of the expression below?22(32 2 10)16 The line plot below shows the number of red items of clothing owned by each student in a class.XXXXXXXXXXXX34567XX8910XX1112Number of Red Items of ClothingWhat is the median number of red items of clothing owned by the students in the class?319
Mathematics Session 1Question 17 is an open-response question. BE SURE TO ANSWER AND LABEL ALL PARTS OF THE QUESTION.Show all your work (diagrams, tables, or computations) in your Student Answer Booklet.If you do the work in your head, explain in writing how you did the work.Write your answer to question 17 in the space provided in your Student Answer Booklet.17 Stacey will paint the four walls of a room. Two walls each have a length of 20 feet, and the othertwo walls each have a length of 16 feet.The expression below represents the total perimeter, in feet, of the room.2(20 1 16)a. What is the total perimeter, in feet, of the room? Show or explain how you got your answer.The room has 2 windows and 3 doors. Each window is 4 feet high and 3 feet wide, and each dooris 7 feet high and 3 feet wide.The expression below represents the total area, in square feet, of the windows and doors in theroom.2(4 3) 1 3(7 3)b. What is the total area, in square feet, of the windows and doors in the room? Show or explainhow you got your answer.The height of each of the walls in the room is 8 feet. Stacey will not paint the windows or doors.The expression below represents the total area, in square feet, that Stacey will paint.2(20 8 1 16 8) 2 [2(4 3) 1 3(7 3)]c. What is the total area, in square feet, that Stacey will paint? Show or explain how you got youranswer.Each gallon of paint covers a total area of 300 square feet. Stacey will cover the walls with 2 layersof paint.The expression below represents the total number of gallons of paint Stacey will need to paint theroom with 2 layers of paint.2{2(20 816 8)[2(4 3)3003(7 3)]}Each gallon of paint costs 26. Stacey must purchase full gallons of paint.d. What is the total cost, in dollars, of the gallons of paint Stacey will need to purchase to paint theroom? Show or explain how you got your answer.320
Mathematics Session 1Questions 18 and 19 are short-answer questions. Write your answers to these questions in the boxesprovided in your Student Answer Booklet. Do not write your answers in this test booklet. You may doyour figuring in the test booklet.18 Rectangle ABCD is similar to rectangle EFGH. The rectangles and some of their dimensions areshown in the diagram below.AEBFx inches5 inchesDHC10 inches12 inchesBased on the dimensions in the diagram, what is the value of x ?19 The equation below has two solutions.n41One solution of the equation is3. What is the other solution of the equation?321G
Mathematics Session 1Questions 20 and 21 are open-response questions. BE SURE TO ANSWER AND LABEL ALL PARTS OF EACH QUESTION.Show all your work (diagrams, tables, or computations) in your Student Answer Booklet.If you do the work in your head, explain in writing how you did the work.Write your answer to question 20 in the space provided in your Student Answer Booklet.20 Lionel wrote an arithmetic sequence. The first five terms of the sequence are shown below.3, 10, 17, 24, 31, . . .a. What is the next term of Lionel’s sequence? Show or explain how you got your answer.b. Write an expression that can be used to find the nth term of Lionel’s sequence.Bella also wrote an arithmetic sequence. Each term of Bella’s sequence is equal to three timesthe corresponding term of Lionel’s sequence.c. Write an expression that can be used to find the mth term of Bella’s sequence.d. What is the 20th term of Bella’s sequence? Show or explain how you got your answer.322
Mathematics Session 1Write your answer to question 21 in the space provided in your Student Answer Booklet.A company packages fruit baskets of different weights and ships them to customers. Thecompany charges a flat fee for packaging the baskets. The total packaging and shipping cost indollars, y, of a fruit basket weighing x pounds is represented by the line on the graph below.yPackaging and Shipping Cost(in dollars)21 181614121086420Packaging and Shipping Costsfor Fruit Baskets(6, 16)(3, 10)1 2 3 4 5 6 7 8 9 10 11 12 13 14xWeight of Basket (in pounds)a. What is the y-intercept of the line on the graph?b. What does the y-intercept of the line represent in this situation?c. What is the slope of the line on the graph? Show or explain how you got your answer.d. What does the slope of the line represent in this situation?e. Write an equation that represents the line on the graph.f. Use the equation you wrote in part (e) to determine the weight, in pounds, of the heaviestfruit basket that could be packaged and shipped for 50. Show or explain how you got youranswer.323
Grade 10 MathematicsSession 2You may use your reference sheet during this session.You may use a calculator during this session.DIRECTIONSThis session contains eighteen multiple-choice questions and three open-response questions.Mark your answers to these questions in the spaces provided in your Student Answer Booklet.22 24 Rasha and Scott went to a bakery. Rashabought 4 plain bagels and 2 chocolatedonuts for a total of 8.70. Scott bought3 chocolate donuts for a total of 2.55.Quadrilateral RSTU is graphed on thecoordinate grid below.yWhat is the cost of one plain bagel atthe bakery?7654A. 0.85B. 1.45321C. 1.75D. 2.05–7 –6 –5 –4 –3 –2 –123 0–1–2–3R(3, 6)U(1, 2)S(5, 2)1 2 3 4 5 6 7xT(3, –2)–4The first term of an arithmetic sequenceis 5. The third term of the sequenceis 13.–5–6–7Which of the following expressionsrepresents the nth term of the sequence?A. 4n1B. 4n5C. 5n1Quadrilateral RSTU will be reflected overthe y-axis and translated 4 units down.What will be the coordinates of the imageof point S after the transformations?D. 5n5A. (25, 22)B. (1, 22)C. (21, 2)D. (25, 2)324
Mathematics 25 Session 226 The box-and-whisker plot below showsthe distribution of the numbers ofcalories per serving for a selection ofbreakfast cereals.The diagram below shows a cup in theshape of a right circular cone and someof its measurements.5 cmBreakfast Cereal Calories per Serving10 cm50 65 80 95 110 125 140 155 170 185 200Based on the box-and-whisker plot, whatis the median number of calories perserving for the breakfast cereals?A. 110Which of the following is closest tothe volume, in cubic centimeters, ofthe cup?B. 120C. 125D. 135A.83B. 105C. 262D. 524325
Mathematics 27 Session 229 The volume of a right circular cylinderis 1696 cubic centimeters. The height ofthe cylinder is 15 centimeters. Which ofthe following is closest to the radius ofthe right circular cylinder?A.2 centimetersB.6 centimetersA physician recorded the resting heartrates of some of her patients. She alsorecorded the average number of hourseach of those patients exercises daily.She will make a graphical display of thedata to help determine whether the twovariables are associated.C. 18 centimetersWhich of the following displays shouldthe physician make?D. 36 centimetersA. bar graphB. scatterplotC. circle graph28 D. box-and-whisker plotMelissa owns a catering company. Forlunch and dinner parties, she servesappetizers before each meal. The numberof appetizers Melissa serves is directlyproportional to the number of guests atthe party.30 For lunch parties, she serves3 appetizers per guest.For all non-zero values of x, whichof the following expressions has avalue of 1?( )A. 4 24xx For dinner parties, she serves5 appetizers per guest.( )B. 4 1x4xWhen serving 22 guests, what is thedifference of the number of appetizersshe serves for dinner and the number ofappetizers she serves for lunch?A. 10B. 35C. 44D. 64326( )C.4 2xx4D.4 xx4()
Mathematics 31 Session 233 An animal population doubles everymonth. The population begins with20 animals.Which of the following expressionsshows the animal population after3 months?In a community college class, theinterquartile range of student ages is20 years, and the median student ageis 30 years. Which of the followingbox-and-whisker plots could representthe distribution of the ages of thestudents in the class?A. 20 23B. 20 32A.Student Ages3C. 20 2D. 20 2 315 20 25 30 35 40 4532 B.The distance from the base of a flagpoleto a point on the ground is 24 feet.The flagpole has a height of 18 feet, asshown in the diagram below.Student Ages15 20 25 30 35 40 45Flagpole18 feetC.xStudent AgesGround15 20 25 30 35 40 4524 feetWhat is x, the distance from the top ofthe flagpole to the point on the ground?D.Student AgesA. 16 feetB. 21 feet15 20 25 30 35 40 45C. 30 feetD. 42 feet327
Mathematics 34 Session 235 A right square pyramid and itsdimensions are shown below.The percentage of Deatrice’s incomethat she budgets each month fordifferent expenses is shown in thecircle graph below.Deatrice’s Monthly 2.5 mWhich of the following is closest to thevolume of the right square pyramid?Deatrice budgets 900 for food eachmonth. Based on the circle graph, whatis the total amount she budgets forhousing each month?m3A.3B.7 m3C.8 m3Housing45%A. 945D. 13 m3B. 1050C. 1200D. 1350328
Mathematics Session 2Question 36 is an open-response question. BE SURE TO ANSWER AND LABEL ALL PARTS OF THE QUESTION.Show all your work (diagrams, tables, or computations) in your Student Answer Booklet.If you do the work in your head, explain in writing how you did the work.Write your answer to question 36 in the space provided in your Student Answer Booklet.36 Kite PQRS has diagonals that intersect at point T. The kite and some of its angle measures areshown in the diagram below.SP60 30 TRQThe length of RS is 20 centimeters.a. What is the length, in centimeters, of PS ? Show or explain how you got your answer.b. What is the length, to the nearest tenth of a centimeter, of ST ? Show or explain how yougot your answer.c. What is the length, to the nearest tenth of a centimeter, of TQ ? Show or explain how yougot your answer.d. What is the perimeter, to the nearest tenth of a centimeter, of kite PQRS ? Show or explainhow you got your answer.329
Mathematics Session 2Mark your answers to multiple-choice questions 37 through 40 in the spaces provided in your StudentAnswer Booklet. Do not write your answers in this test booklet. You may do your figuring in the testbooklet.37 39 If q 0, which of the following is theadditive inverse of the expression below?2 q2Parallel lines k and m are intersected bylines p and q. The diagram below showsthe lines and the measures of some ofthe angles formed by the intersections ofthe lines.A. 22qB. 2kq2mp40 RC. 2qx 80 D. 2q38 Howard runs every day for 1 hour.q For the first half-hour, he runs at arate of 10 minutes per mile.Lines k, p, and q intersect at point R. For the second half-hour, he runsat a rate of 7.5 minutes per mile.Based on the diagram, what is thevalue of x?Which of the following is the totaldistance, in miles, that Howard runsevery day?A.6B.7C.8A. 40B. 50C. 60D. 80D. 14330
Mathematics The scatterplot below shows the weekly incomes, in dollars, for 15 individuals and the numberof years of higher education each individual completed.yWeekly IncomesIncome180014001000600200013579xYearsWhich of the following graphs best represents the line of best fit for the data shown in thescatterplot?A.C.Weekly Incomesy1800180014001400IncomeIncomey1000600Weekly Incomes1000600200200013579x013B.yD.Weekly arsYearsIncome40 Session 279Weekly Incomes1000600200x0Years135Years33179x
Mathematics Session 2Questions 41 and 42 are open-response questions. BE SURE TO ANSWER AND LABEL ALL PARTS OF EACH QUESTION.Show all your work (diagrams, tables, or computations) in your Student Answer Booklet.If you do the work in your head, explain in writing how you did the work.Write your answer to question 41 in the space provided in your Student Answer Booklet.The histogram below shows the heights, in inches, of the students in Landon’s class.Heights of StudentsNumber of Students41 7654321061–62 63–64 65–66 67–68 69–70 71–72Height (in inches)a. How many of the students in Landon’s class are at least 65 inches tall? Show or explainhow you got your answer.b. What fraction of the students in Landon’s class are between 65 and 68 inches tall? Showor explain how you got your answer.c. What could be the median height of the students in Landon’s class? Show or explain howyou got your answer.Landon’s teacher will add her height to the data. She is 65 inches tall.d. Will the new median height be less than, equal to, or greater than the median height youfound in part (c)? Explain your reasoning.332
Mathematics Session 2Write your answer to question 42 in the space provided in your Student Answer Booklet.42 A small cube and a large cube with edge lengths represented by expressions are shown in thediagram below.x inches3x inchesThe small cube has a volume of 64 cubic inches.a. What is the value of x? Show or explain how you got your answer.b. What is the surface area, in square inches, of the small cube? Show or explain how you gotyour answer.c. The surface area of the large cube is how many times the surface area of the small cube?Show or explain how you got your answer.d. The volume of the large cube is how many times the volume of the small cube? Show orexplain how you got your answer.333
Massachusetts Comprehensive Assessment SystemGrade 10 Mathematics Reference SheetAREA FORMULASVOLUME FORMULASsquare . A s2cube .V s3(s length of an edge)rectangle . A bhright rectangular prism .V lwhORparallelogram . A bhV Bh(B area of a base)triangle . A 1 bh24trapezoid . A 1 h(b1 b2)sphere .V 3 πr3circle . A πr2right circular cylinder .V πr2hLATERAL SURFACE AREA FORMULASright circular cone .V 3 πr2hright rectangular prism . LA 2(hw) 2(lh)right square pyramid .V 3 s2h211right circular cylinder . LA 2πrhright circular cone . LA πr ( slant height)CIRCLE FORMULASright square pyramid . LA 2s ( slant height)C 2πrA πr2SPECIAL RIGHT TRIANGLESTOTAL SURFACE AREA FORMULAScube . SA 6s2right rectangular prism . SA 2(lw) 2(hw) 2(lh)x45 x 2sphere . SA 4πr2right circular cylinder . SA 2πr2 2πrhxright circular cone . SA πr2 πr ( slant height)45 60 2yys2 2s right square pyramid . SA ( slant height)30 y3343
Grade 10 MathematicsSpring 2018 Released Items:Reporting Categories, Standards, and Correct Answers123Item No.Page No.1315Reporting Category1Standard1Number and Quantity7.EE.2.038.NS.1.02Correct Answer2(MC/SA)D2000Standard310.N.12315Number and gebra and FunctionsA10.P.35316Algebra and FunctionsA.APR.1.01A.REI.2.04B10.P.56316Number and Quantity7.EE.2.03C10.N.47316Statistics and 10.G.79317Algebra and ber and Quantity11317Statistics and .N.1B10.P.813318Number and Quantity7.G.2.06N.RN.1.0214318Algebra and FunctionsA.REI.3.0615319Number and Quantity7.EE.2.03210.N.216319Statistics and umber and Quantity18321GeometryG.SRT.1.026 inches–519321Algebra and FunctionsA.REI.2.0320322Algebra and FunctionsF.LE.1.0221323Algebra and FunctionsF.IF.2.0422324Algebra and 23324Algebra and .G.925325Statistics and C10.M.227326GeometryG.GMD.1.03B10.M.228326Algebra and FunctionsA.CED.1.01C10.P.729326Statistics and ProbabilityS.ID.2.06B10.D.130326Number and Quantity7.NS.1.03D10.N.131327Algebra and Functions32327Geometry33327Statistics and Probability34328Geometry35328Statistics and .SRT.3.06D10.D.110.G.637330Number and Quantity7.NS.1.03D10.N.138330Algebra and .G.340331Statistics and ProbabilityS.ID.2.06A10.D.241332Statistics and M.3The Reporting Category and Standard columns refer to the 2011 Massachusetts Curriculum Framework for Mathematics.Answers are provided here for multiple-choice and short-answer items only. Sample responses and scoring guidelines for open-response items, which are indicatedby the shaded cells, will be posted to the Department’s website later this year.The Department is providing the standard from the 2000 curriculum framework for Mathematics for reference purposes.335
314 Grade 10 Mathematics Test The spring 2018 grade 10 Mathematics test was based on standards in the 2011 Massachusetts Curriculum Framework for Mathematics that match content in the grade 9-10 standards from the 2000 Massachusetts Mathematics Curriculum Framework. The standards in the 2011 Framework on the grade 10 test are organized under the five major conceptual categories listed below.