Transcription
RN003 – April 2013Post-censal household estimates forsmall areasAlex FentonBackgroundThis is one of a series of short papers which explain conceptual or methodological approachesunderpinning analysis undertaken in CASE’s research programme Social Policy in a Cold Climate(SPCC). SPCC is designed to examine the effects of the major economic and political changes inthe UK since 2007, particularly their impact on the distribution of wealth, poverty, inequality andsocial mobility. It also examines geographical variations in policy, spending, outputs andoutcomes, with a particular focus on London. The analysis includes policies and spendingdecisions from the last period of the Labour government (2007-2010), including the beginning ofthe financial crisis, as well as those made by the Coalition government since May 2010. Theprogramme will conclude in 2015, with publication of a final volume. Interim reports will bepublished in 2013/14, and made available online at http://sticerd.lse.ac.uk/case.Social Policy in a Cold Climate is funded by the Joseph Rowntree Foundation and the NuffieldFoundation, with London-specific analysis funded by the Trust for London. The views expressedare those of the authors and not necessarily those of the funders.IntroductionThe Censuses of Population in the constituent countries of the UK provide counts of households atsmall area level and above every 10 years. All four countries in the UK also produce annualhousehold projections and estimates, although by different methods (National Records of Scotland2011). However, none produces such estimates for geographic units smaller than council or localauthority areas. This note discusses methods for producing annual household estimates for“neighbourhood”-scale areas (LSOAs/Datazones) in England, Wales and Scotland that areconsistent with the official local-authority level household estimates.
A Framework for Analysing the Effects of Social Policy RN003Our requirement for estimates of household numbers in small areas in years where Census dataare not available arises from work on estimating poverty rates for small areas in order tounderstand the changing spatial distribution of poverty in UK cities. A family of measures has beendeveloped, called UMBR: the unadjusted means-tested benefits rate (Fenton 2013). UMBR isintended to be a small-area proxy for income poverty as it is conventionally understood andmeasured by national surveys. In principle, poverty is commonly understood as a situation thataffects families or households rather than individuals, and so the household or family is a commonunit for the measurement of poverty rates. Practically, many poverty proxies, such as means-testedbenefits, only identify one member of a household or family.It is acknowledged that the household is not a perfect denominator, since its numerator (meanstested benefit claimants) includes some people who are not in households. Residents in nursinghomes and other such institutions, for example, may claim some welfare benefits. However, it ispreferred to the alternatives due to its consistency with national standards and for empiricalreasons. UMBR denominated by counts of adults produced greater error and bias when comparedto econometrically modelled neighbourhood poverty rates than UMBR denominated by dwellings,taken to be a proxy for household numbers. This is partly because there are systematic variationsbetween places in the average number of adults in each household or benefit unit. The publicsmall-area data on benefit claimants does not enable the adult partners of benefit claimants to beidentified.However, counts of dwellings (taken from Council Tax Band records) are not a perfect proxy forhouseholds. They create bias because there are variations in the relationship between dwellingcounts and household counts. In particular, a dwelling count denominator will tend to understatepoverty rates where there are many vacant dwellings in a neighbourhood. This is of concern forareas of high poverty and low housing demand (for example, parts of Teesside, and smaller exmining or ex-manufacturing towns), and for some coastal areas where many dwellings are secondhomes. Comparisons of the 2001 Council Tax Band statistics and the 2001 Census results showedthat there were also some significant discrepancies between the Census's count of 'householdspaces' and the Council Tax records of 'dwellings'. This is partly due to small differences indefinitions, but the largest discrepancies are due to known failures in the enumeration of a smallnumber of districts in the 2001 Census.Therefore, methods for estimating the numbers of households in each neighbourhood, on anannual basis between Censuses, were investigated. This work was conducted in 2012, prior to therelease of 2011 Census household counts. At the end of the note, we compare our 2011 estimatesby our preferred method, with the 2011 Census counts, which have subsequently been released.2
A Framework for Analysing the Effects of Social Policy RN003Overview of estimation methodsAll four countries in the UK produce inter-censal estimates or projections of the number ofhouseholds, although using different methods, and to the level of local authorities only. ONS (forEngland and Wales) and GROS (for Scotland) also produce mid-year estimates of the totalpopulation in small areas, by age band and sex, although, again, by different methods. Someofficial publications discuss methods for estimating LSOA household populations; the EnvironmentAgency, for example, recommends dividing household population by estimated average householdsize (The Environment Agency 2012, chap.9). However, there are no published estimates ofhouseholds or household population for small areas.Two methods were investigated. The dwelling-change method starts from the number ofhouseholds counted in the 2001 Census, and rolls these forward, making adjustments usingadministrative data on changes in the dwelling stock in each small area. The demographicheadship method starts with the small-area population estimates, and uses the proportion of eachage-sex band believed to be a household head to derive a total number of households. In bothcases, the results are constrained so that they sum to the official household projections for highergeographic units, such as local authorities and regions.For completeness, both methods that were investigated are described below. The demographicheadship model is the one that was eventually used to produce the household counts providedwith the UMBR dataset. It was preferred for several reasons: it produces fewer erroneous results; itis consistent with techniques used in official national and sub-national household projections; and,by using ONS/GROS small-area population estimates, it draws indirectly on a wider range ofadministrative data.Dwelling-change methodThis method is what is referred to as an ‘additive-change’ method; it consists of:1. Starting with the Census counts of occupied and total household spaces.2. Adjusting these to compensate for under-enumeration in the 2001 Census so that the totalhouseholds for each district is consistent with the household estimates3. Rolling these numbers forwards for 2002 to 2011, using year-on-year changes in CouncilTax Band statistics to approximate the effects of construction and demolition, and thenconstraining each year's figures to the official LA-level household projection.3
A Framework for Analysing the Effects of Social Policy RN003Base statisticsThe Census is considered to provide counts of households and dwelling spaces that are consistentwith the purpose at hand. Counts of total, vacant and occupied household spaces for LSOAs comefrom Census Table KS16. The base count of households is the total number of occupiedhousehold spaces. A 'household space' in the 2001 Census is not completely equivalent to a'dwelling'; a dwelling may contain multiple household spaces which share kitchens or bathrooms(bedsits, for example). However, the number of shared household spaces is relatively small (c80,000 in England and Wales, relative to a total of 25m), so this distinction is not maintained;household spaces are referred to as 'dwellings’ here onwards.The 2001 Census failed to enumerate some local authorities accurately, producing seriousundercounts of households and dwellings in Westminster and Manchester, and some undercounting in other urban areas, particularly in London (Office for National Statistics 2004). This isdealt with by adjusting the count of households and dwellings upwards for all local authorities sothat the household total for each LA is consistent with the 2001 household estimates, which arebased on the mid-year population estimates corrected for the Census under-enumeration.The adjustment is applied across all LSOAs in an LA. In districts where the sum total ofhouseholds in LSOAs according to the Census is less than the relevant household estimate for2001, an upward adjustment is applied to LSOAs where the count of all household spaces is lessthan the Council Tax (CT) records of number of dwellings. The “missing” households aredistributed to each LSOA based on its share of all such missing dwellings within that LA. Nohouseholds are added to LSOAs where the number of household spaces in the Census tables isthe same as or greater than in the CT records. The occupancy rate (the number of householdsdivided by the number of dwellings) is held constant. In districts where the sum total of householdsin LSOAs in the Census is greater than the household estimate for 2001, the number ofhouseholds in each LSOA is reduced proportional to the share of all households in that LA thatwere living in that LSOA.In most cases, the adjustment is nil or very small. Downward adjustments are no greater than 1%.There are some large upwards adjustments, especially in Westminster and Manchester. 191LSOAs (about 0.5% of all LSOAs in England and Wales) have their household populationsincreased by more than 10%. This is consistent with the report on Census under-enumerationwhich found specific neighbourhoods to have been poorly enumerated (for example, those whichhad undergone development).Neighbourhood-level change 2001 – 2011The CT Band dwelling statistics are not consistent with the Census-defined household spaces.However, it is assumed that changes in CT Band dwelling counts approximate changes in4
A Framework for Analysing the Effects of Social Policy RN003household spaces as counted by the Census. For each LSOA, for each year, the CT Band dwellingcount is compared to the previous year to get three measures:1. Gross additions: the sum of all positive changes within each band2. Gross subtractions: the sum of all negative changes within each band3. Net Change: the net change in total number of dwellings ( additions - subtractions)As a simplified example (there are in fact eight Council Tax Bands, or nine in Wales), consider thefigures for an LSOA in 2001 and 2002:Band ABand BBand CBand DBand -100 20 50 15The gross additions are 25 ( 20 5), the gross subtractions are -10, and the net change is 15.Changes happen for a variety of reasons: appeals against banding; the demolition andconstruction of dwellings; conversions to and from non-residential use; conversions of multipledwellings to single dwellings and vice-versa. Data published by the VOA in 2011 suggest that themajority of changes reflect real changes in dwellings, rather than administrative re-bandings.Rolling forward, applying changes, and constrainingStarting with the adjusted Census count of households and dwellings, these changes are appliedeach year, as follows:1. The household count is increased by 1 for every gross addition to the dwelling stock2. The household count is decreased by (1 * the occupancy rate) for every gross subtractionto the dwelling stock. In other words, an area's vacant dwelling rate is maintained – it isassumed that some demolished buildings are unoccupied.3. The dwelling count is increased or decreased by the net change.This gives a new provisional household and dwelling count for each LSOA. The household countfor each LSOA is then constrained so that the total for LSOAs in each LA is consistent with thatyear's official household estimate. The adjustment is made proportional to the number of vacantdwellings in each LSOA. This means that when the LA-level household estimates are higher thanthe unconstrained total (i.e. there are more additional households than neighbourhood-levelchanges in dwellings suggested), neighbourhoods with more vacants tend to fill-up faster thanthose with few, and no neighbourhood can ever have more households than dwellings. When the5
A Framework for Analysing the Effects of Social Policy RN003opposite is true, areas with higher vacancy rates will empty-out faster. Either way, the broadrelative pattern of dwelling vacancy is maintained. Demolition and rebuilding will tend to reduce thevacancy rate of a neighbourhood relative to its local area, as possibly unoccupied dwellings arereplaced by new dwellings that are assumed to be occupied.Demographic-headship methodHeadship rates (or household-representative rates) are used as the first stage in the English andScottish official household projections (see, for example, DCLG 2010, p.5ff). Censuses andsurveys identify one person within a household as the ‘household head’ or ‘household referenceperson’ (HRP). The term and its definition have varied over time. So long as a consistent definitionis used within a single projection, the precise rules for identifying who in a household is ‘head’ or‘HRP’ does not matter greatly, since the identity of interest is the one-to-one correspondencebetween the number of households and the number of HRPs. There are systematic differences byage, sex and marital status in the propensity of individuals to be HRPs: for example, older men aremost likely to be HRP of their households. From this comes the idea of a headship-rate, or HRPrate: the proportion of an age-sex group who are HRPs.In overview, the method thus involves:1. Starting with the mid-year population estimates for small areas produced by ONS andGROS2. Deducting from each broad age-sex group the number of people thought to be living incommunal establishments, and thus not part of the household population.3. Multiplying the number of people in each age-sex group by the proportion of that groupthought to be the reference person for their household (HRPs). The proportion of eachband that are HRPs is derived from small-area Census data, and from the Labour ForceSurvey.4. Summing for each small-area the numbers of households in each age-sex band.It is considered an estimation, rather than a projection method, since it primarily uses availableempirical data rather than projecting trends from past data.Base StatisticsTwo census tables are used to provide details on each small area. CAS001 provides counts ofpeople by age and sex and whether in a household or communal establishment. CAS003 providescounts of HRPs by age and sex. From these tables two sets of statistics are extracted:1. The local (LSOA/Datazone) HRP-rate, by age and sex band; this is the number of HRPs inage/sex band, divided by the number of people in households in that age/sex band.6
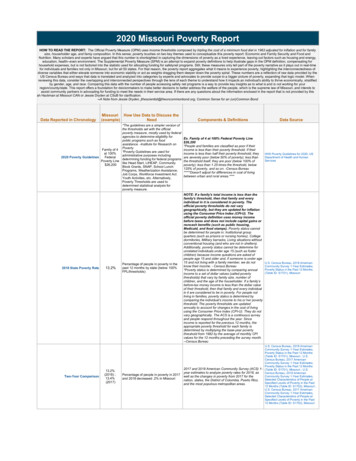
A Framework for Analysing the Effects of Social Policy RN0032. The local count of people in communal establishments, by age/sex bandThe small-area population estimates from ONS and GROS are collated into a single file coveringall the years of interest (2001 to 2010) and with consistent broad age bands (0 to 15, 16 to 29, 30to 44, 45 to 59/64, 60/65 and over). The small-area population estimates are already calibrated tolocal-authority-level mid-year population estimates. Correspondence with the Population Estimatesteam at ONS confirmed that this corrects for under-enumeration in the 2001 Census, and specificcorrections were applied to small areas (specific neighbourhoods in Manchester, for example) thatwere believed to have been poorly enumerated.Headship RatesSince the household estimation period runs from 2001 to 2011, we have to consider differences inheadship rates over both space and time. It is expected that there is variation over space in HRPrates for a given age/sex band. This is partly because the housing in different places is likely tocater to different types of household, with different heads, and partly because there are differencesbetween places in the typical marital status of adults in a given age group. Marital status is directlyincluded in the national projections, but is implicit in the LSOA model.The Labour Force Survey (Office for National Statistics, Social Survey Division 2010) shows thatover the 2000s there were also considerable changes in the headship rates for age/sex bands, anddifferences between regions. Broadly, they show falling headship rates for younger and middleaged men, and rising headship rates for women. These reflect various processes, such as theworsening affordability of open-market housing and increasing numbers of divorced, widowed ornever-married women. The following chart illustrates the trends for different groups in different UKregions, as observed in the LFS.7
A Framework for Analysing the Effects of Social Policy RN003Figure 1 : Household headship rates by region, sex and broad age group, 2001-2010(Labour Force Survey). Male headship rates are shown by dotted lines, female bycontinuous lines.The further the estimation date is from the Census date, the less confident one can be that thelocal variation persists, both because areas change characteristics (albeit, usually rather slowly)and because of the broad changes. Therefore two initial sets of household counts are made foreach LSOA/DZ for each year, one applying local age/sex HRP-rate from the Census to that year’spopulation estimate, and one applying the regional three-year moving-average HRP-rate for thatage/sex group. The final household estimate for each area is a weighted average of the two. Thecloser the estimation date is to the year of the Census, the greater the weight given to the Censusbased estimate. In 2001, the weight is 0.9/0.1 in favour of the Census; in 2010, the weight is0.4/0.6 in favour of the LFS rates. The difference between the two estimates is greatest in citycentre LSOAs which have unusually high rates of headship for young adults in 2001.8
A Framework for Analysing the Effects of Social Policy RN003These averages are then constrained to the official household projections for their local authorityfor that year, by simply keeping a constant share of the local authority’s households in eachLSOA/DZ and scaling up or down as necessary. The scaling is small in most districts in 2001(maximum /- 3%); by 2010 the greatest scaling is /- 10%. Since there are no small-areapopulation estimates for 2011, 2011 household estimates were derived by constraining 2010 LSOAshares to the 2011 official household projections.Demographic Headship Model PreferredA full comparison of the results produced by the two methods is beyond the scope of this note, andof limited value. The dwelling-change method produced a number of erratic results, including nilcounts and some counts substantially below the minima suggested by other administrative records.The demographic-headship method benefits from ONS and GROS’s methodological work andmultiple sources that go into the small-area population estimates. Its technique is consistent withthat taken in official household estimates for higher geographic levels. It also produces fewererratic results. For these reasons, this is our preferred method of estimation for the UMBR dataset.2011 and beyondSince the work on which this note is based was completed, small area household estimates havebeen made available from the 2011 Census. Comparing the demographic headship modelestimates with the Census estimates gives an indication of their accuracy, although the Censusitself is of course prone to under-enumeration.The table overleaf shows the difference between the household estimates for LSOAs in eighteenmajor English and Welsh cities (including their hinterlands) 1 and the Census counts. For thiscomparison, we exclude 519 LSOAs (2.5%) across the eighteen cities considered, because theydid not exist on the same boundaries in both 2001 and 2011. These LSOAs are likely to havebeen ones which experienced the greatest population change.1These cities are included because they are the subject of an analysis in which we are using thehousehold estimates as a basis for estimating changes in the spatial distribution of poverty at the small arealevel within British cities. The LSOAs within them make up about two-thirds of LSOAs in England and Wales.For definition of the cities, see research note RN004 in this series. For details of the small area povertymeasure (UMBR) see SPCC Working Paper 01: Small Area Measures of Income Poverty (Fenton 2013)9
A Framework for Analysing the Effects of Social Policy RN003Differences between Modelled Household Estimatesfor 2011 and Census st 8230376508409335290934134219964The table shows that the median difference between the counts is typically slightly higher than theCensus estimate, between 0% and 3%. In four cities, Hull, Derby, Bristol and Plymouth, themedian difference is higher, 4-5%. Overall half of the differences lay between five per cent lowerthan the Census estimate and seven percent higher. When we use the Census estimates tocalculate our small area poverty rate (UMBR), rather than the modelled estimates, the difference istypically not more than one percentage point in either direction. The correspondence between theestimates and the Census is sufficiently close, in our view, not to re-base our calculations ofpoverty rates for the years between 2001 and 2011 on a retrospective, Census-based, householdestimate. However, the table also shows that there are outlying LSOAs for which there was asubstantial difference between the modelled estimates and the Census. One LSOA had, accordingto the modelled estimates, 138% fewer households than counted at the Census, andanother 66% more. These cases could be due to inadequate correction for under-enumeration ateither Census, or to dramatic population changes (due to demolition or new home building, whichcould also change headship rates) that were not picked up in inter-censal small area populationestimates. When conducting specific city analyses, care needs to be taken over the interpretationof change in these outlying areas.10
A Framework for Analysing the Effects of Social Policy RN003Households or a similar denominator for UMBR will need to be produced from 2011 to 2014 for theSocial Policy in a Cold Climate research programme. It will be possible to apply the headshipmethod described to base data from the 2011 Census; the relevant tables will be available. Apotential development would be to estimate the numbers of ‘families’ rather than households, since‘families’ as defined in the LFS and Census are closer to the definition of benefit-units.The sources will benefit in several ways from the results of the 2011 Census. Official householdprojections for higher areas are to be updated to a 2011 base. Also, for the first time, small-areacounts of population and households will be produced to the same geographic units as in aprevious Census. This will permit new evaluations of methods for producing inter-censal estimates;ONS has underway a project for this which will report in 2013, and which will set out the basis forsmall-area population estimates from 2011 onwards.ReferencesDCLG (2010). Updating the Department for Communities and Local Government’s householdprojections to a 2008 base: Methodology, London: Department for Communities and LocalGovernment. Available ics/pdf/1780350Fenton, A (2013) Small Area Measures of Income Poverty. SPCC Working Paper 001. London:Centre for Analysis of Social ExclusionNational Records of Scotland (2011) Household projections across the United Kingdom: TechnicalReport, Cardiff: Statistics Directorate, Welsh Government. Available hsetechreporten.pdfOffice for National Statistics (2004) 2001 Census: Manchester and Westminster Matching StudiesFull Report, London: Office for National Statistics. Available rt.pdf [Accessed September 28, 2012].Office for National Statistics, Social Survey Division (2010). Quarterly Labour Force SurveyHousehold Dataset, April-June 2010 2nd ed., Colchester, Essex: UK Data Archive.Available at: http://dx.doi.org/10.5255/UKDA-SN-6575-1The Environment Agency (2012). Methods of Estimating Population and Household Projections:Update 2012, Bristol: The Environment Agency. Available DF/GEHO0612BWSA-E-E.pdf11
(SPCC). SPCC is designed to examine the effects of the major economic and political changes in the UK since 2007, particularly their impact on the distribution of wealth, poverty, inequality and . Residents in nursing homes and other such institutions, for example, may claim some welfare benefits. However, it is preferred to the alternatives .