Transcription
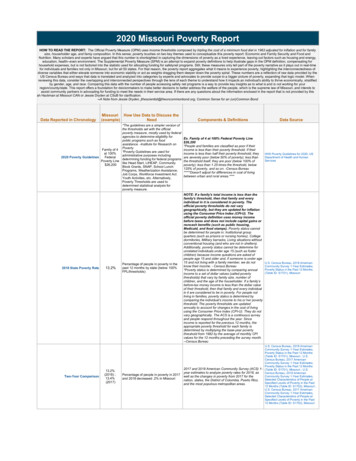
2020 Missouri Poverty ReportHOW TO READ THE REPORT: The Official Poverty Measure (OPM) uses income thresholds composed by tripling the cost of a minimum food diet in 1963 adjusted for inflation and for familysize, householder age, and famiy composition. In this sense, poverty touches on two key themes used to conceptualize this poverty report: Economic and Family Security and Food andNutrition. Many scholars and experts have argued that this number is shortsighted in capturing the dimensions of poverty as a lived experience, leaving out factors such as housing and energy,education, health--even environment. The Supplemental Poverty Measure (SPM) is an attempt to expand poverty definitions to help illustrate gaps in the OPM definition, compensating forhousehold expenses, but is not factored into the statistic used for allocating funding for safetynet programs. Still, these measures only tell part of the poverty narrative as it plays out in real-timefor individuals and families not only in Missouri, but for all 50 states. For that reason, the poverty report aggregates what it means to experience poverty, highlighting the interconnectedness ofdiverse variables that either elevate someone into economic stability or act as weights dragging them deeper down the poverty spiral. These numbers are a reflection of raw data provided by theUS Census Bureau and ways that data is translated and analyzed into categories by experts and advocates to provide scope to a bigger picture of poverty, expanding that logic model. Whenreviewing this data, consider the overlapping and interconnected perspectives through the lens of each theme to understand how it impacts an individual's ability to thrive economically, stratifiedby gender, age, and race. Comparing this data with the number of people accessing safety net programs is a way to provide key insights as to what is and is not working for yourregion/county/state. This report offers a foundation for deicionmakers to make better decisons to better address the welfare of the people, which is the supreme law of Missouri, and intends toassist community partners in advocating for funding to meet the needs in their service area. If there are any questions about the information enclosed in the report that is not provided by thisreport, please contact Sarah Hackman at Missouri CAN or Jessie Dryden at CSuB for clarification.--A Note from Jessie Dryden, jthescientist@theuncommonbond.org, Common Sense for an (un)Common BondData Reported in ChronologyMissouri How Use Data to Discuss the(example)Need*The guidelines are a simpler version ofthe thresholds set with the officialpoverty measure, mostly used by federalagencies to determine eligibility forpublic programs such as foodassistance. -Institute for Research onPovertyFamily of 4*Poverty Guidelines are used forat 100%administrative purposes includingFederal2020 Poverty Guidelinesdetermining funding for federal programsPoverty Linelike Head Start, LIHEAP, Community 26,200Block Grants, SNAP, School LunchPrograms, Weatherization Assistance,Job Corps, Workforce Investment ActYouth Activities, etc. Alternatively,Poverty Thresholds are used todetermined statistical analysis forpoverty measure.2018 State Poverty RateTwo-Year Comparison13.2%13.2%(2018) ;13.4%(2017)Percentage of people in poverty in thepast 12 months by state (below 100%FPL/thresholds)Percentage of people in poverty in 2017and 2018 decreased .2% in MissouriComponents & DefinitionsData SourceEx. Family of 4 at 100% Federal Poverty Line 26,200*People and families are classified as poor if theirincome is less than their poverty threshold. If theirincome is less than half their poverty threshold, theyare severely poor (below 50% of poverty); less thanthe threshold itself, they are poor (below 100% ofpoverty); less than 1.25 times the threshold, below125% of poverty, and so on. -Census Bureau*****Doesn't adjust for differences in cost of livingbetween urban and rural areas.****HHS Poverty Guidelines for 2020, USDepartment of Health and HumanServicesNOTE: If a family's total income is less than thefamily's threshold, then that family and everyindividual in it is considered in poverty. Theofficial poverty thresholds do not varygeographically, but they are updated for inflationusing the Consumer Price Index (CPI-U). Theofficial poverty definition uses money incomebefore taxes and does not include capital gains ornoncash benefits (such as public housing,Medicaid, and food stamps). Poverty status cannotbe determined for people in: Institutional groupquarters (such as prisons or nursing homes), Collegedormitories, Military barracks, Living situations withoutconventional housing (and who are not in shelters).Additionally, poverty status cannot be determine forunrelated individuals under age 15 (such as fosterchildren) because income questions are asked ofpeople age 15 and older and, if someone is under age15 and not living with a family member, we do notknow their income. - Census Bureau*Poverty status is determined by comparing annualincome to a set of dollar values (called povertythresholds) that vary by family size, number ofchildren, and the age of the householder. If a family’sbefore-tax money income is less than the dollar valueof their threshold, then that family and every individualin it are considered to be in poverty. For people notliving in families, poverty status is determined bycomparing the individual’s income to his or her povertythreshold. The poverty thresholds are updatedannually to account for changes in the cost of livingusing the Consumer Price Index (CPI-U). They do notvary geographically. The ACS is a continuous surveyand people respond throughout the year. Sinceincome is reported for the previous 12 months, theappropriate poverty threshold for each family isdetermined by multiplying the base-year povertythreshold from 1982 by the average of monthly CPIvalues for the 12 months preceding the survey month.--Census BureauU.S. Census Bureau, 2018 AmericanCommunity Survey 1-Year Estimates,Poverty Status in the Past 12 Months(Table ID: S1701), MissouriU.S. Census Bureau, 2018 AmericanCommunity Survey 1-Year Estimates,Poverty Status in the Past 12 Months(Table ID: S1701), Missouri ; U.S.Census Bureau, 2017 AmericanCommunity Survey 1-Year Estimates,Poverty Status in the Past 12 Months2017 and 2018 American Community Survey (ACS) 1- (Table ID: S1701), Missouri ; U.S.year estimates to analyze poverty rates for 2018, asCensus Bureau, 2018 AmericanCommunity Survey 1-Year Estimates,well as the changes in poverty from 2017 for theSelected Characteristics of People atnation, states, the District of Columbia, Puerto Rico,Specified Levels of Poverty in the Pastand the most populous metropolitan areas.12 Months (Table ID: S1703), Missouri ;U.S. Census Bureau, 2017 AmericanCommunity Survey 1-Year Estimates,Selected Characteristics of People atSpecified Levels of Poverty in the Past12 Months (Table ID: S1703), Missouri
2020 Missouri Poverty ReportHOW TO READ THE REPORT: The Official Poverty Measure (OPM) uses income thresholds composed by tripling the cost of a minimum food diet in 1963 adjusted for inflation and for familysize, householder age, and famiy composition. In this sense, poverty touches on two key themes used to conceptualize this poverty report: Economic and Family Security and Food andNutrition. Many scholars and experts have argued that this number is shortsighted in capturing the dimensions of poverty as a lived experience, leaving out factors such as housing and energy,education, health--even environment. The Supplemental Poverty Measure (SPM) is an attempt to expand poverty definitions to help illustrate gaps in the OPM definition, compensating forhousehold expenses, but is not factored into the statistic used for allocating funding for safetynet programs. Still, these measures only tell part of the poverty narrative as it plays out in real-timefor individuals and families not only in Missouri, but for all 50 states. For that reason, the poverty report aggregates what it means to experience poverty, highlighting the interconnectedness ofdiverse variables that either elevate someone into economic stability or act as weights dragging them deeper down the poverty spiral. These numbers are a reflection of raw data provided by theUS Census Bureau and ways that data is translated and analyzed into categories by experts and advocates to provide scope to a bigger picture of poverty, expanding that logic model. Whenreviewing this data, consider the overlapping and interconnected perspectives through the lens of each theme to understand how it impacts an individual's ability to thrive economically, stratifiedby gender, age, and race. Comparing this data with the number of people accessing safety net programs is a way to provide key insights as to what is and is not working for yourregion/county/state. This report offers a foundation for deicionmakers to make better decisons to better address the welfare of the people, which is the supreme law of Missouri, and intends toassist community partners in advocating for funding to meet the needs in their service area. If there are any questions about the information enclosed in the report that is not provided by thisreport, please contact Sarah Hackman at Missouri CAN or Jessie Dryden at CSuB for clarification.--A Note from Jessie Dryden, jthescientist@theuncommonbond.org, Common Sense for an (un)Common BondData Reported in Chronology2018 Poverty Rate County by CountyMissouri How Use Data to Discuss the(example)Need5.7% (St.Charles,lowest) ;29.1%(Pemiscot,highest)Percentage of people of all ages inpoverty in 2018 by countyMissouri ranks among 20th highest inPoverty Across the Nation 13.2% (MO) the US for poverty rates out of 50 statesand the District of Columbia. *32/51This chart compares percentages of allpeople in poverty for US, MO, and 10highest and lowest poverty rate countiesfrom 1997-2018. The gap between2004-2005 indicates the shift between13.1% (US),Historical Trends - US & MOmeasuring poverty through Current13.2% (MO)Population Survey (CPS) -decenniallong-form sample questionnaire,replaced by the a more comprehensivesubnational survey, AmericanCommunity Survey (ACS).Ex.25.7%(Blackpoverty rate, This reads as, "Out of 672,581Two-Year Comparison of Poverty by2018) ;blacks/African Americans in Missouri,Demographics24.7% (Black 25.7% live in poverty in 2018."poverty rate,2017)Components & DefinitionsData SourceThe SAIPE program produces single-year estimates ofmedian household income and poverty for states andall counties, as well as population and povertyestimates for school districts. Since SAIPE estimatescombine ACS data with administrative and other data,SAIPE estimates generally have lower variance thanUS Census Bureau, 2018 Small AreaACS estimates but are released later because theyIncome and Poverty Estimates (SAIPE),incorporate ACS data in the models. For counties and Missourischool districts, particularly those with populationsbelow 65,000, the SAIPE program provides the mostaccurate subnational estimates of poverty. Forcounties, SAIPE generally provides the best singleyear estimates of median household income. - CensusBureauThis is a comparison ranking poverty among 50 statesplus District of Columbia from a Census Bureau reportreleased in 2019. Changes in poverty rates from 2017to 2018 for each state is reflected in the map on page4.US Census Bureau AmericanCommunity Survey, Poverty: 2017 and2018 - American Community SurveyBrief, US Census BureauThe gap between 2004-2005 is due to data migrationand changes to the surveys from CPS (surveystargeting employment 95K addresses, conductedFebruary-April, national population) to ACS (annualsurvey sampling 3.5M addresses throughout the year, US Census Bureau, 2018 Small AreaIncome and Poverty Estimates (SAIPE),subnational populations). For more about dataMissourisources visit: y/guidance/data-sources.html*NOTE: Comparing ACS Data prior to that gap is notrecommended due to the changes in the metholodolgyof calculation.To understand how the MO poverty rate affectsdifferent subpopulations, provided is a two-year tablecomparing poverty rates and raw estimates of peopleexperiencing poverty for asian, black, hispanic/latino,and white populations, including a column for childpoverty (children under 18) in each demographic.Based on the total population of each demographic,the percentage indicates how different racial groupsexperience poverty from 2017-2018 in Missouri.US Census Bureau, 2018 AmericanCommunity Survey 1-Year Estimates,Poverty Status in the Past 12 Months(Table ID: S1701), Missouri ; US CensusBureau, 2017 American CommunitySurvey 1-Year Estimates, Poverty Statusin the Past 12 Months (Table ID: S1701),Missouri
2020 Missouri Poverty ReportHOW TO READ THE REPORT: The Official Poverty Measure (OPM) uses income thresholds composed by tripling the cost of a minimum food diet in 1963 adjusted for inflation and for familysize, householder age, and famiy composition. In this sense, poverty touches on two key themes used to conceptualize this poverty report: Economic and Family Security and Food andNutrition. Many scholars and experts have argued that this number is shortsighted in capturing the dimensions of poverty as a lived experience, leaving out factors such as housing and energy,education, health--even environment. The Supplemental Poverty Measure (SPM) is an attempt to expand poverty definitions to help illustrate gaps in the OPM definition, compensating forhousehold expenses, but is not factored into the statistic used for allocating funding for safetynet programs. Still, these measures only tell part of the poverty narrative as it plays out in real-timefor individuals and families not only in Missouri, but for all 50 states. For that reason, the poverty report aggregates what it means to experience poverty, highlighting the interconnectedness ofdiverse variables that either elevate someone into economic stability or act as weights dragging them deeper down the poverty spiral. These numbers are a reflection of raw data provided by theUS Census Bureau and ways that data is translated and analyzed into categories by experts and advocates to provide scope to a bigger picture of poverty, expanding that logic model. Whenreviewing this data, consider the overlapping and interconnected perspectives through the lens of each theme to understand how it impacts an individual's ability to thrive economically, stratifiedby gender, age, and race. Comparing this data with the number of people accessing safety net programs is a way to provide key insights as to what is and is not working for yourregion/county/state. This report offers a foundation for deicionmakers to make better decisons to better address the welfare of the people, which is the supreme law of Missouri, and intends toassist community partners in advocating for funding to meet the needs in their service area. If there are any questions about the information enclosed in the report that is not provided by thisreport, please contact Sarah Hackman at Missouri CAN or Jessie Dryden at CSuB for clarification.--A Note from Jessie Dryden, jthescientist@theuncommonbond.org, Common Sense for an (un)Common BondData Reported in ChronologyMissouri How Use Data to Discuss the(example)NeedComponents & DefinitionsData SourceECONOMIC AND FAMILYSECURITYMedian Household IncomeUS Census Bureau, 2018 AmericanCommunity Survey 1-Year Estimates,Income in the Past 12 Months (Table ID:S1901), Missouri 54,478This includes the income of thehouseholder and all other individuals 15 52,004(men, US) ; years old and over in the household,Median Income for Men and Womenwhether they are related to the 42,238(women, US) householder or not for the last 12months. - Census BureauMeasuring median household income atthe county level more appropriately 31, 831(Pemiscot, illustrates statewide performance, andprovides an opportunity to target areashighestMedian Household Income for poverty rate) of greatest need.top/bottom 10 counties ; 82,048(St. Charles,lowestpoverty rate)Income Volatility23.9%High volatlity means more uncertaintyabout what the value of an asset will bein the future, affected by individualearnings and household income.Volatility can include reduction in workhours, illness/disability, layoffs, etc."Percentage of households that reportedtheir incomes varied somewhat or a lotfrom month to month over the past 12months."The median divides the income distribution into twoequal parts: one-half of the cases falling below themedian income and one-half above the median. Forhouseholds and families, the median income is basedon the distribution of the total number of householdsand families including those with no income.Themedian household income calculates the incomesfrom all individuals over 15 years old in a householdfor the last 12 months for an area and uses the middleincome. -Census Bureau**It is important to note that MHI is counterbalanced byincome inequality (Gini Index). MHI might beincreasing steadily for the US, but for several states(Alabama, Arkansas, California, Kansas, Nebraska,New Hampshire, New Mexico, Texas and Virginia) sohas inequality.US Census Bureau, 2018 AmericanCommunity Survey 1-year Estimates,Median Earnings in the Past 12 Months(in 2018 inflation-adjusted dollars) ofworkers by sex and women’s earningsas a percentage of men’s earning byselected characteristics (Table ID:S2002)US Census Bureau, 2018 Small AreaIncome and Poverty Estimates (SAIPE),Median Household Income, Missouri ;US Census Bureau, 2018 Small AreaIncome and Poverty Estimates (SAIPE),Poverty Rates – all ages, MissouriProsperity Now Scorecard, FinancialAssets and Income: Income Volatility(2017 FDIC National Survey ofUnbanked and UnderbankedIn household finances, volatility is usually defined asHouseholds, Federal Deposit Insurancethe variance of income, meaning the amount ofdivergence from the average. It can also be measured Corporation, 2018)by the number of substantial spikes and dips inincome over time.Higher income inequality contributes toslower or negative economic growth,and inequality in America is at its highest22nd highestRatio of the annual household income of householdslevel since the early part of the 20thin the top income quintile to households in the bottomIncome Equality in Missouri for incomecentury. This measure captures theinequalityincome quintile - Prosperity Nowincome gap between the upper-mostand bottom-most tiers of the incomedistribution.--Prosperity NowEarly each month, the Bureau of Labor Statistics(BLS) of the U.S. Department of Labor announces thetotal number of employed and unemployed people inthe United States for the previous month, along withmany characteristics about them. These figures,particularly the unemployment rate—which tells youthe percentage of the labor force that is unemployed—receive wide coverage in the media. Some peoplethink that to get these figures on unemployment, theUnemployed people are those whogovernment uses the number of people collectingreport that they are without work, thatunemployment insurance (UI) benefits under state orthey are available for work and that theyEmployment and Unemployment 3.2% (2018)federal government programs. But some people arehave taken active steps to find work instill jobless when their benefits run out, and 2 manythe last four weeks. -Bureau Labormore are not eligible at all or delay or never apply forStatistics/OECDbenefits. So, quite clearly, UI information cannot beused as a source for complete information on thenumber of unemployed. Because unemploymentinsurance records relate only to people who haveapplied for such benefits, and since it is impractical tocount every unemployed person each month, thegovernment conducts a monthly survey called theCurrent Population Survey (CPS) to measure theextent of unemployment in the country. -BLSProsperity Now Scorecard, FinancialAssets and Income: Income Equality(State Data and Congressional Districts:US Census Bureau, 2018 AmericanCommunity Survey, Local Data: USCensus Bureau, 2013-2017 AmericanCommunity Survey)State Employment and Unemployment:December 2019, Bureau of LaborStatistics, US Department of Labor ; USBureau of Labor Statistic, ExpandedState Employment Status DemographicData, 2019 ; Preliminary 2019 Data onEmployment Status by State andDemographic Group, US Bureau ofLabor Statistics
2020 Missouri Poverty ReportHOW TO READ THE REPORT: The Official Poverty Measure (OPM) uses income thresholds composed by tripling the cost of a minimum food diet in 1963 adjusted for inflation and for familysize, householder age, and famiy composition. In this sense, poverty touches on two key themes used to conceptualize this poverty report: Economic and Family Security and Food andNutrition. Many scholars and experts have argued that this number is shortsighted in capturing the dimensions of poverty as a lived experience, leaving out factors such as housing and energy,education, health--even environment. The Supplemental Poverty Measure (SPM) is an attempt to expand poverty definitions to help illustrate gaps in the OPM definition, compensating forhousehold expenses, but is not factored into the statistic used for allocating funding for safetynet programs. Still, these measures only tell part of the poverty narrative as it plays out in real-timefor individuals and families not only in Missouri, but for all 50 states. For that reason, the poverty report aggregates what it means to experience poverty, highlighting the interconnectedness ofdiverse variables that either elevate someone into economic stability or act as weights dragging them deeper down the poverty spiral. These numbers are a reflection of raw data provided by theUS Census Bureau and ways that data is translated and analyzed into categories by experts and advocates to provide scope to a bigger picture of poverty, expanding that logic model. Whenreviewing this data, consider the overlapping and interconnected perspectives through the lens of each theme to understand how it impacts an individual's ability to thrive economically, stratifiedby gender, age, and race. Comparing this data with the number of people accessing safety net programs is a way to provide key insights as to what is and is not working for yourregion/county/state. This report offers a foundation for deicionmakers to make better decisons to better address the welfare of the people, which is the supreme law of Missouri, and intends toassist community partners in advocating for funding to meet the needs in their service area. If there are any questions about the information enclosed in the report that is not provided by thisreport, please contact Sarah Hackman at Missouri CAN or Jessie Dryden at CSuB for clarification.--A Note from Jessie Dryden, jthescientist@theuncommonbond.org, Common Sense for an (un)Common BondData Reported in ChronologyMissouri How Use Data to Discuss the(example)Need 9.45 (hourlyrate 2020) ; 19,656Missouri Minimum Wage(annually, 40hours perweek)Minimum wage for Missourians in 2020is 9.45/hour, increasing .85 annuallyto reach 12 by 2023 for all private,nonexempt businesses. Minimum wageis the lower most hourly wage anyemployee can expect by law and wasoriginally established to allow workersenough income to stay above thepoverty line.Components & DefinitionsIn addition to the exemption for federally coveredemployment, the law exempts, among others,employees of a retail or service business with grossannual sales or business done of less than 500,000.Premium pay required after 52 hours in seasonalamusement or recreation businesses. The minimumwage is adjusted annually based on a set formula.Continuing on from 2019 to 2023, the minimum wagewill increase 85 cents per hour each year beforereaching 12.00.--DOL**2017--State of MO passed law limiting to preventmunicipalities from establishing a higher minimumwage than the State.**Variables to consider for minimum wage laws:Demand for living wage, Wage adjustment vis-à-visConsumer Price Index (CPI), Cost of living andchanges therein, Needs of workers and their families,Improvements in standards of living, Fair return oncapital invested and capacity to pay of employers,Productivity, Prevailing wage levels, Need to induceindustries to invest in the countryside, Effects onemployment generation and family income, Equitabledistribution of income and wealth along theimperatives of economic social developmentData SourceMinimum Wage, Missouri Department ofLabor, January 2020 13. ConsolidatedMinimum Wage Table, US Department ofLabor, January 2020
2020 Missouri Poverty ReportHOW TO READ THE REPORT: The Official Poverty Measure (OPM) uses income thresholds composed by tripling the cost of a minimum food diet in 1963 adjusted for inflation and for familysize, householder age, and famiy composition. In this sense, poverty touches on two key themes used to conceptualize this poverty report: Economic and Family Security and Food andNutrition. Many scholars and experts have argued that this number is shortsighted in capturing the dimensions of poverty as a lived experience, leaving out factors such as housing and energy,education, health--even environment. The Supplemental Poverty Measure (SPM) is an attempt to expand poverty definitions to help illustrate gaps in the OPM definition, compensating forhousehold expenses, but is not factored into the statistic used for allocating funding for safetynet programs. Still, these measures only tell part of the poverty narrative as it plays out in real-timefor individuals and families not only in Missouri, but for all 50 states. For that reason, the poverty report aggregates what it means to experience poverty, highlighting the interconnectedness ofdiverse variables that either elevate someone into economic stability or act as weights dragging them deeper down the poverty spiral. These numbers are a reflection of raw data provided by theUS Census Bureau and ways that data is translated and analyzed into categories by experts and advocates to provide scope to a bigger picture of poverty, expanding that logic model. Whenreviewing this data, consider the overlapping and interconnected perspectives through the lens of each theme to understand how it impacts an individual's ability to thrive economically, stratifiedby gender, age, and race. Comparing this data with the number of people accessing safety net programs is a way to provide key insights as to what is and is not working for yourregion/county/state. This report offers a foundation for deicionmakers to make better decisons to better address the welfare of the people, which is the supreme law of Missouri, and intends toassist community partners in advocating for funding to meet the needs in their service area. If there are any questions about the information enclosed in the report that is not provided by thisreport, please contact Sarah Hackman at Missouri CAN or Jessie Dryden at CSuB for clarification.--A Note from Jessie Dryden, jthescientist@theuncommonbond.org, Common Sense for an (un)Common BondData Reported in ChronologyMissouri How Use Data to Discuss the(example)NeedComponents & DefinitionsData SourceEDUCATION71.4% ofMissourianshave aneducationalEducational Attainmentattainmentless than abachelor'sdegreeEducational attainment refers to thehighest level of education completed byan individual 25 years or older for fulltime wage and salary earners and isused to provide scope to the impact ofeducation on individual earnings.The ACS asks, “What is the highest degree or level ofschool this person has completed?” The responsecategories include: No schooling completed, Nurseryschool, Grades 1 through 11, 12th grade—no diploma,Regular high school diploma, GED or alternativecredential, Some college credit, but less than 1 year ofcollege, 1 or more years of college credit, no degree,Associates degree (for example: AA, AS), Bachelor’sdegree (for example: BA. BS), Master’s degree (forexample: MA, MS, MEng, MEd, MSW, MBA),Professional degree beyond bachelor’s degree (forexample: MD, DDS, DVM, LLB, JD), Doctorate degree(for example, PhD, EdD). In addition to formaldegrees, people often earn educational certifications,certificates and licenses. These are recorded with aseparate question on the Current Population Survey.Related to educational attainment is the field in whicha person received his or her degree. A question onfield of bachelor’s degree is included in the AmericanCommunity Survey.--Census Bureau25.9% (lessthan highschoolPoverty Rate by Educational diploma) ;Attainment3.8%(bachelor'sdegree orhigher)Poverty rate for the population 25 yearsand over for whom poverty status isdetermined by educational attainmentlevel.--Census BureauCombination of questions from the ACS are used toinform this calculation.5.6%/ 553per week(less thanhigh schoolUnemployment and Earnings bydiploma) ;Educational Attainment1.5%/ 1884per week(professionaldegree)Data in the chart indicate how weeklyearnings and rates of unemploymentvary by educational attainment forworkers ages 25 and older at a broadCombination of questions from CPS used to informlevel. Individual experiences differ,calculationhowever, depending on factors such asyour field of degree and your occupation.--Bureau of Labor StatisticsAdjusted Cohort Graduation Rate(ACGR) for public high school studentsby graduation rate 2016-2017. The88.3%,ACGR is the percentage of public highNational High School Graduation Rate ranked 13th school freshmen who graduate with a(2016-2017) regular diploma within 4 years of startingninth grade.--US DESE/NCES**Missouri ranks 13th in national highschool graduation with a rate of 88.3%**High school dropout rates report anannual snapshot of students whodropped out in any given school year.Data contained in dropout rates reflectHigh School Dropout Rates 1.9% (
The SAIPE program produces single-year estimates of median household income and poverty for states and all counties, as well as population and poverty estimates for school districts. Since SAIPE estimates combine ACS data with administrative and other data, SAIPE estimates generally have lower variance than