Transcription
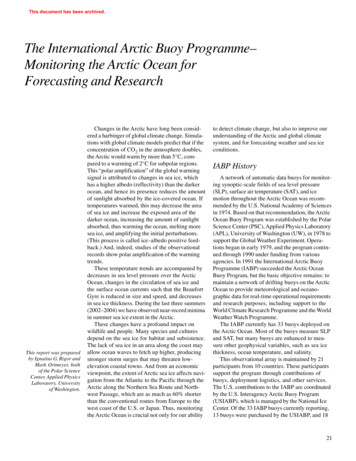
This document has been archived.The International Arctic Buoy Programme–Monitoring the Arctic Ocean forForecasting and ResearchThis report was preparedby Ignatius G. Rigor andMark Ortmeyer, bothof the Polar ScienceCenter, Applied PhysicsLaboratory, Universityof Washington.Changes in the Arctic have long been considered a harbinger of global climate change. Simulations with global climate models predict that if theconcentration of CO2 in the atmosphere doubles,the Arctic would warm by more than 5 C, compared to a warming of 2 C for subpolar regions.This “polar amplification” of the global warmingsignal is attributed to changes in sea ice, whichhas a higher albedo (reflectivity) than the darkerocean, and hence its presence reduces the amountof sunlight absorbed by the ice-covered ocean. Iftemperatures warmed, this may decrease the areaof sea ice and increase the exposed area of thedarker ocean, increasing the amount of sunlightabsorbed, thus warming the ocean, melting moresea ice, and amplifying the initial perturbations.(This process is called ice–albedo positive feedback.) And, indeed, studies of the observationalrecords show polar amplification of the warmingtrends.These temperature trends are accompanied bydecreases in sea level pressure over the ArcticOcean, changes in the circulation of sea ice andthe surface ocean currents such that the BeaufortGyre is reduced in size and speed, and decreasesin sea ice thickness. During the last three summers(2002–2004) we have observed near-record minimain summer sea ice extent in the Arctic.These changes have a profound impact onwildlife and people. Many species and culturesdepend on the sea ice for habitat and subsistence.The lack of sea ice in an area along the coast mayallow ocean waves to fetch up higher, producingstronger storm surges that may threaten lowelevation coastal towns. And from an economicviewpoint, the extent of Arctic sea ice affects navigation from the Atlantic to the Pacific through theArctic along the Northern Sea Route and Northwest Passage, which are as much as 60% shorterthan the conventional routes from Europe to thewest coast of the U.S. or Japan. Thus, monitoringthe Arctic Ocean is crucial not only for our abilityto detect climate change, but also to improve ourunderstanding of the Arctic and global climatesystem, and for forecasting weather and sea iceconditions.IABP HistoryA network of automatic data buoys for monitoring synoptic-scale fields of sea level pressure(SLP), surface air temperature (SAT), and icemotion throughout the Arctic Ocean was recommended by the U.S. National Academy of Sciencesin 1974. Based on that recommendation, the ArcticOcean Buoy Program was established by the PolarScience Center (PSC), Applied Physics Laboratory(APL), University of Washington (UW), in 1978 tosupport the Global Weather Experiment. Operations began in early 1979, and the program continued through 1990 under funding from variousagencies. In 1991 the International Arctic BuoyProgramme (IABP) succeeded the Arctic OceanBuoy Program, but the basic objective remains: tomaintain a network of drifting buoys on the ArcticOcean to provide meteorological and oceanographic data for real-time operational requirementsand research purposes, including support to theWorld Climate Research Programme and the WorldWeather Watch Programme.The IABP currently has 33 buoys deployed onthe Arctic Ocean. Most of the buoys measure SLPand SAT, but many buoys are enhanced to measure other geophysical variables, such as sea icethickness, ocean temperature, and salinity.This observational array is maintained by 21participants from 10 countries. These participantssupport the program through contributions ofbuoys, deployment logistics, and other services.The U.S. contributions to the IABP are coordinatedby the U.S. Interagency Arctic Buoy Program(USIABP), which is managed by the National IceCenter. Of the 33 IABP buoys currently reporting,13 buoys were purchased by the USIABP, and 1821
Positions of the IABPbuoys on March 1, 2005.The colors correspond tothe various participants ofthe IABP. (See below for alist of acronyms.)IABP Participants1. Alfred Wegener Institute (AWI), Germany2. Arctic and Antarctic Research Institute (AARI), Russia3. Chinese Arctic and Antarctic Administration (CAAA),China4. Christian Michelsen Research Institute (CMRI), Norway5. Collecte Localisation Satellites and Service Argos, Franceand USA6. Cold Regions Research and Engineering Laboratory(CRREL), USA7. Environment Canada (EC), Canada8. Institute of Ocean Sciences, Canada9. International Arctic Research Center (IARC), Universityof Alaska Fairbanks, USA, and Japan10. Japan Agency for Marine–Earth Science and Technology(JAMSTEC), Japan11. Marine Environmental Data Service (MEDS), Canada12. Metocean Data Systems, Canada13. Nansen Environmental and Remote Sensing Center(NERSC), Norway14. National/Naval Ice Center (NIC), USA15. Naval Oceanographic Office (NAVO), USA16. Norwegian Polar Institute (NPI), Norway2217. Norwegian Meteorological Institute (NMI), Norway18. Pacific Marine and Environmental Laboratory (PMEL),USA19. Polar Science Center (PSC), Applied Physics Laboratory,University of Washington, USA20. Scottish Association for Marine Science (SAMS), Scotland21. Woods Hole Oceanographic Institute (WHOI), USA22. World Climate Research Programme (WCRP), SwitzerlandUSIABP Contributors1. International Arctic Research Center, University of AlaskaFairbanks2. National Aeronautics and Space Administration3. National Oceanic and Atmospheric Administration(NOAA), Arctic Research Office4. NOAA, National Environmental Satellite, Data andInformation Service5. NOAA, Office of Global Programs6. Naval Oceanographic Office7. Naval Research Laboratory8. National Science Foundation9. Office of Naval Research10. U.S. Coast Guard
buoys were deployed using logistics coordinatedby the USIABP. The USIABP also funds the coordination and data management of the IABP by thePSC. The observations from the IABP are postedon the Global Telecommunications System foroperational use; they are also archived at theWorld Data Center for Glaciology at the NationalSnow and Ice Data Center (http://nsidc.org) andcan be obtained from the IABP web server forresearch (http://iabp.apl.washington.edu).Uses of IABP DataThe authors are funded bythe U.S. InteragencyArctic Buoy Programunder the Office of NavalResearch grant N0001498-0698.The observations from the IABP have beenparticularly important for: Forecasting weather. The IABP buoys areessential for analyzing and forecastingweather features in the Arctic. Detecting Arctic and global climate change.One of the first indicators of Arctic climatechange was found by Walsh and colleaguesusing the buoy data. They showed thatsea level pressure over the Arctic Oceandecreased by over 4 hPa from 1979 to 1994.Data from the IABP have also been assimilatedinto the global temperature data sets, and theIABP surface air temperature analysis showsthat the increased air temperatures noted overland extend out over the Arctic Ocean. Specifically, Rigor and colleagues found warmingtrends in surface air temperature (SAT) overthe Arctic Ocean during winter and spring,with values as high as 2 C per decade in theeastern Arctic during spring. Forcing, assimilating, and validating globalweather and climate models. For example,the buoy data have been used to validatethe Polar Ice Prediction System model developed at the Naval Research Laboratory andare assimilated into the National Center forEnvironmental Prediction–National Centerfor Atmospheric Research re-analysis datasets. Predicting sea ice conditions. Our ability toaccurately forecast sea ice conditionsdepends on observations of surface air temperature and sea ice motion over the ArcticOcean. For example, during the summers of2002 and 2003, lower-than-normal air temperatures were observed over the Alaskan coast,and yet record minima in sea ice extent wereobserved. To explain this paradox, Rigor andWallace hypothesized that these recentminima may be due to changes in the thick-Weather map showing acyclone approachingAlaska from the ArcticOcean. The red dots showthe positions of the IABPbuoys. The strength andtrajectory of this stormwould have been difficultto predict without observations from the buoys.23
Change in sea level pressure over the ArcticOcean. Using IABP data,Walsh and colleaguesshowed that SLPdecreased by over 4 hPa(right), when they took thedifference between IABPSLPs from 1979 to 1986(left) and 1987 to 1994(center). These changes inSLP (winds) drive acyclonic anomaly in icemotion (vectors).ness of sea ice blown towards the Alaskancoast by the surface winds. To show this,they used a simple model to estimate the ageof sea ice based on the observed drift (residence time) of the sea ice provided by thebuoys. They showed that the age (and thickness) of sea ice has decreased dramaticallyin the 1990s, and this younger, thinner sea icewas observed to drift towards the Alaskancoast during the last few years. They arguedthat although temperatures may have beenlower, the air was still warmer than the meltingtemperature of sea ice, and it simply takes lessheat to melt younger, thinner sea ice, thusexplaining the recent record minima in sea iceextent.As of 2004, over 500 papers have been writtenusing the observations collected by the IABP.IABP in the FutureThe observations from IABP have been one ofthe cornerstones for environmental forecastingChanges in the age (thickness) of sea ice from September 1987 to September2001. The larger area ofyounger, thinner ice(right) is less likely to survive the summer melt. Fordetails, see “Variations inthe age of sea ice andsummer sea ice extent,”by I.G. Rigor and J.M.Wallace, GeophysicalResearch Letters, Vol. 31,2004, which can beobtained from nd studies of climate and climate change. Manyof the changes in Arctic climate were first observedor explained using data from the IABP.The IABP is also evolving to better support theoperational and research requirements of the community. For example, some of the participants ofthe IABP have been deploying buoys that measure not only SLP and SAT, but also ocean currents, temperatures, and salinity. Other buoyshave been enhanced to measure the ice mass balance using thermistor strings and pingers aimedat the top and bottom of the sea ice. The data provide a myriad of concurrent time series at a fewpoints across the Arctic Ocean. From these datawe can also estimate time variations in other geophysical variables, such as oceanic heat storageand heat flux. These stations provide criticalatmospheric, ice, and upper ocean hydrographicmeasurements that cannot be obtained by othermeans. These data can be used for validatingsatellites; for forcing, validation, and assimilationinto global climate models; and for forecastingweather and ice conditions.
Monitoring the Arcticusing enhanced IABPbuoys. The top two panelsshow sea level pressureand surface air temperature measured by the JapanAgency for Marine–EarthScience and Technology(JAMSTEC) CompactArctic Drifter (JCAD) andan ice mass balance (IMB)buoy that are collocated inthe Arctic Ocean. The thirdpanel shows snow depth,ice temperature, ice thickness, and ocean temperature measured by the IMB.The bottom panel showsocean temperaturesfrom the JCAD.The Arctic and global climate system is changing. These changes threaten our Native culturesand ecosystems, but they may also provide economic and social opportunities. To understandand respond to these changes, we need to sustainour current observational systems, and for theArctic, the IABP provides the longest continuingrecord of observations.ReferencesAagaard, K., and E.C. Carmack (1994) The ArcticOcean and climate: A perspective. In The PolarOceans and Their Role in Shaping the GlobalEnvironment: The Nansen Centennial Volume(O.M. Johannessen, R. D. Muench, and J.E. Overland, ed.), American Geophysical Union, p. 5–20.Jones, P.D., M. New, D.E. Parker, S. Martin, andI.G. Rigor (1999) Surface air temperature and itschanges over the past 150 years. Reviews ofGeophysics, Vol. 37, No. 2 , p. 173–200.Kalnay et al. (1996) The NCEP/NCAR ReanalysisProject. Bulletin of the American Meteorological Society, Vol. 77, p. 437–471.Lynch, A.H., E.N. Cassano, J.J. Cassano, and L.R.Lestak (2003) Case studies of high wind eventsin Barrow, Alaska: Climatological context anddevelopment processes. Monthly WeatherReview, Vol. 131, No. 4, p. 719–732.Makshtas, A.P., S.V. Shoutilin, and E.L. Andreas(2003) Possible dynamic and thermal causesfor the recent decrease in sea ice in the ArcticBasin. Journal of Geophysical Research, Vol.108, No. C7, p. 3,232.Manabe, S., R.J. Stouffer, M.J. Spelman, and K.Bruan (1991) Transient response of a coupledocean–atmosphere model to gradual changesin atmospheric CO2: Part I. Annual meanresponse. Journal of Climate, Vol. 4, No. 8,p. 785–818.Parkinson, C.L., D.L. Cavalieri, P. Gloersen, H.J.Zwally, and J. Comiso (1999) Arctic sea iceextents, areas, and trends, 1978–1996. Journalof Geophysical Research, No. 102, No. C6, p.20,837–20,856.Rigor, I.G., R.L. Colony, and S. Martin (2000) Variations in surface air temperature observations inthe Arctic, 1979–97. Journal of Climate, Vol. 13,No. 5, p. 896–914.Rigor, I.G., J.M. Wallace, and R.L. Colony (2002)Response of sea ice to the Arctic Oscillation.Journal of Climate, Vol. 15, No. 18, p. 2,648–2,663.Rigor, I.G., and J.M. Wallace (2004) Variations inthe age of sea ice and summer sea ice extent.Geophysical Research Letters, Vol. 31.Serreze, M.C., and J. Francis (Submitted) The Arctic amplification debate. Climate Change.Thompson, D.W. J., and J. M. Wallace (1998) TheArctic Oscillation signature in the wintertimegeopotential height and temperature fields.Geophysical Research Letters, Vol. 25, No. 9,p. 1297–1300.Walsh, J.E, W.L. Chapman, and T.L. Shy (1996)Recent decrease of sea level pressure in thecentral Arctic. Journal of Climate, Vol. 9, No.2, p. 480–486.Yu, Y., D.A. Rothrock, and G.A. Maykut (In press)Changes in thickness distribution of Arctic seaice between 1958–1970 and 1993–1997. Journalof Geophysical Research.25
the buoy data have been used to validate the Polar Ice Prediction System model devel-oped at the Naval Research Laboratory and are assimilated into the National Center for Environmental Prediction-National Center for Atmospheric Research re-analysis data sets. Predicting sea ice conditions. Our ability to accurately forecast sea ice .
