Transcription
Available online at www.sciencedirect.comScienceDirectProcedia Computer Science 00 (2019) 000–000www.elsevier.com/locate/procediaThe Fifth Information Systems International Conference 2019Business Intelligence for Designing Restaurant Marketing Strategy:A Case StudyKarina Kusuma Halima, Siana Halima*, Feleciaa†aIndustrial Engineering, Petra Christian University, Jl. Siwalankerto 121-131, Surabaya 60238, IndonesiaAbstractIn this study we design marketing strategy for a restaurant in Surabaya. The restaurant is a café restaurant, which targets mid-lowconsumer. The main problem for that restaurant is there has never been a specific marketing strategy. Promotions that have beenapplied so far are not directed and have no impact on sales because they are not based on any strategy. The application ofbusiness intelligence with Power Business Intelligent (Power BI) is expected to be a way for restaurants to predict consumer’sconsumption patterns. Additionally, we also model the consumption pattern using Market Basket Analysis. Consumer’sconsumption patterns captured used for designing the right marketing strategy with the 4P (Product, Place, Price, Promotion)concept. It was found that some of the restaurant menu’ had a unique relationship and could be used as a promotion to increasesales. Other results, in segment consumers there are children's and office worker. All information is supported using Power BIdashboard that expected to make the restaurant’ executives easier to analyze changes in sales based on the occurrence of eventsand activities. 2019 The Authors. Published by Elsevier B.V.This is an open access article under the CC BY-NC-ND license )Peer-review under responsibility of the scientific committee of The Fifth Information Systems International Conference 2019Keywords: Business Intelligent; Market Basket Analysis; Power Business Intelligent; 4P concept; Restaurant1. IntroductionBusiness owners in any field need to be one step ahead to face new wave consumers [4]. New wave consumers wantsomething that is personalized and customized. Big data analysis makes it easier to find out consumer transaction* Siana Halim. Tel.: 62-31-298-3425; fax: 62-31-8417658E-mail address: halim@petra.ac.id1877-0509 2019 The Authors. Published by Elsevier B.V.This is an open access article under the CC BY-NC-ND license )Peer-review under responsibility of the scientific committee of The Fifth Information Systems International Conference 2019
2Author name / Procedia Computer Science 00 (2019) 000–000patterns more specifically and personally. Big data can provide a pattern of customers’ information, businesses canpredict and assume what are the needs of their customers nowadays [9]. Market basket analysis with associationrules helps owners know consumer’s personal need and if captured can be used to design the right marketingstrategy. A research by Sagin and Ayvaz find associasion from customer purchase trends in hardware store. Thereseach findings can be used to increase sales, catalog design, in-store layout, warehouse design, promotionalarrangement and decission support system design [10]. Market basket analysis principles also applied to exploremenu items assortments in a restaurant by Ting Ping-Ho, et all and the result can be use to make menurecommendation [11]. Menu management issues such as menu planning, menu pricing, menu designing, menuoperating, and menu development are not independent but interrelated [12]. Conventional frequent itemsets miningdoes not take into consideration the relative benefit or significance of transactions belonging to different customers,therefore Weng Cheng Shiung use Frequency-Monetary weight toreflect the interest or intensity of customer valuesand focusing on revenue [13].The object used in this research is a restaurant in Surabaya with mid-low targeting. In the current condition there isnever been a specific marketing strategy. The promotions that have been applied are not directed and have no impacton sales because they are not based on any marketing strategy. Moreover, this problem brought the menu variationsnot conceptualized. The number of menus offered is 106 that may cause confused consumer of ordering food andnot optimal profit obtained [1].The aim of this research is to design marketing design by predicting consumer transaction pattern. Patterncollected processed through one of big data analysis method, market basket analysis. The result will be visualizedwith dashboard, so the restaurant owner could analyze costumer transaction pattern and faster in act especially atmaking promotion.2. Research Methods2.1 Business IntelligenceBusiness intelligence is a set of techniques and tools to convert data into meaningful information for analyzingbusiness by utilizing the use of technology and internet [8]. The purpose of implement business intelligence is tomake it easier interpret human behavior such as transaction pattern.2.2 Market Basket AnalysisMarket Basket Analysis (MBA) is a method that helpful in the marketing environment for marketing strategiesand business decisions. MBA is one of association rules application, knowing which products are purchasedsimultaneously will be very helpful for shopkeepers or other companies in managing their marketing strategies [3].2.3 Association RulesAssociation rules is a data mining method to find out association rules between items combination. Determiningan association rules, there are several interesting measures obtained from the results of processing data. Generally,there are three measures [2], support, confidence, and lift.2.4 R-SoftwareEvery transaction will be cleaned and processed with R software to look for consumer buying pattern. In thisresearch, R software is a tool for mining data especially association rules [7]. R software makes it easier to makewell designed plot, including symbols and mathematical formulas by typing the script and using several packagesthat help processing data instantly.2.5 Power Business IntelligencePower BI is internet-based software, help visualize and analyze raw data. The purpose of data visualization itselfis to make it easier for users to get information and make decisions quickly [6]. In this research, Power BI also canbe used for restaurant owner tool to make a strategic decision.
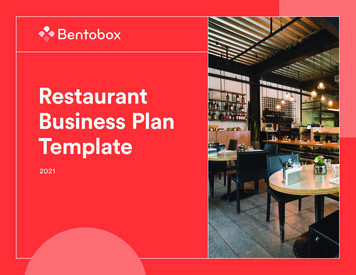
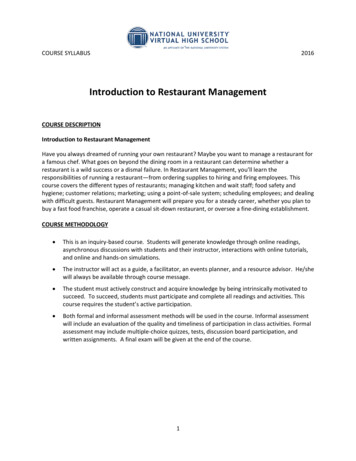
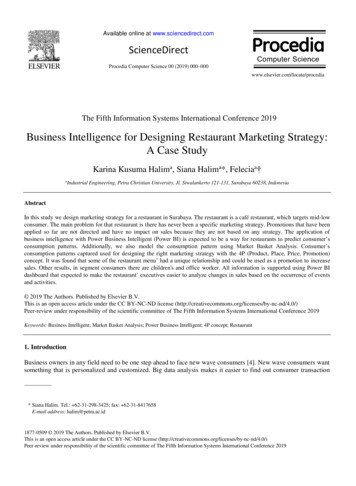
Author name / Procedia Computer Science 00 (2019) 000–00032.6 Marketing StrategyMarketing strategy is the base of company activities or marketing efforts to achieve the expected goals [5].Marketing strategies have four marketing mixes which are often referred to as 4P (product, price, promotion, andplace).2.7 Research FlowThe research flow starts from cleaning dataset, then developed the dashboard using PowerBI, constructing matrixincidence, determine the minimum support and minimum confidence, create association rules, analyse the result andthen create the new marketing strategy.3. Result and Discussions3.1 Consumer DescriptionThe restaurant consumer mostly are housewives at the age of 27 to 50. They came to shopping cookingingredients and household needs at a hypermarket and department store. Another consumer are husbands andchildren look for a place to sit, order food and wait in the restaurant while their housewives are shopping. Otherconsumer is office worker and entrepreneur who attending economic seminar every Saturday and Sunday.3.2. Data Cleaning and AggregationThe raw data obtained in this research are transaction list from a restaurant in Surabaya. Raw data used are in therange from March 23 to June 30, 2018 and then September 23 to October 16, 2018. The restaurant’s transaction listis influenced by several events. May 13 and 14 there were tragic bombing in several places in Surabaya. This causesSurabaya’s people to feel insecure and prefer to stay at home, including to eat. The same range of data, on May 17until June 16, 2018 is entering the fasting month. Data within these events will be analysed separately. Fifteenthousand eighty seven recorded data is used in this research.Aggregation variables are formed first to facilitate analysis of data. The addition of aggregate variables is thevariable day of transactions (Days), whether transactions are carried out on weekends or weekdays (Weekend),whether transactions entered on week with high income or not (Weekly), month of transactions (Month), whethertransaction entered on morning or night (Morning), food or beverage (Grouping), and food type (Type).The results of data cleaning along with the aggregate variables are then processed using Power BI software.Power BI software can display the data summary results by simply typing the script to explore the background ofa data with an easier-to-understand visualization. The data to be analysed are data without events of bombings andfasting months. Sales data will be processed on average and other sizes for later analysis. Consumer observations arealso processed and analysed. The results of this analysis will be one of the inputs for designing a marketing strategyfor the restaurant.3.3 Dashboard Business IntelligenceIt is important for a company to carry out continuous monitoring of its sales movements. The dashboard in Fig 1formed through Power BI software, is a tool for the restaurant executives to carry out monitoring and decisionmaking. Promotion carried out cannot be separated from monitoring.The first page of the dashboard provides a summary of general information on the restaurant. Importantinformation that can be known is the comparison of profits obtained this month and last month or weekly.Comparison of the two given target limits. The target is determined based on the calculation of the monthly costsincurred by the restaurant. Besides that, it can also be seen that the information on the average ability of consumersin each transaction (willingness to pay) is Rp. 69,370. Seven of the most favourite menus in the restaurant can alsobe known as a reference for promotion. Distribution of consumer arrivals is also displayed so that the restaurantexecutives know the right time to do promotion or preparation.The second page dashboard is a panel for analysing the restaurant menus. This panel will display a glimpse ofthe most favorite and not favorite menus outside the menu of Teh Manis (sweat tea), Nasi Putih (rice) and Air Putih(water). Using this panel, the executive can find the type of menu that is a favorite. Through this dashboardexecutive can find out which menu types are most purchased, so that they can be considered in the future to form amenu with that type.
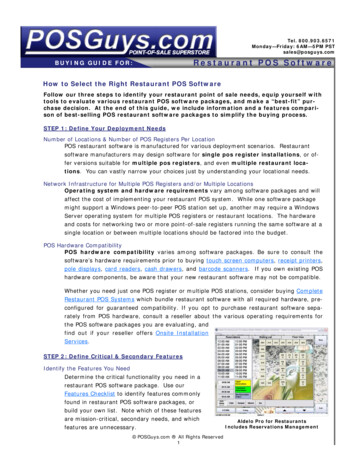
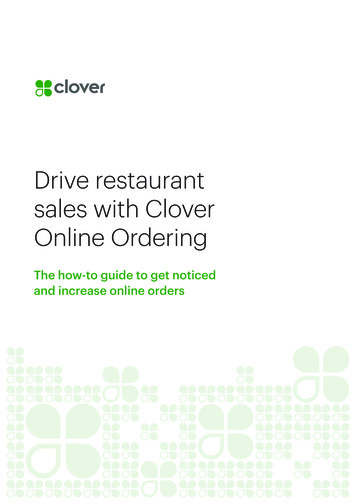
4Author name / Procedia Computer Science 00 (2019) 000–000Sales analysis base on occurrence of events can be done with a panel on the third page. Through the event listtable along with the profit margins obtained can be known which activity provides high profit. The panel on thispage will help executives find out what activities have a positive impact on sales and the possibility that they can bereplicated to be carried out continuously or repeated. Building event data is inputted according to the buildingactivity list, while local event data (the restaurant) has not been implemented. National holiday data is also includedin the event analysis to find out consumption patterns.3.3.1. Fasting Month Descriptive Data AnalysisThere may be a difference in the menu ordered during the fasting month, especially at night when Muslims breaktheir fast. Fig. 4 is the total food menu sales on May 16 to June 8, 2018 at night (04.00 PM - 10.00 PM). The hoursof breaking the fast based on the Ministry of Religion of the Republic of Indonesia for the period 1439 H / 2018 MFig 1. General Summary DashboardFig 2. Food Reference DashboardFig 4. Total Sales of Food Menu Fasting NightFig 3. Event Analysis DashboardFig 5. Total Sales of Beverage Menu Fasting NightTable 1. Association Rules Support 4% and Confidence 15%[1][2][3][4][5][6][7][8]lhs{Air Mineral, Ayam Goreng Nasi}{Air Mineral, Nasi Goreng 2IN1{Nasi Putih, Tahu}{Cobek B, Nasi Putih}{Air Mineral, Tahu}{Ayam Goreng Nasi, Nasi Putih}{Nasi Goreng 2IN1, Nasi Putih}{Nasi Goreng, Telur}rhs {Teh Manis}{Teh Manis}{Teh Manis}{Teh Manis}{Teh Manis}{Teh Manis}{Teh Manis}{Teh 142171155266
Author name / Procedia Computer Science 00 (2019) 000–0005[9]{Nasi Empal Gepuk} {Teh Manis}0.1090392 0.75492341.14835345[10] {Ice Lemon Tea, Nasi Putih} {Teh Manis}0.0401391 0.7514793 1.143116127*Teh Manis (Sweet Tea), Air Mineral (Water), Ayam Goreng (Fried Chicken), Nasi Goreng (Fried Rice), Nasi (Rice), Tahu (Tofu), Empal (FriedMeat)in Surabaya are 05.22 PM. The most ordered menu still Nasi Goreng 2IN1 followed by Nasi Empal Gepuk (rice andmeat) and Super Family. The menu choices that consumers choose when breaking their fast in dishes that have sidedishes, especially nutritious meat and eggs, even those that can be eaten with many people. Super Family is a Packettype food containing five pieces of fried chicken and rice, suitable for breaking fast with family or friends.3.3. Market Basket AnalysisThe output with aggregate variables then analysed by association rules to find out associative relationshipsbetween menus. The data used are data without events. This analysis done by using arules package in R software.The first step needed is delete duplicate data for each transaction with more than one type of menu name, becauseanalysis using association rules requires only one for each type of menu. The incidence matrix contains relationshipsbetween two objects or items so that only one identity is needed for each object or subject.Associative relationships can be done after forming incidence matrix that will show patterns of consumer habitsin choosing menus. Several factors need to be determined, minimum support and minimum confidence. Minimumsupport and minimum initial confidence are set at 4% and 15% respectively as they tried values as be seen in Table1. The value of support and confidence needs to be done by several times combination experiment to get thevaluable output and used for analysis or improvement.The results of 10 associative relationships from the value of the predetermined factors, all of which show the lhsmenu will increase sales on the Teh Manis (sweat tea) menu. Matrix incidence association rules for Teh Manis(sweat tea) can be seen in Fig 6. The results of the initial associative relationship still have not shown significantresults, the reason being that the restaurant consumers who order any food menu also order menus for Teh Manis(sweat tea), Air Putih (water), and Nasi Putih (rice).Fig 6. Matrix Incidence Association Rules Teh ManisAdjustment needed for association rules by removing the menu of Teh Manis, Air Putih and Nasi Putih.Minimum support and minimum confidence factor values are determined 1.25% and 15% respectively as the outputthat is expected to come out after making several attempts to change values. The main point of the experiment is toset high confidence values to describing the strength of the two menus. Followed by a high support value, describingthe frequency of the combination of the two objects from the overall high transaction data.The bigger value of support factor can describe that the more frequent associative relationships are transactionsbetween Tahu (Tofu) and Ice Lemon Tea and Tahu with Fresh Orange (orange circle). The other result ofassociative relationship that was formed after deleting several menus. Several experiments to obtain the values of
6Author name / Procedia Computer Science 00 (2019) 000–000support and confidence are determined 0.8% and 10% also be done. The results of the associative rules above foundseveral rules that need to be given attention. Rules of Cobek A (chicken and sambal) and Soup Iga menu which havea strong relation (green circle). A strong link between the two can be caused by consumers who make transactionslike Ribs based foods. Other rules, is Milkshake Chocolate and Nasi Ayam Goreng (fried chicken and rice, redcircle) has a strong relation because the combination of these two menus is usually purchased for children. Thesethree associative rules that have been mentioned are potential to be some promotions.Fig 7. Matrix Incidence Association Rules Adjustment 1 & 23.4 Menu ListThe results of menu grouping based on the market basket analysis make it easier to analyse which menu typesare most desirable for the restaurant’s consumers. The food menu with type Nasi and Cobek has the highest averagesales from the entire food menu. Menu with Nasi and Cobek type is an Indonesian menu, high average salesproportion for this type of food describes that the restaurant’s consumers like Indonesian menus. Ayam type menu,especially Ayam Goreng Nasi (fried chicken and rice) which is fried chicken is very popular with the restaurantconsumers, which shows that the restaurant’s consumers like chicken menu. Chicken type menus are generallyordered by consumers who bring children because children like this fast food.Chinese, Mie and Hotplate menus have a small proportion of sales. Chinese and Mie type menus are typicalChinese menus that has very low demand. It is very possible by the location of the restaurant where is domiciled in aregional mall of indigenous of Indonesian people. The menu Packet type that has been running at the restaurant hasalso not received a good response from consumers.All dishes are reviewed by sorting menus on each type. The restaurant focuses on considering total sales and rawmaterials used. Total sales are an important aspect of a restaurant's life which is can be an indicator what is the mostpopular menu. The higher total number of sales for each menu in the restaurant is expected to show the consumermenu interest. Menus with low total sales but having the same raw material as the menu with high total sales will bemaintained.3.5 Marketing Strategy Design (4P)The results of descriptive data analysis that has been done, are used as input to design the right marketingstrategy with 4P. The use of the 4P method focuses on satisfying customers and the restaurants. 4P itself analyses 4interdependent variables which include product, place, price, and promotion (4P). Understanding and using 4Pappropriately will be a key factor in achieving successful marketing targets such as profits. The following analysisuses the 4P method:
Author name / Procedia Computer Science 00 (2019) 000–00073.5.1ProductObservations made by the author while doing research, the restaurant uses too wide product category. Thiscondition known because promotional advertisements carried out by the restaurant (through display menu images, Xbanners placed in front of the restaurant and front of the cashier table) are menus with too varied food types such asChinese type and Hotplate type promotion at the same time. This condition underlies the writer to solve the problemwith the line extension product marketing strategy by starting to sort the menus to focus on categories from therestaurant. Both food and beverages the restaurant menus are eliminated based on the consideration of total sales andraw materials. Only some menu details that are retained, type, Grouping and considerations for maintaining by thecompany. The result of the deletion of the menu is 54 menus consisting of 37 food menus and 17 drinks menus.Mostly of the menus that still in the list are Nasi, Cobek and Ayam type of menus that is Indonesian cuisine. Themenu with Chinese and Noodle types was mostly removed because it generally had small total sales and was lessliked by the restaurant consumers. The remaining 54 menus will be used to focusing the restaurant products toIndonesian cuisine. The restaurant can be said to be an Indonesian restaurant, based on the results of sorting that hasbeen done.3.5.2PlaceThe restaurant located in one of the South Surabaya malls and still at the same place in the mall right now. Thelocation of the restaurant is enough strategic to distribute the products. Located right next to the parking entrance ofthe 1st floor car and motorbike, consumers who come can immediately see the restaurant at the right side. There is atraditional market located below the mall, a hypermarket that is located right beside the restaurant and a large retailstore on the same floor as the restaurant. These places are potential to bringing consumers, especially housewives.The second floor right in front of the escalator has a game centre that also has the potential to bring children'sconsumers. The location of the restaurant for the past one year has also been strengthened by the existence of a newhotel beside the mall. This hotel has a connected road to the mall right on the parking floor on the 1 st floor where therestaurant is located. The existence of this hotel can be an opportunity to channel promotions to hotel residents.Kartajaya explained that New Wave Culture [4] appeared in Indonesia. Young people, women, and netizens arebig contributors to the world of marketing, no longer parents, men and citizens. Young people find it easier to makea choice about a product they have just tried, while women are the decision makers of purchasing in the family.Women are a picture of future consumers who are more responsive to change. The progress of the internet alsomade it easier for citizens to become netizens who are very easy to recognize and understand the environmentquickly. Catching this new culture, the restaurant is expected to be able to use the internet as a media "location" forproduct distribution in addition to the current real location.3.5.3PriceThe price offered by the restaurant is lower compared to similar restaurants with good quality so that it can besaid that the strategy used by the restaurant is currently a good value strategy. The restaurant is superior in productprice, it is hoped that mid-low consumers are interested to come. Although the restaurant’s price is lower than pricesat other restaurants, some consumers state that the price offered is still expensive. Based on the same book writtenby Kartajaya [4], today's citizen has a high lifestyle. Living a high life doesn’t mean that the citizen has a higheconomy but refers to a luxurious lifestyle.The average price at the restaurant is Rp. 17,701.01 while other similar restaurants offer food with an average ofRp. 25,000 and above. Considering that mid-low-class consumers today are consumers who want to be having a"luxurious" lifestyle, consumers still demand a menu that looks luxurious and quality but at a low price. Knowingthis problem, the restaurant needs to do a promotion that gives discounts on certain packages or vouchers forpurchases to a certain extent so that consumers feel that they benefit from the price paid.3.5.4PromotionThrough observation and random questions to several consumers, the authors found that there were quite severalconsumers who had never known the restaurant before. Respondents who had known the restaurant, were mostlyknown because of the mall marketing promotion. This information can be concluded that the promotion run by therestaurant so far less known by customers.
8Author name / Procedia Computer Science 00 (2019) 000–0004. ConclusionThrough the results of the analysis found the consumer consumption pattern which mostly leads to the menuwith the type of food menu Nasi (rice), Ayam (chicken) and Cobek (chicken and sambal) which is Indonesian foodmenu. While the menu types of Mie and Chinese are almost not in demand by the restaurant consumers. Therestaurant consumers are also consumers who like to transact on weekends. High consumer transactions onweekends are possible because every weekend (Saturday and Sunday) at the mall seminars are held forentrepreneurs.Tahu (tofu) has a great appeal that shows, it is favorite snack menu at the restaurant. Capturing this conditionwas formed a promo by combining the Tahu with a drink menu that has a high profit margin. Other analysis resultsfound that other consumer consumption patterns that were seen through a strong attachment between the menu ofAyam Goreng Nasi (fried chicken and rice) and Chocolate Milkshake. This attachment shows that the restaurant hasconsumers who bring children and has never been realized by the restaurant before.Consumer consumption patterns will continue to change over time, therefore this pattern needs to be monitoredusing dashboards. The dashboard can be used as a tool for analyzing the restaurant executives to continuouslyreview menus, activities and promos that have a positive impact or not impact on profits. Through the dashboard,executives can easily make decisions to carry out promotions or activities based on the information displayed.References[1] Boardman, R., (2011), “101 Restaurant Secrets”, Lulu Pres Inc, Morrisville, 2011.[2] Chengqi, Z., (2002), “Association Rule Mining: Models and Algorithims”, Springer-Verlag, Heidelberg, 2002.[3] Han, J.,(2012) “Data Mining: Concept and Techniques”, third edition, Elsevier, Waltham, 2012.[4] Kartajaya, H., (2014) “WOW Marketing”, PT Gramedia Pustaka Utama, Jakarta, 2014.[5] Kotler, P., (1999), “Manajemen Pemasaran: Analisis, Perencanaan, Implementasi dan Pengendalian”, Jilid 1, sixth edition, Erlangga, Jakarta,1999.[6] Microsoft Corporation,(2014), “Power BI: Interactive Data Visualization BI Tools”, Microsoft Corporation, Albuquerque.[7] R Development Core Team, (2008) “R: A Language and Environment for Statistical Computing”, R Foundation for Statistical Computing,Vienna.[8] Vercellis, C., (2009) “Business Intelligence: Data Mining and Optimization for Decision Making”, John Wiley & Sons Ltd, West Sussex.[9] Anshari, M., et all., (2019), “Customer relationship management and big data enabled: Personalization &customization of services”, Applied Computing and Informatics 15, Page 94 – 101, Science Direct, 2019.[10] Sagin, Ayse N., Ayvas, B., (2018) “Determination of Association Rules with Market Basket Analysis: AnAplication in the Retail Sector”, Southeast Europe Journal of Soft Computing. Vol 7 No 1. March 2018.[11] Ting, P.H., Pan, S., Chou, S.S., (2010) “ Finding Ideal Menu Items Assortments: An Empirical Application ofMarket Basket Analysis”, Cornel Hospitality Quarterly 51, page 492 – 501, Sage Publication, 2010.[12] Ozdemir, B., Caliskan, O., (2014), “A Review of Literature on Restaurant Menu: Specifying the ManagerialIssue”, International Journal of Gastronomy and Food Science 2, page 3-13, 2014.[13] Weng, C.H., (2017), “ Revenue Prediction by Mining Frequent Itemset With Customer Analysis”, EngineeringApplications of Artificial Intelligence, Science Direct, 2017.
2.1 Business Intelligence Business intelligence is a set of techniques and tools to convert data into meaningful information for analyzing business by utilizing the use of technology and internet [8]. The purpose of implement business intelligence is to make it easier interpret human behavior such as transaction pattern. 2.2 Market Basket Analysis