Transcription
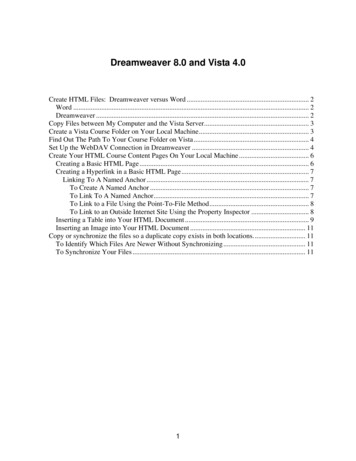
NAU Technical Design ReportFigure 1: Full Assembly1
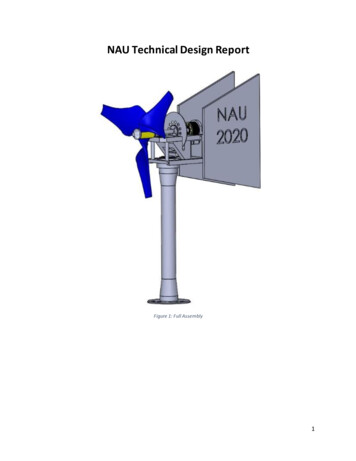
Figure 2: Turbine Electrical System2019-2020Student Authors: ME Team Lead: Lucas Duncan ldd55@nau.edu, EE Auxiliary Team Lead: CalumEikenberry cje223@nau.edu, EE DC-DC Convertor Team Lead: Nigel Grey ng474@nau.edu, EthanMalteverne epm49@nau.edu, Daniel Massaglia dm976@nau.edu, ME Aerodynamics Lead: MarinaMcCue marina mccue@nau.edu, Matt Mennell mlm636@nau.edu, ME Brake Design: Sean Vedenjfv32@nau.eduProject Sponsor: U.S. Department of Energy, National Renewable Energy Laboratory, GorePrinciple Investigator/Faculty Advisor: David WillyCo-Principle Investigator/Faculty Advisor: Dr. Venkata YaramasuCapstone Instructor: Dr. David Trevas, Dr. Kyle Winfree2
Table of ContentsList of Tables .4List of Figures .4Executive Summary (Sean) .51.Design Requirements (Ethan) .62.Static Performance Analysis (Marina) .73.Mechanical Loads Analysis .93.1.Blade Analysis (Marina) .93.2.Shaft Analysis (Matt) . 103.3.Brake Analysis (Sean) . 103.4.Nacelle Analysis (Daniel). 113.5.Tower Analysis (Daniel) . 124.Yaw System (Lucas & Marina) . 125.Electrical Analysis (Calum & Nigel) . 136.Software Description, System Control (Calum, Nigel) . 147.Testing Results . 157.1.Electrical Testing Procedure (Calum & Nigel) . 157.2.Mechanical Testing Procedure . 167.2.1.Blades & Hub (Lucas & Matt). 167.2.2.Tower/Baseplate/Nacelle (Daniel) . 167.2.3.Brake (Sean). 177.2.4.Yaw (Lucas, Marina & Matt) . 177.2.5.Shaft (Lucas, Marina & Matt) . 17Appendix. 183
List of TablesTable 1: Wind Turbine Blade Geometry.7Table 2: Mechanical Component Factor of Safety (FOS) .9Table 3: Runaway Wind Speeds and Braking System Factor of Safety . 11List of FiguresFigure 1: Full Assembly.1Figure 2: Turbine Electrical System .2Figure 3: Full Assembly.7Figure 4: Coefficient of Power versus Tip Speed Ratio .8Figure 5: Aerodynamic Power Curve .8Figure 6: Annual Energy Production .9Figure 7: Wind Turbine Blade Finite Element Analysis . 10Figure 8: Shaft . 10Figure 9: Brake Assembly . 11Figure 10 : Yaw . 12Figure 11: Greater-than-one-line Diagram. 13Figure 12: Printed Circuit Board . 13Figure 13: PI-Controlled Synchronous Boost Converter Schematic . 14Figure 14: PI-Controller Arduino Program. 14Figure 15: Control Module Flowcharts . 15Figure 16: Rotor Strength Test Enclosure. 16Figure 17: Blades in Enclosure . 16Figure 18: Actuator Slider Testing . 17Figure 19: Shaft Stress Analysis. 18Figure 20: Shaft . 18Figure 21: Shaft Von Mises Stress . 184
Executive Summary (Sean)The Northern Arizona University (NAU) Collegiate Wind Competition (CWC) 2020 turbine team completeda design for a small-scale wind turbine. The turbine is a three-blade design with a passive yaw, dynamicand mechanical braking, and a closed-loop controlled synchronous boost converter electrical subsystem.The parts used in this turbine were either commercially available or manufactured by the team. The designteam was split into three: one mechanical engineering team and two electrical engineering teams. Themechanical engineering team was tasked with designing the aerodynamic, structural, and mechanicalparts of the turbine. The electrical DC-DC converter team was tasked with the design and simulation ofthe converter topology. The electrical auxiliary team was tasked with converting the DC-DC team’s designinto a printed circuit board (PCB) and complimenting it with low forward-voltage component selections.To aid in the design process, the team used computer programs such as MATLAB, QBlade, Arduino IDE,and SolidWorks. Once the parts were designed, testing was completed to ensure the design worked asexpected. The testing procedures are described within this document.5
1. Design Requirements (Ethan)Design Requirements: High efficiencyHigh electrical generationLow cogSimple assemblyLow cut-in speedCompactLightweightAesthetically pleasingSub-teams were broken into categories corresponding to subsystems with two or more people on eachsub-team. The tower and nacelle components were developed by Daniel and Matt, while aerodynamicssuch as yaw and blades were handled by Marina and Lucas, finally Sean and Ethan were on the brakingsub-team with cross-team collaboration on all systems in the developing of the following.Two primary objectives from which most design priorities branched from: performance, and aesthetics. Atwo-shelf nacelle design was utilized, while prioritizing weight distribution. All nonessential componentswere moved down tower with the goal of weight reduction and promoting an increase in yaw influence.Within our drivetrain we wanted our startup wind speed to be significantly lower, this meant we neededa more aggressive blade, paired with the least amount of resistive torque from both the motor, and anyaxial supports. Designing components optimized for minimal cogging torque, maximum startup torque,power generation specs, and a minimized plateau effect from higher wind speeds was the priority.Our brake system would need to be exponentially more effective than previous models due to therunaway test. The team produced a reverse mounted drop-down brake system that allowed the brakedisk to intrude into the lower nacelle cabin area, ultimately solving this performance issue.Throughout this project appropriate mounting and dimensioning was found to be one of the mostcrucial aspects of development. With our extremely compact design most components foundthemselves within 3mm of each other. This constraint pushed us to develop the multipurpose railsystem implemented into the upper nacelle plate. This system utilizes the limited space of the nacelleand maintains assembly simplicity and reducing required hardware.6
Figure 3: Full Assembly2. Static Performance Analysis (Marina)The wind turbine blades were first designed using MATLAB, analyzed and modified using QBlade, and thencreated using SolidWorks. The MATLAB code assumed an ideal rotor with wake rotation and acceptsdesign tip speed ratio, angle of attack, rotor radius, number of blades, and number of blade elements asinputs to calculate angle of relative wind, chord length, and twist angle. This information, along with aselected airfoil, were inputted into QBlade and the power performance was analyzed. Chord length andtwist angle were exaggerated, and different airfoils were analyzed until desirable characteristics wereachieved. The final blade geometry is located below in Table 1, with a design tip speed ratio of 1.5 withan associated coefficient of power of around 0.3. Figure 4 displays the coefficient of power versus tipspeed ratio for angular velocities ranging from 0 to 3500 RPM and Figure 5 displays the wind turbineaerodynamic power curve.Table 1: Wind Turbine Blade GeometryLocal Rotor Radius (cm)Chord Length (cm)Twist Angle .70.620.63.407
Figure 4: Coefficient of Power versus Tip Speed RatioFigure 5: Aerodynamic Power CurveAs seen from Figure 5, the wind turbine cuts-in at 2.0 meters per second and produces a rated power of30 Watts at 11 meters per second. Using this estimated power production and a Rayleigh probabilitydistribution, the annual energy production was calculated and is shown in Figure 6, assuming the windturbine operates 50% of the time.8
Figure 6: Annual Energy Production3. Mechanical Loads AnalysisTable 2: Mechanical Component Factor of Safety (FOS)SystemBladesMaterial(s)PolycarbonateLoad DescriptionThrust,CentrifugalLoads Applied𝑇 17.0 𝑁𝛺 4341 𝑅𝑃𝑀Minimum FOS2.743.1. Blade Analysis (Marina)The final wind turbine blade finite element analysis was conducted using SolidWorks, shown below inFigure 7. The centrifugal load was determined from the runaway rotor speed, which was calculated usingthe tip speed ratio where the coefficient of power is zero (see the red dot from Figure 4), rotor radius, andmaximum wind speed. The thrust force was calculated using air density for standard atmosphericconditions, area of the rotor plane, maximum wind speed, and axial induction factor, assuming an idealrotor without wake rotation.9
Figure 7: Wind Turbine Blade Finite Element Analysis3.2. Shaft Analysis (Matt)Shaft design relies on dimensions such as length and cross-sectional areas as well as the maximumcentripetal forces experienced. These forces can be determined by the startup torque and during braking.The chosen design includes a short section of the shaft which is has a larger diameter and milled to havea key shape in order to lock the disc in rotation. One end of the shaft is attached to a coupler to the motorshaft. The other end of the shaft is turned down over two inches with an inch of threads cut out. Thisallows the hub to slide onto the shaft and lock rotation when the hub nose screws on to clamp the hub inplace. The shaft is locked in place through the motor mount while support for the weight of the hub andblades on one end and reduced friction is helped with the use of a pillow block bearing mounted to thetop nacelle. Due to incompletion of manufacturing of final shaft no physical testing was taken.Figure 8: Shaft3.3. Brake Analysis (Sean)10
Figure 9: Brake AssemblyFigure 9 above shows the brake assembly with-in the upper level nacelle plate and provides a label ofparts shown. The slider and the rail system used is made of polycarbonate and is 3D printed. The brakingslider and stopper behind the disk have a slot where a brake pad is pressed into each. The braking slideris fastened to the linear actuator to clamp the brake disk when the actuator is extended. The linearactuator shown is controlled using an Arduino microcontroller and a linear actuator control board. Thecontrol board allowed for less coding and allows for fine tuning of the actuator speed and stroke length.Based on analysis of the blades, the torque that must be overcome to stop the rotation of the blades isshown in Table 3 below. This table outlines the torque produced by the blades at runaway wind speedsand the factor of safety the braking system.Table 3: Runaway Wind Speeds and Braking System Factor of SafetyWind Speed [m/s]182225Torque of Blades [N-m]2.545Factor of Safety21.351.08The brake disk is 67.5 mm in radius and the linear actuator produces 80 Newtons which means the torqueof the braking system is 5.4 N-m. This design can stop the turbine with the use of a push button and withspeed sensors that actuate the braking system when runaway wind speeds are sensed.3.4. Nacelle Analysis (Daniel)The nacelle is comprised of two sections including a lower and upper plate. The lower plate, made ofpolycarbonate printed at the NAU Rapid Lab, lets wiring from the generator and brake assembly run downthe tower while not binding when the turbine experiences wind change. The upper nacelle plate is alsoproduced from the Rapid Lab using polycarbonate. It is made up of two sections that bolt to the bottomplate which are both designed to fasten the nacelle cover and yaw in place .The top nacelle plate serves multiple purposes. Starting with the bottom of the top plate, an actuator forthe brake is mounted to linearly push a brake pad against the brake rotor housed on the top of the plate.Moving to the upper face, a single pillow block with a pressed bearing give support to the drive shaft. Inaddition to this block the other support for the main shaft is the generator itself where the shaft ends.11
The generator mounts to the upper nacelle plate as well. The most important part of this portion of theturbine is making sure that the clearance for the brake and shaft do not hit anything.3.5. Tower Analysis (Daniel)Using steel tube stock, the tower of the turbine was designed on SolidWorks and used in a stress anddisplacement analysis. Because the team wanted to be able to trim the tube stock to a desired shape, a2-inch outer diameter with a half inch wall thickness. It is important to make sure that the trimmed towercould withstand the forces it would experience in the wind tunnel. Shown in Error! Reference source notfound. in the Appendix, the von Mises stress distribution across the tower is shown. The importance ofthese stresses shows where a part can failure due to fatigue or yielding. Using mild steel, the amount ofstress that the tower is miniscule in respect to what it would take to yield the steel. Computing a factor ofsafety of over 30, the towers wall thickness could be decreased from 1/8th of an inch to 1/16th of an inchand still have a large factor of safety.4. Yaw System (Lucas & Marina)The Yaw of the turbine helps keep the nacelle perpendicular to air flow as it sits on a ball bearing. Thisdesign utilizes two tails to increase the surface area which decreases the amount of force needed to holdthe nacelle in an ideal position. Attached rails with set screws secure the yaw to the nacelle.Figure 10 : Yaw12
5. Electrical Analysis (Calum & Nigel)Figure 11: Greater-than-one-line DiagramThe electrical analysis and sub-system design processes were delegated to two sub-teams: the DC-DCteam and the Auxiliary team.The DC-DC team primarily worked to design, simulate, and build a three-stage boost convertor systemthat utilized a synchronous boost converter topology (two complementary MOSEFTs) in place of astandard MOSFET and diode combination (see Figure 13). The goal of the design was to maximize powergeneration at low wind speeds, while minimizing the total voltage drop of the system (see Figure 11).The Auxiliary team worked in parallel with the DC-DC teamto optimize all electrical components (i.e. rectifier, auxiliarycomponent wiring, generator) to best complement the lowcut-in design and synchronous topology. In addition, theAuxiliary team spearheaded the printed circuit board (PCB)design and construction (see Figure 12), which integratedthe entire power/control system from Figure 11 into onecircuit.Altium Designer was utilized by the Auxiliary team to createa 6” by 6”, single-sided PCB (see Figure 12) with all discretecomponents mounted to it (excluding braking chopperchassis mount resistor and packaged boost convertor forFigure 12: Printed Circuit Boardinitial microcontroller power source). The design of this PCBincluded LEDs to allow visual verification that each stage(rectifier, first boost converter, second boost converter) was on, flush-mounted spacing for the Arduino13
Mega, additional footprints for parallel capacitors for quick changes in signal rectification after eachconvertor, and the maximum separation of control components/routing from power components/routingas to minimize signal interference. The control components lay along the bottom-left of the board andthe power components across the top-right to center-right.Figure 13: PI-Controlled Synchronous Boost Converter SchematicThe intended load attached at the end of the schematic diagram (see Figure 11) was to be a fixedresistance load with a 300W power rating and 10 Ohm resistance. Upon further testing the team wouldhome in on the optimal resistance/power rating.6. Software Description, System Control (Calum, Nigel)MATLAB Simulink was used for circuit and closed-loop control simulations (see Figure 13). Simulink alsoallowed for a block-programming style that easily modularized the numerous electrical and mechanicalturbine control algorithms and allowed a direct export to the Arduino Mega microcontroller (see Figure14).Figure 14: PI-Controller Arduino ProgramAll control modules (see Figure 15), were to be modeled within the Simulink environment and thenexported directly to the microcontroller (same style of programming implemented in Figure 14) to reducetiming complications and optimize the controller’s multithreading capability.Control Module Descriptions:1. Dump-Load Circuit: when an overspeed event occurs, route the rectified signal through anexternal resistor to ground via the “Chopper Circuit” in Figure 11. This control module is activeonly during the “Durability Task Power Dump” region (see Figure 5).2. Phase 1-2 Voltage Measurement: calculate the turbine rpm via phase 1 and 2 x-axis crossingpoint difference. This module occurs as soon as the microcontroller is powered on as to detectthe point in time to trigger the system brake for the “Initiate Brake” region (see Figure 5).14
3. PI Controller: utilizes proportional integral calculation to control second stage boost converterduty-cycle.4. Current Sensor Measurement: used to detect and signal if load is disconnected. This module isactive as soon as the “System Cut-In Region” is reached and detects the “Disconnect from Load”region (see Figure 5).5. Stage 2, 3, & 4 Voltage Measurements: voltage divider circuits used to detect electrical potentialat each key stage; trigger LEDs to provide visual feedback. This is also utilized to detect the“Disconnect from Load” region (see Figure 5).6. Actuator Signal: provides PWM signal for mechanical braking control and is utilized during the“Initiate Brake” region (see Figure 5).Figure 15: Control Module Flowcharts7. Testing Results7.1. Electrical Testing Procedure (Calum & Nigel)Testing and power quality measurements of the PCB with all soldered components was to take placeimmediately after receiving of the PCB from the manufacturer if the project were able to continue. LEDswere integrated after each stage of conversion within the circuit to provide visual feedback to the tester,and an oscilloscope would be used to provide exact measurements per the CWC2020 rules andrequirements. The design (see Figure 11) featured the ability to change the capacitance values to decreasenoise and increase signal integrity. Due to the modular capacitance and closed-loop control, additional15
filtering techniques would not likely be needed. The generator output would be tracked with the use of adynamometer throughout this testing.7.2. Mechanical Testing ProcedureThe testing procedures for the turbine have come to a stop, but in the following sections each majorsub-system testing procedures that have been done will be discussed. The findings during these testswill be gone over and how it aided in the team’s design decisions. Also discussed below is the testingprocedures that would have taken place if the times would allow.7.2.1. Blades & Hub (Lucas & Matt)The blades and hub subsystem were tested early during the semester. Members of the team assembleda safety container out of wood and Plexiglass. With the expectancy of the blades sheering the box wasbuilt with a high factor of safety. Attached to the back of the box was a rail system which fastened amotor in place to turn a shaft up to 3300 rpm. The box is equipped with two self-aligning flange bearingswhich helped smooth un-concentric rotation. The rotor testing taken concluded with two sets of brokenblades which had different density values. We found that the area where the blades formed into a keyfor the hub was the weakest point. This led to redesign of the hub and blades to fix the failure point.Figure 16: Rotor Strength Test EnclosureFigure 17: Blades in Enclosure7.2.2. Tower/Baseplate/Nacelle (Daniel)Failure these sections of the turbine can cause catastrophic failure while the turbine is in operation.Failures could include the tower disconnecting from the baseplate or the nacelle. Since this system is anexpensive portion of the project to obtain the final materials, online simulations play a big role in theresearch of this system. Shown above in section 3.6, the tower analysis gave reassurance that a finalwelded tower and baseplate system could withstand possible forces up to ten times the amount of yield16
stress that it would take. Once the tower and baseplate are manufactured, doing mounted car testing forthe turbine would test if the math behind the design was correct. It would be hard to know what forces itexperienced due to not having a strain gauge or anything to measure the forces experienced.7.2.3. Brake (Sean)The braking system for the turbine was one aspect of theassembly that was behind schedule. Due to this, thetesting of the sub-system was not completed before theproject was halted. The Arduino code and circuit werebuilt, and the actuator was able to be controlled with theuse of a push button (See Figure 18). The plan was toanalyze the braking sub-system through physical testing,using an apparatus made to simulate the loads producedby the blades of the turbine. Through this testing, thematerial of the brake pads and the proper stroke andspeed of the linear actuator would have been chosen.Since the factor of safety for the braking system is belowthe industry standard of 2 at max runaway speed of25m/s, the braking system would need to be actuatedduring the ramp up phase at 18 m/s. This would requirefurther testing to ensure that the sensing system used inthe design could detect wind speeds of 18 m/s andactuate the actuator promptly.Figure 18: Actuator Slider Testing7.2.4. Yaw (Lucas, Marina & Matt)The yaw system was another subsystem that was put on the back burner while other subsystem was beingcompleted. The plan was to 3D print the Yaw for the final assembly after spring break. Yaw would betested via car testing with the final assembly. The team made a mount to attach to roof rack that wouldsecure the turbine to car. The team would force the turbine to rotate through turns and high wind speeds.The teams most concern was making sure yaw’s rail system did not shear. The team would experimentwith different 3D print fills and try to test for shear points and fatigue life.7.2.5. Shaft (Lucas, Marina & Matt)The shaft subsystem testing was on hold until the brake system was completed. The teams mainconcerned was shearing while braking the turbine. The shaft would be tested via caring testing. Theteam would stop the turbine at various wind speeds and applied brake forces. It was determinedthrough blade tests our shaft and the startup torque of the motor in use.17
AppendixFigure 21: Shaft Von Mises StressFigure 19: Shaft Stress AnalysisFigure 20: Shaft18
19
The Northern Arizona University (NAU) Collegiate Wind Competition (CWC) 2020 turbine team completed a design for a small-scale wind turbine. The turbine is a three-blade design with a passive yaw, dynamic and mechanical braking, and a closed-loop controlled synchronous boost converter electrical subsystem.