Transcription
NAU Energy DashboardTechnological Feasibility AnalysisTeam: Save WattNovember 9, 2018Sponsored by:Jonathan Heitzinger & Dr. Truong NgheimFaculty Mentor:Isaac ShafferTeam members:Madison Boman, Hyungi Choi,Ian Dale, Brandon Thomas
Technological Feasibility AnalysisNAU Energy Dashboard‣ IntroductionPage 3‣ Section 1: Technological Challenges‣ Section 2: Technology AnalysisPage 4‣ Section 3: Technology Integration‣ Analysis ConclusionPage 13Team: Save WattNovember 9, 2018Page 6Page 162
Technological Feasibility AnalysisNAU Energy DashboardIntroductionProject DescriptionFor the last several years, Northern Arizona University (NAU) has been collecting a trove ofraw data related to the operation and energy consumption of its buildings. Until now, NAUhas not had a proper tool to display and analyze the data efficiently. Current methods arecumbersome, time consuming, and require a great deal of technical expertise. There arecurrently three major issues with their business process:‣‣‣An interface which combines historical and live data does not existA graphical representation of data (Charts, Graphs, etc.) does not existAn intuitive way to export data into a mutable file type does not existIn searching for a solution, Jon Heitzinger and Truong Nghiem have commissioned ourteam, Save Watt, to build the NAU Energy Dashboard. The NAU Energy Dashboard is acomprehensive web-based application which is able to retrieve, graphically display, export,and run basic analytics on NAU’s collected data. If successful, this software will have ahuge impact on campus operation, leading to significant improvements in energy usage,cost reduction, waste minimization, campus sustainability, and research. Not only will thedashboard make the existing NAU building data useful, it will also aid NAU Facility Servicesin monitoring, understanding, and making well-informed decisions regarding energyefficiency. In the following sections, we will be discussing the feasibility of several aspectsof this project and what challenges we predict in this early stage of development.Document OutlineThe goal of this document is to analyze the feasibility of each of the major design aspectsof our envisioned solution. This analysis will serve as the basis of our design decisionsmoving forward and is an early idea of our design rational. We will explore our analysis inthe following three sections.In section 1, we will outline the major technological needs and challenges we foreseeencountering. Here we will describe the rationale behind each requirement and give a briefinsight into where the challenges may lie. In section 2, we will discuss each challenge,introduce various solutions, and prove the feasibility of our chosen solution by discussingour research. Finally, in section 3, we will combine the solutions proposed in section 2 intoan integrated solution. Our cohesive solution will be depicted and discussed by way of asystem diagram. We will close our document with a brief overview of our findings.Team: Save WattNovember 9, 20183
Technological Feasibility AnalysisNAU Energy DashboardSection 1: Technological ChallengesIntroductionHere we will introduce the major requirements of the NAU Energy Dashboard and brieflydiscuss the challenges associated with each requirement. We will do this by first listingeach of the requirements and secondly exploring the rationale behind each requirementand listing the major challenges we foresee. These challenges will be further analyzed inSection 2.1.1 Technical RequirementsAs we have met with our sponsors, we have collected a series of requirements that willform the basis of our system. We have selected five major requirements to discuss in thisdocument. These requirements are listed below:‣ Retrieve historical data‣ Retrieve live data‣ Clean Data and Perform Statistical Analysis‣ Present Data GraphicallyImplementing these requirements is the basis of our project. Our energy dashboard willneed to efficiently and effectively perform each of these tasks in a way that is satisfactoryto our sponsors. In the future, we will discuss the metrics by which each of theserequirements will be measured (see Requirements Specification Document). For thepurposes of this document, we will simply be evaluating whether or not each requirementis feasible and how we plan to demonstrate feasibility. In the following subsections, we willdiscuss the rationale and challenges behind each of these requirements.1.2 Retrieving Historical DataOur clients’ business process begins with data retrieval. Historical data, in the form oftrend-logs, is currently stored in a large SQL database. Although there is a wealth ofinformation to be gathered from this data, the data stored here is disorganized,inconsistent, and error prone. High level skills in SQL are required to manipulate andextract any information from the data. Our system must be able to query this data in a waythat is intuitive to the average user. The major challenge here will be finding a tool that ispowerful enough to search through this large database, is flexible enough to supportNAU’s growth, and is compatible with NAU’s current architecture.Team: Save WattNovember 9, 20184
Technological Feasibility AnalysisNAU Energy Dashboard1.3 Retrieving Live DataThis second requirement is much like the first. Along with historical data, we will need toretrieve live data from building sensors. This process involves sending requests to thesensors via the appropriate protocol. The challenges here lie in granting access to oursystem and finding a tool which can communicate with the building servers. Thistechnology is older and not uniformly configured, so we will need to use specializedlanguages and/or frameworks to retrieve this data.1.4 Presenting Graphical DataHere we are focusing strictly on technology that will graph and chart the data we will beretrieving. Navigation, user experience, and design aesthetics of our web application is notforeseen as a major challenge. Our sponsors would like to be able to represent trends inthe form of time series graphs, histograms, and comparative line graphs. The majorchallenge here is finding a tool that is able to handle large amounts of data, and is able topresent it interactively.1.5 Cleaning Data and Performing Statistical AnalysisThe final major requirement is cleaning the data and facilitating internal analysis as well asexternal analysis. This entails accounting for missing data points, mitigating errors, andlogically aligning the data. After cleaning the data, our sponsors would like for thedashboard to run minor statistical tests. These tests may include correlations, five pointsummaries, and regressions. Our sponsors would also like to easily search for data, exportit, and use outside tools to perform analysis. The major challenge here is finding a tool fitfor data handling and statistical analysis.1.6 ConclusionNow that we have introduced the requirements and associated challenges, we can beginour analysis of possible solutions. In the following section, Section 2, we will discuss thetools and methods we will implement in our overall solution.Team: Save WattNovember 9, 20185
Technological Feasibility AnalysisNAU Energy DashboardSection 2: Technology AnalysisIntroductionIn this section we will discuss possible solutions to the challenges introduced in theprevious section. We will discuss the methods and reasoning behind our approach to eachsolution. To reiterate, our challenges are the following:‣ Retrieve historical data‣ Retrieve live data‣ Clean Data and Perform Statistical Analysis‣ Present Data GraphicallyNext, we will explore our proposed solutions to the listed challenges.2.1 Retrieving Historical DataRetrieving historical data is key to providing a comprehensive view of NAU’s energyconsumption. Our system must be able to query this data and use it for analysis. A majorchallenge associated with this will be running real-time queries to this database whenperforming searches for information. Our sponsors would like to search for specific datasets using familiar keywords and domain-level nomenclature. In order to do this, we willneed to use a tool compatible with both SQL and the rest of our system. After comparingseveral database technologies, we narrowed the decision down to two alternativesAlternatives‣ PYODBCPyodbc is an open source Python module that makes accessing databasessimple. This module implements Python’s database API 2.0 in a way that iseasy to use with knowledge of Python. It can connect with various databasesincluding Microsoft SQL.‣PYMSSQLPymssql is a simple database interface compatible with Microsoft SQL. Thispackage is very specific to Microsoft SQL, so it is not compatible to any otherdatabase technology. This fact will limit our dashboard in the event that NAUmigrates to another technology.Team: Save WattNovember 9, 20186
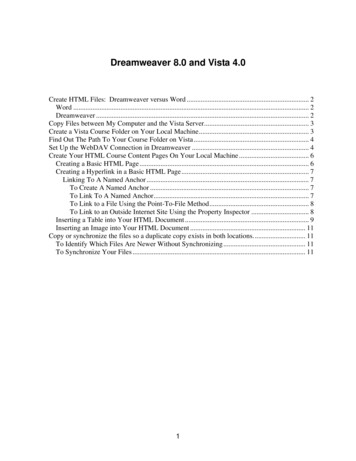
Technological Feasibility AnalysisPackageNAU Energy DashboardSupport for Microsoft SQLpyodbcxpymssqlxFlexible SupportxMaintainabilityxxFigure 1. Shows an evaluation of both pyodbc and pymssql based on relevant features.Chosen approachFigure 1 shows a comparison between pyodbc and pymssql. Using these metricswe were able to select a tool for our system. Our chosen tool for retrievinghistorical data is pyodbc. This option provides the simplest way to connect to thedatabase within our system. Pyodbc will also allow for our dashboard to continueto grow with NAU’s needs.Proving FeasibilityTo prove feasibility, we implemented a test environment with a custom SQLdatabase. In this test environment, we were able to select, update, import, andexport data. At the moment connecting to the database requires windowsauthentication from a campus computer. We are not able to connect using a VPN.In order for our code to work is must be run in a remote desktop. We are unable todownload new python packages on a remote desktop without administrativeaccess. We know that this tool is compatible with a similar database, but lack theauthority to connect the the provided database.2.2 Retrieving Live DataAll of NAU’s building operation data is retrieved via meters which can be called uponperiodically to report the current status of any given utility. Each building has dozens ofsensors which are controlled by central building controllers. These building controllers areessentially servers which make requests to the individual sensor IP addresses. Thechallenge here lies in getting authorization to access these IP addresses and implementingthe proper protocol for our system to communicate with the building controllers.Team: Save WattNovember 9, 20187
Technological Feasibility AnalysisNAU Energy DashboardAlternatives‣ Niagara AXNiagara AX is the native language of the building controllers. In order to retrievelive data we will have to encounter this language in some way. The benefits ofusing this language solely is that our system will be completely in tune with thebuilding controllers. Maintenance will be easy, assuming technicians who arefamiliar with he building controllers are also familiar with Niagara AX. Althoughmaintenance and compatibility are high priorities, these are all that Niagara hasto offer. This language does not work intuitively with any other language wehave researched and does not offer any other tools. Familiarity is a key factorhere as well. We are not familiar with this language at all, so the learning curvefor our team will be extremely challenging. Overall, we would like to minimizeour use of this language.‣DGLUXDGLUX is a framework used to build energy dashboards. This framework hasbeen used to build an older iteration of a dashboard at NAU. DGLUX provides abuilt in way to communicate with building controllers running on Niagara AX.DGLUX is also compatible with Javascript in the form of a widget. This tool isalready designed for the construction of a web-based energy dashboard, so itmay fit perfectly in our needs. We also have a sample implementation where wecan base some of our work. This sample will allow for a better basis to learnhow to use the framework. The only drawbacks of working with DGLUX arethat the framework seems a bit outdated, and the widget for javascript is verylimited in its functionality. In order for this tool to work we will have to makesome adjustments.Chosen ApproachThe tool that will best suit our system is DGLUX. Niagara AX on its own is notrobust enough to be compatible with the rest of our system in a way that isintuitive. Using this language on its own would require extensive learning andunorthodox methods to force compatibility. DGLUX is more viable, although itcomes with its own challenges. It is proven to have worked in the past and offerstools for compatibility between our system and the building controllers. We willneed to invest more time in building modules to improve DGLUX, but, despite theneed for extra customization, it seems to be the best tool for the job.Team: Save WattNovember 9, 20188
Technological Feasibility AnalysisNAU Energy DashboardProving FeasibilityWe know this approach is feasible, because it has been done in the past. We havebeen using the files from the previous iteration of the dashboard to decode thefunctionality of DGLUX. We have not been able to run any tests, because thebuilding controllers are heavily guarded by NAU ITS. We are currently in theprocess of gaining access and meeting with individuals in ITS that may have moreinformation than our clients.2.3 Cleaning Data and Performing Statistical AnalysisOur sponsors would like for the dashboard to run minor statistical tests for them. Theywould like to be able to perform commonly used analyses automatically in order to savetime and energy for larger analyses. In the past, attempts at statistical analysis haveresulted in errors which rendered the data useless. We will need a tool that can accuratelyrun the desired tests, account for data anomalies, pass the results to our presentingmodule, and export the data to a desirable file type such as CSV. The tools we areconsidering are Python packages, numpy and pandas.Alternatives‣ NUMPYNumpy is a general purpose array-processing package. Numpy offers manybeneficial tools such as linear algebra calculations, transformations, andrandom number generators. These tools make it powerful enough to runnumerical analysis on the data we gather. Numpy is very powerful, butintegration with other technologies is cumbersome. Integration requires is C/C and Fortran code. These barriers to integration make this tool very difficult toinclude in our system.‣PANDASPandas offers many data structures and operations for manipulating numericaltables and time series. These tools will allow us to align data points, sort datawithin our own structures, and account for missing data. It includes many of thesame tools for numerical analysis as numpy, but is better suited to integratewith web-based technologies. Analyses performed with Pandas is easilycompatible with SQL, Javascript, and R. This compatibility is an enormousbenefit as it allows us and our clients to use familiar tools when working withthe data.Team: Save WattNovember 9, 20189
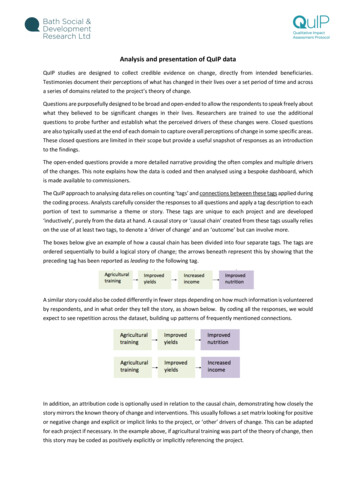
Technological Feasibility AnalysisNAU Energy DashboardPackageIntegration?FeaturesNumpyC/C , Fortran,PythonArray processed packaging, Linear algebra calculations, transformations, andrandom number generations.PandasJavascript, SQL, R,etc.Many datastructures, many operations for data manipulation on numerical tablesand time series, data alignment, NA friendly stats, and similar features to SQLcallsFigure 2. Shows an evaluation of both numpy and Pandas based on relevant features.Chosen ApproachFigure 2 compares the features of numpy and Pandas. After comparing the two,the only advantage numpy has is the ability to use linear algebra for analysis.Despite this, we have chosen to use pandas as the technology for our statisticalanalysis. Numpy alone is a powerful tool, similar to using technologies as MATLAB,but does not allow for straightforward integration. Pandas will allow us to createrich time series functionality for sorting logs, data alignment for our datacomparisons, NA-friendly statistics for instances were data may be missing, datagroupings, merging, and joining methods.Proving FeasibilityTo ensure that pandas will work, we tested this library alongside our chosengraphical interface in order to ensure compatibility. Since our historical data will bepulled from an SQL database, we were able to pull data and work with it usingpandas. The next phase here is to develop a set of analyses tests alongside ourclient that would best fit their business process.2.4 Presenting Data GraphicallyPresenting interactive graphical data is the main result our sponsors would like to see. Thisproject is driven by the need for a graphical user interface that abstracts away thetechnical details and focuses on the data. A major challenge here is choosing a tooloptimized for reading and presenting large amounts of data. There are three alternativesthat we are exploring: matplotlib, Charts.js, and amCharts. We will discuss the benefitsand drawbacks of each in the following subsections.Team: Save WattNovember 9, 201810
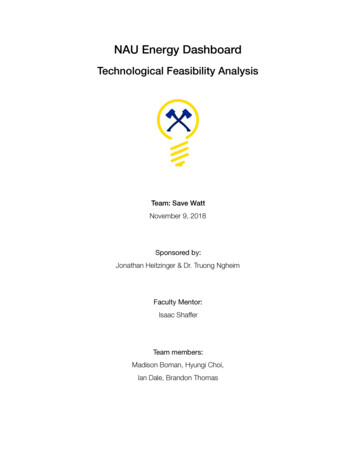
Technological Feasibility AnalysisLanguage/PackageNAU Energy DashboardGraphical .JAVASCRIPTamChartsHover data descriptions, Vertical linefor pinpointing data points.Multilayered graphs. Graph colorcustomization.JAVASCRIPTCharts.jsHover data descriptions, Horizontalline for pinpointing data points.Multilayered graphs. Graph colorcustomization. Animations on loadFigure 3. Shows an evaluation of matplotlib, amCharts, and charts.js.AlternativesPython Django offers graphing tools such as Matplotlib/Seaborn to bettergraphically present the data. On the other hand, Javascript has two options,amCharts and, Charts.js. Matplotlib/Seaborn would be suitable to use becausethey interact well with Python. However, the graphs are mediocre whenconsidering a modern graphical interface. Figure 3 shows a comparison ofgraphics between each of the alternatives and describes some of their features.We can see from Figure 3 that Chart.js provides a rich and descriptive view of thedata it is given.Team: Save WattNovember 9, 201811
Technological Feasibility AnalysisNAU Energy DashboardChosen ApproachThe approach we have chosen is Charts.js. Matplotlib/Seaborn cannot competewith Charts.js because it is not as appealing nor does it allow for any animations.We chose Charts.js over amCharts because Charts.js includes the animations onload. This is helpful when providing engaging animation from the very beginning forour users. With Charts.js we are able to hover over data points to reveal in depthinformation in a clean and intuitive way. AmCharts did include a similar feature, butimplementation is messy and unappealing. The clients have also shown us variouswebsites that use Charts.js and have expressed a desire for a similar design.Overall, Charts.js provides the compatibility and design aspects that best fit oursystem.Proving FeasibilityTo choose the best approach to graphically represent the data, we downloadednumerous examples from the their websites to run and, test with in our ownenvironment. Using Javascript’s Charts.js will work with our system as a wholeseeing as there are numerous instances that Chart.js has been used to displaydata from Python’s pandas that we will be using on our data. We were able to useour own environment to create a set of test values in Pandas and pass them toCharts.js. The scripts we used to modify our data are straightforward. They simplyrequire a file to pass several values and allow for flexible theme changing.2.5 ConclusionNow that we have introduced the solutions to the major challenges of our system, we willdiscuss the system as a whole. In the next section, we will map the system in terms of itsmodules and discuss how each of our solutions will come together a
team, Save Watt, to build the NAU Energy Dashboard. The NAU Energy Dashboard is a comprehensive web-based application which is able to retrieve, graphically display, export, and run basic analytics on NAU’s