Transcription
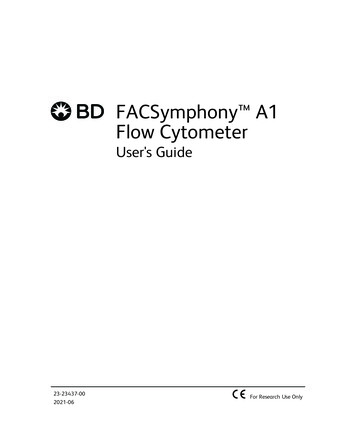
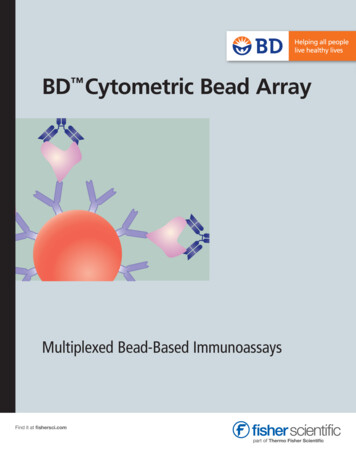
Electronic Supplementary Material (ESI) for Environmental Science: Water Research & Technology.This journal is The Royal Society of Chemistry 20201 Flow cytometer comparisonTwo flow cytometers were used for these sampling campaigns, an Accuri C6 flow cytometer(Accuri; BD Biosciences, San Jose, CA) and a BD FACSCanto cell analyzer (Canto; BDBiosciences, San Jose, CA). DWDS F is the only location for which the Canto was usedbecause the Accuri broke down during field sampling (the supplemental data files include whichcytometer was used to produce which data point). Once the Accuri was repaired and returned, acomparison experiment was completed. For both cytometers, we started with the publiclyavailable gate developed by researchers at the Swiss Federal Institute of Aquatic Science andTechnology (Eawag gate; 38) and then results from Sperotech nano fluorescent size standardkit (Spherotech, Catalog #NFPPS-52-4K) were used to adjust the gate for the Canto (adjustedgate; Figure S6).The Spherotech beads were all at a concentration of 1x10 6 beads per mL. TheAccuri was able to quantify the larger beads with under 10% error (Table S6). The Canto withadjusted gate was most accurate for the largest bead (less than 1% error), but still had an errorof 18.5% for the 0.88 µm beads, which improved from the standard error with the Eawag gate,25.5%.The beads that were 0.22 µm and 0.45 µm were not accurately quantified by either cytometer(Table S6), but the small beads were detected outside of the gate by the Accuri and not by theCanto. This result might be evidence that the Accuri has a lower limit of quantificaiton than theCanto (Figure S6), and the quantification limit was not determined specifically for the Canto.However, the Eawag method we use recommends working with cell counts of 10 2-107 cells permL (38). If the detection limit for samples taken with the Canto was 102 cells per mL for bothtotal cell counts and intact cell counts instead of the limits of 12 and 22 cells per mL respectivelydetermined by Miller et al. with the Accuri (40), nothing would be impacted because the lowestCanto total cell count datapoint is 350 cells per mL and that of intact cell count is 304 cells permL.Bottled Evian water was used to verify that adjusting the Eawag gate led to comparable cellcounts of a microbial community from the same source. Three bottles of Evian purchased fromthe same location were analyzed in biological triplicate with the Accuri on June 12, 2019 and inbiological duplicate with the Canto on June 14, 2019. Adjusting the gate brought the Cantointact or total cell count value closer to that of the Accuri than the Eawag values in most cases(Figure S7). This pattern did not hold for total cell count of bottle 1, which had an adjustedaverage greater than the Accuri average. However, this sample had the largest standarddeviation (Table S7), and the paired intact cell count measurement was brought much closer tothat of the Accuri. Overall, we concluded that the differences associated with cytometersfollowing adjustment were minor as compared to differences associated even with the same sitein a distribution system over time, which can range orders of magnitude (e.g., site ut in Figure1A).1
2 Supplemental TablesTable S1: Summary of sample locations and parameters measured. Each system was sampled in either 2016 and/or2018 in the distribution system (where n is the number of sites sampled each year). The parameters measured wereintact cell counts (ICC), total cell counts (TCC), residual disinfectant concentration, pH, temperature, adenosinetriphosphate concentration (ATP), and/or heterotrophic plate counts 01820162018201820182
Table S2: Ranges in parameter values for samples taken in all drinking water distribution systems sampled for thisstudy by type of secondary disinfectant applied in the system, including intact cell counts (ICC), total cell counts (TCC),adenosine triphosphate concentration (ATP), and heterotrophic plate counts ATP(nM)total ATP(nM)HPC(MPN/100mL)free chlorine(mg/L)total chlorine(mg/L)pHtemperature( tal ATP(nM)HPC(MPN/100mL)free chlorine(mg/L)total chlorine(mg/L)pHtemperature( eometric sdarithmetic meanarithmetic sdChloramine1121.18E 022.42E 031.52E 053.62E 036.16--Chloramine1123.50E 029.76E 036.23E 051.32E 045.33--Chloramine94 1.85E-041.45E-033.12E-021.69E-034.10--Chloramine67 124.72.42E 0320.610.0--Chloramine96 0.020.0500.540--0.0840.095Chloramine109 .030.142Chloramine8213.718.628.8--20.03.9954 223.53E 031.58E 052.58E 0312.9--5431.77.13E 031.58E 054.97E 0310.0--Freechlorine21 ne31 12.032.30E ineFreechlorineFreechlorineFreechlorine3
Table S3: Corrected Akaike information criterion (AICc) values for backward stepwise model selection (all aregeneralized linear mixed models with site as a random intercept) shown in order of 0.20-0.20-0.05Table S4: Ranges in parameter values for samples taken in distribution system F, including intact cell counts (ICC),total cell counts (TCC), adenosine triphosphate concentration (ATP), and heterotrophic plate counts (HPC).AssayICC(cells/mL)TCC(cells/mL)intracellular ATP(nM)total ATP(nM)HPC(MPN/100 mL)free chlorine(mg/L)total chlorine(mg/L)pHtemperature( eanarithmeticsd1001182.53E 031.52E 053.95 035.59--1003501.18E 046.22E 051.40 0310.0024.10--671.024.72.42E 0320.610.0--96 0.020.050.54--0.0840.09597 3.718.628.8--19.93.994
Table S5: number of samples (n) and percentage of those samples that were quantifiable by drinking water distributionsystem sampled, including intact cell counts (ICC), total cell counts (TCC), adenosine triphosphate concentration (ATP),and heterotrophic plate counts (HPC).distributionsystem Adistributionsystem Bdistributionsystem Cdistributionsystem Ddistributionsystem Edistributionsystem 7181.7intracellularATPtotalATPHPCTable S6: Result of calibration bead experiments with beads of four different diameters measured on Accuri flowcytometer with Eawag gate and Canto flow cytometer with Eawag gate and adjusted gate. Accuri results arebiological triplicates of geometric averages from technical triplicates and Canto results are biological duplicates ofgeometric averages from technical triplicates.Flow cytometerand gateAccuriEawag gateCantoadjusted gateCantoEawag gatemeasurementArithmetic averagecount(beads/mL)Arithmeticstandard deviationPercent error(%)Arithmetic averagecount(beads/mL)Arithmeticstandard deviationPercent error(%)Arithmetic averagecount(beads/mL)Arithmeticstandard deviationPercent error(%)50.22 µm0.45 µm0.88 µm1.35 µm7.8E 054.5E 031.1E 061.1E 061.7E 048.3E 022.2E 041.2E 0422.399.66.209.823.7E 032.4E 038.2E 059.9E 052.2E 031.6E 034.0E 042.4E 0499.699.818.50.771.2E 039.1E 027.5E 059.9E 058.1E 025.4E 026.1E 042.5E 0499.999.925.50.96
Table S7: Result of the same three bottles of Evian water measured on Accuri flow cytometer with Eawag gate andCanto flow cytometer with Eawag gate and adjusted gate. Accuri results are biological triplicates of geometricaverages from technical triplicates and Canto results are biological duplicates of geometric averages from technicaltriplicates. Data for intact cell count assay (ICC) and total cell count assay (TCC) are shown.Flowcytometerand measurementArithmetic averagecount(cells/mL)Arithmeticstandard deviationArithmetic averagecount(cells/mL)Arithmeticstandard deviationArithmetic averagecount(cells/mL)Arithmeticstandard deviationEvian bottle 1Evian bottle 2Evian bottle 3TCCICCTCCICCTCCICC1.9E 051.5E 051.6E 051.1E 051.2E 059.5E 042.5E 049.9E 036.2E 033.9E 033.8E 033.3E 032.7E 051.5E 051.5E 059.8E 041.1E 058.6E 041.2E 051.6E 048.2E 032.0E 044.7E 037.6E 032.1E 051.2E 051.2E 058.9E 049.8E 047.5E 048.8E 041.6E 049.6E 032.1E 042.3E 038.2E 036
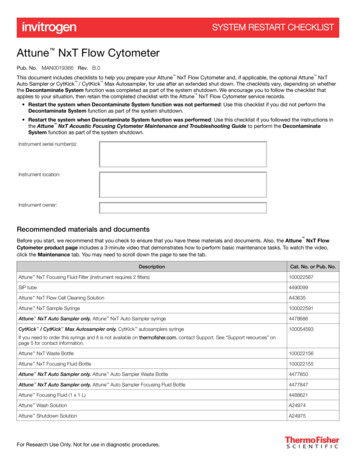
3 Supplemental FiguresAB10total cell count (cells/mL)total cell count 3total chlorine residual (mg/L)101.051.free chlorine residual (mg/L)D10-1-1-2total ATP (nM)total ATP (nM)C1050.10-310-210-3-410-41010-510-501200.3total chlorine residual (mg/L)50.1.051.free chlorine residual (mg/L)sampling locationsampling locationsystem Csystem Asystem Dsystem Fsystem Bsystem EFigure S1: total cell counts (A-B) and total ATP (C-D) in drinking water distribution systems sampled in this study.Horizontal lines denote quantification limits. Points are the geometric mean of the technical replicates and error barsrepresent geometric standard deviation for technical triplicates.7
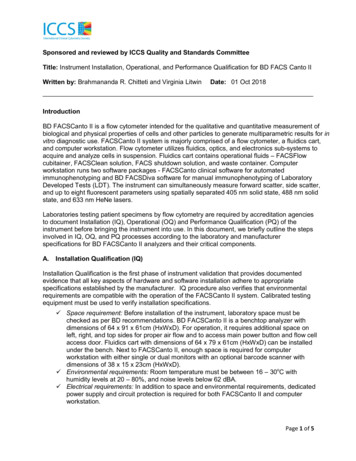
AB1.25system Cfraction of potentially viable cellsfraction of potentially viable cells1.25system F1.00site0.75site utsite 150.50site 100.25site 24other sitein system F0.00012system A1.00system B3system D0.75system E0.50sampling year0.25201620180.00other sitein system Ctotal chlorine residual (mg/L)sampling location00.50.01.51.02.free chlorine residual (mg/L)Figure S2: Fraction of potentially viable cells (intact cell counts/total cell counts) in chloraminated (A) and chlorinated(B) drinking water distribution systems sampled in this study. Shapes in A denote locations in distribution system Fthat were sampled at least six times between August 2017 and April 2018. Shapes in B denote locations indistribution system A and distribution system B that were sampled once in 2016 and repeated in 2018.The foursamples with intact cell counts/total cell counts 1 had intact cell counts and total cell counts values within 15% ofeach other.A0%25%5e 04quantilesof total chlorine(standardizedand centered)1e 05intact cell count(cells per mL)1e 05intact cell count(cells per mL)Bquantilesof temperature(standardizedand centered)50%0%25%5e 0450%75%75%100%100%0e 000e 00-2-1012-2-1total chlorine concentration(standardized and centered)C12Dquantilesof free chlorine(standardizedand centered)0%25%5e 04quantilesof pH(standardizedand centered)1e 05intact cell count(cells per mL)1e 05intact cell count(cells per mL)0temperature(standardized and centered)50%0%25%5e 0450%75%75%100%100%0e 000e 00-2-1012-0pH(standardized and centered).50.00.51.0free chlorine(standardized and centered)Figure S3: Visual representation of the most optimal model (Equation 2).To generate lines, all fixed effects were heldconstant at its mean except (A) Figure 3 in the main text included for comparison: total chlorine is on the x axis andtemperature is varied in the model at each quantile value (-1.9, -0.10, -0.53, 0.87, and 2.1), (B) temperature is on thex axis and total chlorine is varied in the model at each quantile value (-1.8, -0.43, 0.51, 0.96, and 1.9), (C) pH is onthe x axis and free chlorine is varied in the model at each quantile value (-0.69, -0.69, -0.58, -0.38, and 1.3), and (D)free chlorine is on the x axis and pH is varied in the model at each quantile value (-2.3, -0.78, -0.17, -0.20, and 2.2).8
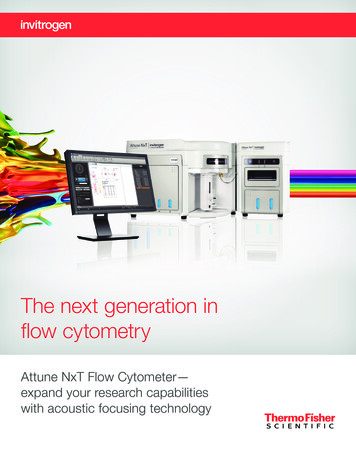
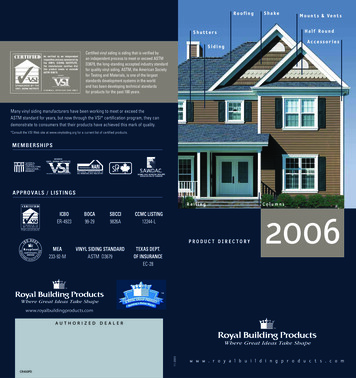
32total chlorine (mg/L)132101030200300 0100200300210100200300 0010020030water age (h)sitesite utsite 24site 15other sitein system Fsite 10Figure S4: total chlorine concentration by water age (hours) in distribution system F for sampling dates with at leasttwo samples collected. Shapes denote locations in distribution system F that were sampled at least six times betweenAugust 2017 and April 2018.9
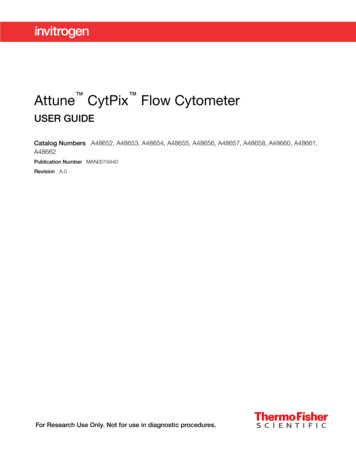
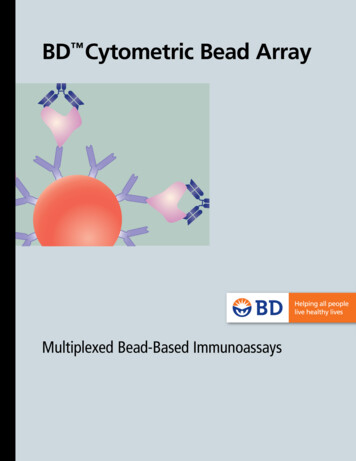
Figure S5: Ranges in total chlorine concentration by location in distribution system F from July 2017 to July 2018.Numbers underneath each box represent the number of sample measurements for that site.10
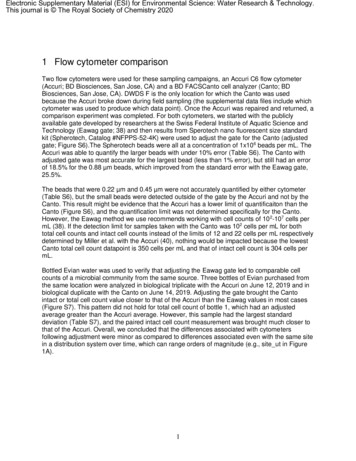
0.88 µm0.45 µm1.35 µmCanto Eawag gateCanto Adjusted gateAccuri Eawag gate0.22 µmFigure S6: Result of calibration bead experiments with beads of four different diameters measured on Accuri flowcytometer with Eawag gate and Canto flow cytometer with Eawag gate and adjusted gate. One technical replicate isshown for each particle size with green fluorescence on the y-axis and red fluorescence on the x-axis.Accuri EawagCanto Adjusted4.5E 054.0E 053.5E 053.0E 052.5E 052.0E 051.5E 051.0E 055.0E 040.0E 00Evian Bottle 1 Evian Bottle 2BCanto EawagIntact Cell Counts (cells/mL)Total Cell Counts (cells/mL)AAccuri EawagCanto AdjustedCanto Eawag1.8E 051.6E 051.4E 051.2E 051.0E 058.0E 046.0E 044.0E 042.0E 040.0E 00Evian Bottle 1 Evian Bottle 2 Evian Bottle 3Evian Bottle 3Figure S7: Result of the same three bottles of Evian water measured on Accuri flow cytometer with Eawag gate andCanto flow cytometer with Eawag gate and adjusted gate. Accuri results are biological triplicates of geometricaverages from technical triplicates and Canto results are biological duplicates of geometric averages from technicaltriplicates. Error bars represent spread associated with standard deviation of biological replicates. Data for total cellcount assay (A) and intact cell count assay (B) are shown.11
4 Author Contributions Lauren C. Kennedy: Experimental design, sampling, and lab work for systems A (2016 &2018), B (2016 & 2018), C (2016), F (2018); data analysis; manuscript writing;manuscript editingScott E. Miller: Experimental design, sampling, & lab work for systems A, B, C, D, E in2016; manuscript editingRose S. Kantor: Sampling and lab work for systems A and F in 2018; manuscript editingKara L. Nelson: Experimental design, data analysis, manuscript writing, and manuscriptediting12
1 Flow cytometer comparison Two flow cytometers were used for these sampling campaigns, an Accuri C6 flow cytometer (Accuri; BD Biosciences, San Jose, CA) and a BD FACSCanto cell analyzer (Canto; BD Biosciences, San Jose, CA). DWDS F is the only location for which the Canto was used