Transcription
1
Contact informationInvestor Relations OfficeLuc CoolLuc AlbrechtMarina KanamoriChristel DecorteIda MarkvartovaSandor SzaboRonny Van GinderdeurenDirector of IRFinancial Communications OfficerCSR Communications OfficerIR AssistantIR AnalystIR ManagerIR WebmasterE-mail: investor.relations@kbc.comSurf to www.kbc.com for the latest update.2
Important information for investors This presentation is provided for informational purposes only. It does not constitute an offer to sell or the solicitation to buyany security issued by the KBC Group. KBC believes that this presentation is reliable, although some information is condensed and therefore incomplete. This presentation contains forward-looking statements with respect to the strategy, earnings and capital trends of KBC,involving numerous assumptions and uncertainties. The risk exists that these statements may not be fulfilled and that futuredevelopments differ materially. Moreover, KBC does not undertake any obligation to update the presentation in line with newdevelopments. By reading this presentation, each investor is deemed to represent that it possesses sufficient expertise to understand therisks involved.3
Table of contents1. Company profile and strategy2. 3Q 2007 financial performance1.2.3.4.HighlightsSubprime loan exposureAnalysis of results, GroupUnderlying profit performance per business unit4
Company profileand strategy5
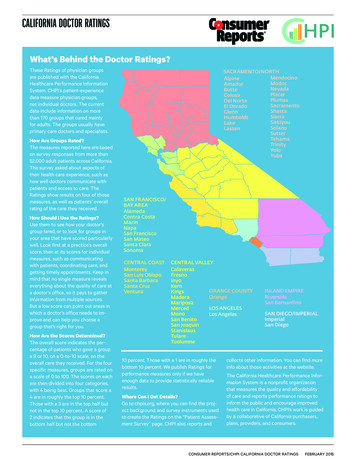
Strong, attractive franchisesStrategy, capital& Risk management1Belgium2Czech Rep.Belgium: 45% of Group profit 4.3bn allocated equity 160bn AUMSlovakiaCEEPolandHungaryCEE: 20% of Group profit 2.3bn allocated equity 12bn AUMShared Services & veniaRussiaRomaniaSerbiaBulgariaMerchant Banking: 30% of Group profit 5.2bn allocated equity 2bn AUMEuropean Private Banking: 7% of Group profit 0.5bn allocated equity 56bn AUMN.B.:Profit contribution of business units excluding non-recurring items (9M 2007) Over the past few years, KBC has strengthened its bancassurance position in Belgium, its traditional home market, whilebuilding up an additional franchise in 4 CEE countries and holding a top-3 position in that region KBC also operates in selected merchant banking and private banking markets, primarily focusing on niche strategies Recent acquisitions include a new presence in Russia, Romania, Serbia and in Bulgaria6
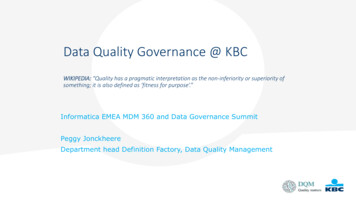
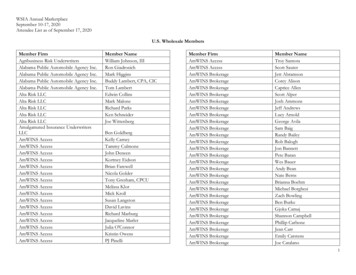
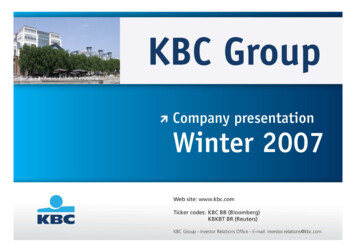
Shareholder structureCERA/KBC Ancora30%MRBB12%54%Free float42.5%Institutional,Cont.Europe29%Free floatOther coreshareholders 12%KBC(Treasury shares: 3.5%*)Situation as of 30 Sept, 2007*Including ESOP hedge and sharesbought back according to theshare buy back planInstitutional,N. America24%Institutional,UK22%Institutional,R/o m13%Shareholder identification surveyas of 31 Dec 2006 KBC is 50%-owned by a syndicate of shareholders, providing continuity to pursue long-termstrategic goals. Committed holders include the Cera/KBC Ancora Group (co-operative investmentcompany), a farmers’ association (MRBB) and a group of industrialist families The free float is chiefly held by a large variety of international institutional investors (close to 50%UK- or US-based)7
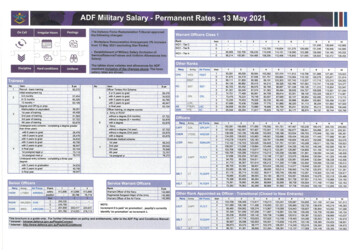
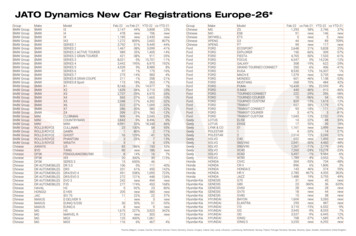
Situation as of 8 November, 20078EFG EUROBANKBCO POP ESPDNBNATIXISERSTERAIFFEISEN INT'LCOMMERZBDANSKEDEXIANAT BANK OF GRNORDEA BANKKBCSTND CHARTEREDCAFORTISLLOYDS TSBHBOSDEUTSCHESGBARCLAYSCREDIT SUISSERBSBBVAINTESA SPINGBNPUBSUNICREDITBSCH SANTANDERHSBCConsiderable scale in European bankingRANKING BASED ON MARKET CAPITALIZATIONKBC Group31 bn
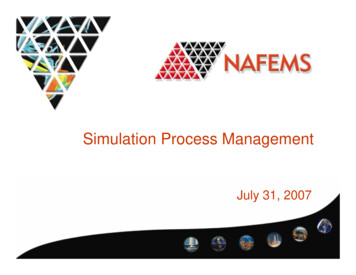
Mid-term financial targetsROEMin target 2007-2009: 18.5%18%EPS growth y/y19%43%18%14%22%13%12%8%16%Min target 2007-2009 CAGR: 12%2003 FY 2004 FY 2005 FY 2006 FY 2007 9M2003 FY 2004 FY 2005 FY 2006 FY 2007 9M9M 2007: y/y growth on an underlying basisCost / income, banking65%Combined ratio, non-life65%58%58%58%Max target by 2009: 55%96%95%96%96%97%Max target by 2009: 95%2003 FY 2004 FY 2005 FY 2006 FY 2007 9M2003 FY 2004 FY 2005 FY 2006 FY 2007 9MAll results are on an underlying basis. Targets 2007-09 were set at the end of 2006 on the basis of 2006 underlying performance9
Outstanding return levelsReturn on Allocated CapitalBelgiumCEE31%29%FY 05FY 0635%9M 0725%25%28%FY 05FY 069M 07*European Private BankingMerchant Banking22%21%19%27%29%32%FY 05FY 069M 07FY 05FY 069M 07All figures are on an underlying basis* Return in CEE, excluding Absolut Bank (Russia). 9M return including Russia is 25%10
Core EPS growth drivers1. Strong positions in core markets Top-3 player in Belgium and CEE-4 (75m inhabitants)Branch expansion in CEE-4 to strenghten market positions further (No of branches 33% in 2006-2009)2. Unique x-selling model Cross-selling of banking, asset management and insurance products Full integration of management, distribution channels & back-offices Innovator in CEE in bancassurance and AM (e.g., for AM, 1.5x ‘traditional’market share achieved)11
Core EPS growth drivers (2)3. Discipline regarding shareholder’s funds Strict financial criteria for external growth (ROI: exceeding cost ofcapital in maximum 5 yrs) 4 bn 2006-2009 share buyback programmes (1.9 bn achieved as ofNovember, 2007)4. Group scale effects via better executing of best practises accross units by setting up cross-border shared operations 275m worth of synergies, pre-tax, expected by 200912
Dividend 20021,642003EPS1,8420042005*2006*DPS* EPS based on an underlying basis Steadily increased dividend for more than 20 consecutive years Gross DPS growth was 17% CAGR over the last 5 years Historical average cash payout stands at 40-45%13
Current operations ofKBC in Central & Eastern EuropePolandKredyt BankWarta InsuranceRussiaAbsolut BankCzech RepublicCSOB BankCSOB InsuranceRomaniaRomstal LeasingSlovakiaCSOB BankCSOB InsuranceBulgariaDZI InsuranceEI BankHungaryK&H BankK&H InsuranceSerbiaA BankaSloveniaNLB Bank*NLB Life Insurance*financial participation14
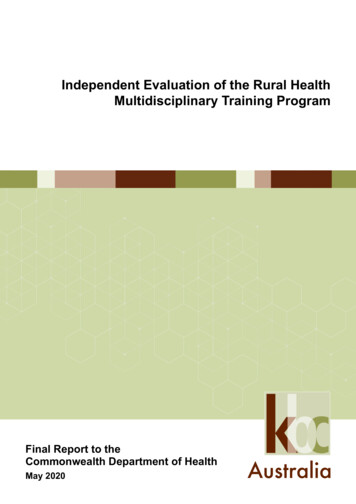
Stress test on FX credit granting in CEEExpected losses from FX loans in function of the depreciaton of LCY44after-tax,in m eurosPoland26Hungary1203010Current 64.324.685.040.1%0.4%0.8%1.4%Impact on KBC 2008 net profit** Compared to 2008 net profit analyst consensus (3.1 bn)Note: There is no material FX credit granting in Czech Republic and Slovakia15
Financial calendar7-Dec,7-Dec,20072007Investor meeting (Investor Day), London14-Feb,14-Feb,20082008Publication of 2007 FY results24-Apr,24-Apr,20082008Annual General Meeting15-May,15-May,20082008Publication of 2008 1Q results16
Analysts’ opinionsSituation as of 8 November, 2007 (current share price: 87.95)BrokerAnalystPhoneRatingTarget priceUpside potentialOmar Fall 44 20 7678 0442 110 25%Ivan Lathouders 32 2 287 91 76 109 23%Jan-Kees Mons 31 20 573 06 66 116 32%Kiri Vijayarajah 44 20 7986 4258 113 28%Guillaume Tiberghien 44 20 7883 7515 115 31%Gaelle Cibelly 33 1 44 95 66 28 102 16%Kurt Debaenst 32 2 565 60 42 109 24%Albert Ploegh 33 1 56 39 32 84 107 22%Christophe Ricetti 33 1 58 55 05 22 105 19%Paul Formanko 44 20 7325 6028 110 25%Jean-Pierre Lambert 44 20 7663 5292 100 14%Manus Costello 44 20 7996 1953 109 24%Scander Bentchikou 33 1 44 51 83 08 107 22%Thomas Stögner 49 69 7134 5602 107 22%Ton Gietman 31 20 573 54 63 110 25%Georg Krijgh 31 20 460 48 60 113 28%Simon Chiavarini 44 20 7568 2131 115 31%Ralf Breuer 49 211 826 4987 110 25%Consensus109 24%17
3Q 2007financial performance18
Highlights19
Quarter under review Financial highlightsUnderlying net profit880634Reported net profit1081980736997in m euros781776574601564in m euros9366396341Q 062Q 063Q 064Q 061Q 072Q 073Q 074Q 07Exceptional itemsin m euros5071Q 062Q 063Q 064Q 061Q 072Q 073Q 074Q 07216204Exceptional results in 3Q 07 chiefly relate to MTM gains on ALMhedges and to the sale of the share in the Hungarian bank-cardclearing house GBC (with a positive after-tax impact of 28m euros),excluded from underlying results102701Q 062Q 063Q 064Q 06561Q 072Q 07383Q 074Q 073Q 06 reported net profit included 500m divestment gain on BancoUrquijo (Spain)Note: All of the following slides of this presentation refer to underlying P&L figures20
Quarter under review Financial highlights (2)MTM adjustment re CDOs (after tax)BelgiumCEEMerchantBankingin m eurosEuropeanPrivateBankingGroupCenterGroup Total-40-39-6-12Underlying net profit15344in m euros-16-17601Underlying net profit excl. CDO MTM117303170in m p Total129310BelgiumCEEGrowth 1%Group Center Group Total5%BelgiumCEEGrowth y/y:17%17%MerchantBanking5%6%12%21
Quarter under review –Financial headlines Underlying net result came to 601m, up 5% y/y Continued solid top-line dynamics Limited impact of the adverse situation on financial markets Unchanged environment for customer loan risk No liquidity nor solvency issues22
Operating highlights 9M 2007 Since the end of 2006 KBC entered into new CEE markets via theacquisition of majority stakes in Bulgaria, Romania, Serbia, Russia Amount spent in the region: 1.7bn eurosBy the beginning of November 2007, a total of 1.9bn worth of shares hadbeen bought back as part of the 2006-2009 4-billion-euro share repurchaseprogrammes23
2007 4Q developments Andre Bergen, CEO: “4Q has made a good start” KBC continues to believe that despite the recent market turbulences it will beable to meet its mid-term financial targets 4Q 07 earnings will include for the first time results from DZI Insurance(Bulgaria). Start of consolidation of Economic and Investment Bank (EIB,Bulgaria) results is expected for 1Q 08, depends on the closing date of thetransaction KBC will publish its FY 07 results on 14 February, 2008 at 7 a.m. CET24
Subprimeloan exposure25
Reminder:KBC Group subprime lending exposureSituation already disclosed in August: KBC has exposure to US subprime lending:z Via investments in CDOs with some ABS underlying:o Total assets 7.1 bn, of which 80% corporate credits, 10% subprime (4.5percentage points in 2005-2006 vintages), 10% other ABSz Via commitments to the ABCP conduit “Atomium”o Total assets, 2.3 bn of which 514m subprime (90% in 2005-2007 vintages) The earnings impact can be twofold:z Impairment charges: estimated to be max. 9m euros (stress test assuming 11% losson 2005-2007 subprime)*z MtM impact: depending on market value of assets (however, temporary in a “buyand-hold” view)Remark: in September it was decided to unwind “Atomium” and shift the assets to the B/S * see 2Q earnings presentation for the full overview of assumptions26
KBC subprime lending exposure3Q 2007 developments3Q earnings impact: Impairment charge: nil (no default, no downgrading) MtM impact:zzOn CDOs: -39m (-51m pre-tax)On Atomium: no earnings impact * Remark: everything is mark-to-market (versus mark-to-model)* since the assets of Atomium are in the process of being integrated within the credit arbitrage portfolio, they are predominantly qualified as “AFS assets”and therefore MtM volatility is recognised directly in shareholder’s equity. The 3Q MtM impact was 17m after tax.27
KBC subprime lending exposure3Q 2007 developments (2)Why has the earnings impact been limited ? Our CDOs with ABS underlyings are “high-quality”:z Mainly corporate CDOs, only 20% of ABS exposure (10 % subprime)z 80% of tranches held are super-senior/super-mezzanine, including high“attachment points” (i.e. high level of subordination from lower rated tranchesheld by third parties) Equity and junior tranches on own account were always completely written-downat the time of issue Assets are actively managed by KBC itself Part of the MTM volatility is offset by hedges No assets were or planned to be sold at distressed prices (buy and holdapproach)28
KBC subprime lending exposure –Updated stress test results Analyst estimates of potential net subprime loss currently in the 11-14% rangeCompanyDeutsche BankJP MorganGoldman SachsS&PMoody’sAverage Estimate9.5% - 10%12% - 14%12% - 13%13.9% (median)9.2%-11.6% (median)11% - 14%Our more severe assumptions:z 15% cumulative net loss on 2005-2007 vintage pools (vs. 11% used in August)z Including all subprime and alt-A exposures through CDOs* and in ‘Atomium’z All losses crystallizing in 2009Expected amount of credit defaults for our account: 29m (incl. ‘Atomium’)This remains a stress test, not an actual loss estimate. On the basis of currentknowledge KBC believes that losses will remain below this level.* including CDOs with ABS in credit arbitrage portfolio29
KBC subprime lending exposure –Updated stress test results (2) New CDO subprime stress test with more severe assumptions shows some 21m default losses by2009 (see details in the table below) Expected credit default loss with the same assumptions in ‘Atomium’ conduit: 8mRatingCurrent Ratings - Q3 1Caa2Caa3CaCDScenario Model Ratings - 20095 928,6342,2337,1241,519,779,725,111,70,5-Total*6 986,1*Total exposure in EUR terms decreased compared to the beginning of 3Q due to FX changes4 07,725,032,011,38,015,322,621,36 986,130
KBC subprime lending exposure –End of October situation The end-of-October mark-to-market adjustments on ourCDO portfolio (including ‘Atomium’) was only 10.4m,after-tax31
Analysis of resultsGroup32
VolumesTotal loansOf anding (in bn)1404419223222Growth, q/q 6% 4% 2% 1% 2%Belgium 4% 2% 3% 2% 1%CEE- CZ/Slovakia- Hungary- Poland 7% 7% 3% 13% 10% 8% 7% 23% 4% 3% 6% 4% 12% 8% 6% 34% 3% 4% 14%-7%Merchant Banking 2%--6%------3% 3%Private BankingNotes:- Organic growth rates only- Growth rates excluding repo and reverse repo actvities- Trends for CEE in local currency33
VolumesTotal loansOf 19223222Growth, y/y 18% 16% 9% 13% 6%Belgium 9% 9% 11% 13% 4%CEE- CZ/Slovakia- Hungary- Poland 28% 43%0% 37% 34% 35% 12% 83% 14% 13% 15% 19% 30% 32% 28% 67% 17% 9% 47% 28%Merchant Banking 27%- 1%----- 6% 12%Outstanding (in bn)Private BankingNotes:- Organic growth rates only- Growth rates excluding repo and reverse repo actvities- Trends for CEE in local currency34
Revenue trendNII1 0201 0341 0392Q20063Q20064Q20061 0631 081in m euros in %1,69% 1,67% 1,70% 1,71% 1,71% 1,68% 1,69%9791Q2006NIM*1 61Q20072Q20073Q20074Q2007Steady growing NII (1 116m), up 2% q/q, 7% y/y on an organic basisImpact of first time consolidation of Absolut Bank (Russia): 22mMainly driven by solid volume growthNIM (1.69%) in line with previous quarters* Net Interest Margin equals Net Interest Income divided by TotalInterest Bearing Assets excl. reverse repos35
Revenue trendF&CAUMin m euros2132082042091Q20062Q20063Q20064Q2006229232in bn euros2Q20073Q20074Q2007216BankingInsurance 73Q20064Q20061Q20072Q20073Q20074754Q20071Q2007Net F&C (539m) down only 1% q/q notwithstanding the usual seasonal drop inretail fee business in the summer monthsNet F&C up 34% y/y on a comparable basis, albeit that 3Q 06 was very low(especially in Merchant Banking)AUM (232 bn) up 1% q/q (seasonal effect), 13% y/y of which some two-thirds dueto new inflows36
Revenue trendPremium income946852768in m eurosFV gains482969869754384824in m 20073Q20074Q2007 Earned premium (969m) up 18% q/q and 14% y/y on the back of higher life sales (mainlyinterest-guaranteed) FV gains (154m) dropped:zSeasonal slowdown q/qzImpact of financial markets turbulences on capital market units, esp. in fixed-incomebusinesszMTM adjustments on CDO portfolio (51m pre-tax, 39m after tax)37
Revenue trendAFS realized gains108107Dividend incomein m eurosin m euros1121159686717062121Q2006 S gains (115m): higher than average levelDividend income (23m) as anticipated, considerably down from the seasonalpeak in the second quarter38
Operating expensesOperating expenses, consolidated5011 3881 2381 2231Q20062Q2006C/I, banking1 2081 1263Q20064Q2006Operating expenses, Belgium1Q20071 3141 2662Q20073Q2007in m euros4Q2007FY 05FY 069M %n/a57%63%72%n/a51%60%71%71%Private Banking72%73%65%Merchant 63Q20064324Q20061Q2007in m euros4714612Q20073Q20074Q2007Operating expenses, CEEin m 3523632Q20073Q20074Q200739
Operating expenses q/q evolution: expenses dropped 5% on comparable basiszLower income-based wage costs for some market activitiesz2Q 07 contained some less frequent items:o23m provisions for pending commercial litigations in Merchant BankingoRelocation cost to new HQ premises of CSOB in Prague (5m)y/y developments: up 8% on comparable basiszBetter spread of costs throughout the yearzHigher income-related expenses in capital market activities (more income was realizedin units with high share of variable costs)zCost increase only 2% in Belgium, 1% in CEE (excluding FX impacts) and 1% PrivateBankingzFor the entire year, cost growth is expected to remain within our guidancezImpact from first-time consolidation of Absolut Bank (Russia): 17mYTD Cost/Income ratio at 58% (underlying) stable compared to FY 0640
ImpairmentImpairment, consolidatedImpairment, Belgiumin m eurosin m 72Q20073Q20074Q2007Loan loss ratioFY 05FY 069M 2Q200612153Q20064Q2006n/an/a0.83%Merchant 2Q20073Q20074Q2007Impairment, CEEin m 063Q20064Q20063Q20074Q200741
Impairment 3Q 07 total impairment: 62m YTD LLR 13 bps on Group level: still very low (13 bps in FY 06) The overall loan quality continues to be sound. NPL ratio stable at 1.4%42
Underlying profitperformanceper business unit43
Business Unit BelgiumNet profit3273232751Q20062Q20062663Q2006Total Income*in m euros417in m 20074Q2007* Gross technical charges, insurance and ceded R/I results deducted 3Q 07 underlying net profit: 303m – up 14% y/y, YTD net combined ratio at 97% (93% excl. the impact of Kyrill storm in 1Q)9M return on allocated capital: 35%Higher-than-quarterly-average insurance results (partly due to higher-than-averagecapital gains)44
Business Unit Belgium (2)NII4791Q2006 4894812Q20063Q2006in m 6%1Q20061,92%2Q2006NIMin m 3Q20074Q2007Flat NII (478m) q/q and y/yPositive impact of increasing loan and deposit volumes (resp. 9% 11% y/y) compensated by:zchanging business mix (shift from saving accounts to time deposits)z25 bps increase on saving deposit rate in Belgium following (higher) benchmark rateincreases over the last 12 monthszupstreaming dividends to holding company level (-1% impact y/y)NIM (1.72%) down 5bps q/q and 10 bps y/y45
Business Unit Belgium (3)F&CAUMin m euros158160in bn 20072Q20073Q2007 Net F&C (214m) down 10% q/q, due to the usual seasonal influence, up15% y/y y/y growth mainly thanks to the asset management business4Q2007AUM up 2% q/q, 13% y/y of which 10% points constituted net new inflows46
Business Unit Belgium (4)Operating expenses501427444452432471Impairmentin m eurosin m 074Q20071Q200662Q2006 Operating expenses (461m) down 2% q/q, up 2% y/y Again very limited impairment (11m, YTD LLR: Underlying YTD C/I ratio stable at 58% compared to FY 06, negatively impacted bythe losses on bond sales in banking book in 2Q47
Business Unit CEENet profitFirst timeconsolidationof Absolut Bank:2.2bnRWAin m euros177150124in bn 072Q2007561Q2006 20074Q2007Underlying net profit (117m), up 7 y/y, but down from the highest-ever 2Q 07 level,partly due to seasonal effectsContribution of CR/SR: 77m, Hungary: 31m, Poland: 37m, Russia: 2mYTD return on allocated capital, incl. Absolut Bank: 25%, (excl. Absolut Bank: 28%)RWA up strongly q/q, but 2.2bn due to the first-time consolidation of Absolut Bank48
Business Unit CEE (2)First timeconsolidationof Absolut Bank:22mNIINIM*3,13%2,90% 2,93%319 73,04%2,98% 3,03%in %in m 0073Q20074Q2007Significant rise in NII (319m): up 8% q/q and 19% y/y on a comparable basisContinued robust volume growth throughout the region:z 2713,09%Loan volumes up 28% y/y, deposits up 14% (organic growth; 4% exchange ratechanges excluded)NIM stable q/q and up 11 bps y/yNIM of Absolut Bank: 4.29%* Net Interest Margin equals Net Interest Income divided by TotalInterest Bearing Assets excl. reverse repos49
Business Unit CEE (3)First timeconsolidationof Absolut 116-27-29-29-30-34-34-341Q2006 200612,410,010,64Q20061Q200711,1in bn eurosin m euros4Q20073Q20062Q20073Q20074Q2007Organically net F&C (82m - banking and insurance together) dropped by some 6%q/q, due to seasonal effectsF&C for banking up 4% y/y on a comparable basis, but offset by increasingcommissions paid to insurance agentsAUM up 12% q/q, 30% y/y, of which two-thirds thanks to new inflows50
Business Unit CEE (4)Operating expenses397302311328321352First timeconsolidationof Absolut Bank:17mImpairment363First timeconsolidationof Absolut Bank:4m64in m euros44381925271Q20072Q2007in m euros101Q2006 20063Q20064Q20063Q20074Q2007Operating expenses (363m) were marginally up (1%) y/y, down 2% q/q (excludingimpact of new acquisitions and 4% exchange rate changes). YTD C/I ratio (banking)at 62% (65% in FY 06)Asset quality remained sound. Limited impairments resulted in 40 bps LLR for theregion (58 bps in FY 06)FX mortgages fully under control. (Stress test: 20% depreciation of LCY will not51have any impact in Poland, 15m credit loss in Hungary)
Business Unit Merchant BankingNet profitTotal IncomeInvestment banking773748in m euros760668Commercial banking130602113321121075221026 789in m 20072Q20073Q20074Q2007Underlying net profit at 153mStrong performance in commercial banking (143m)Results of investment banking activities (10m) impacted by both traditionalseasonal decline in activities and adverse climate on financial markets (MTMlosses on CDOs: 17m, after tax)52
Business Unit Merchant Banking (2)RWA (Commercial banking) 3Q2007NII (Commercial banking)in bn eurosin m 2452084Q20071Q20062Q20064Q2007NII (277m, relating to commercial banking) roughly flat q/q and y/yNegative impact from upstreamed dividends: -1% y/yRWA of commercial banking up 2% q/q (but somewhat depressed by a shiftof 0.8 billion to the investment banking activities in 3Q 07)53
Business Unit Merchant Banking (3)F&Cin m euros340FV gains (Investment banking)2941218527896967376in m euros28818013287281Q2006 20063Q20064Q20061Q20072Q20073Q20074Q2007Net F&C (121m) the highest of the last few quarters, mostly thanks to equitybrokerage and corporate finance activities for local small and midcapsFV gains (86m) significantly down q/q and y/y, due to:z seasonal dropz adverse situation on the financial markets54
Business Unit Merchant Banking (4)Operating expenses336357299322Impairmentin m eurosin m 2Q20073Q2007 19954Q20071Q2006 ing expenses (311m) up 28% compared to (a low) 3Q 06, mainly due to higherincome-related expensesCosts were down 15% compared to 2Q 07 (lower income-related costs). 2Q 07 wasburdened with a 23m provision for pending commercial litigationLimited impairments (9m)YTD LLR 7 bps (nil in FY 06)55
Business Unit Merchant Banking (5) KBC has chosen to unwind its SIVs and manage the assets onB/S (within the investment banking division):z April 2007: start of transfer of assets from conduit “Quasar”to B/S (reminder)z Sept 2007: start of shift of assets from conduit “Atomium” toB/S Main drivers:z More efficient regulatory use of capital under Basel IIz Organisational simplification 3Q impact on Basel I-related RWA: 1.1 bn56
Business Unit Merchant Banking (6) In 3Q, additional investments in corporate risk instruments (0.8 bn) wereshifted from “commercial banking” to the “investment banking” division(further centralisation in single centre of competence, completion oftransfer started in 2Q 07) Impact on RWA from unwinding of conduits and internal shift of assets:3Q 2007YTD 2007Merchant Banking total1.1bn4.8bnInvestment banking1.9bn7.2bnCommercial banking-0.8bn-2.4bn57
Business Unit Private BankingNet profit1Q2006 44442Q20063Q2006in m euros1475755Operating expensesin m 74Q2007Underlying net profit (44m) flat y/y, but down 23% q/q due to the traditionalsummer slowdownExpenses (120m) show a limited 1% y/y and 4% q/q increaseYTD C/I at 65%, a significant improvement compared to 73% at FY 0658
Business Unit Private Banking (2)F&C1351Q2006 1322Q20061041113Q20064Q2006AUMin m euros1211191161Q20072Q20073Q20074Q2007in bn Q20073Q20074Q2007F&C slightly down q/q (seasonal), up 12% y/y on the back of increased AUMvolumesAUM (56bn) up 6% y/y on a comparable basisIn line with the strategy AUM-growth in on-shore business witnessed a 13%y/y rise (up to 26bn)59
Group CentreNet 20073-13-8-9-19-17-16in m euros Underlying net result at -16m, in line with previous quarters, ofwhich the holding company accounting for -12m60
Wrap Up Underlying net result up 5% y/y Continued solid top-line dynamics Limited impact of the adverse situation on financial markets Unchanged environment for customer loan risk No liquidity nor solvency issues61
*Including ESOP hedge and shares bought back according to the share buy back plan Staff 3% Institutional, Belgium 8% Retail, Belgium 13% Institutional, UK 22% Institutional, Cont. Europe 29% Institutional, N. America 24% Institutional, R/o world 1% Shareholder identification survey as of 31 Dec 2006 Situation as of 30 Sept, 2007 CERA/KBC Ancora .