Transcription
FHLB Des Moines Region MemberMeetingsSESSION 2 – CREATING YOUR IDEAL FUNDING PLAN
Before the WebinarAccess the SlidesPDF: es-2020/The easiest way to listen isthrough your computer’sspeakers or headphonesEnsure your device speakers are on,or calling in is an option.Submit your questionsHave questions for the presenter?Use the Q&A panel on the right-handside of the screen.Connect With UsMore ResourcesAbrigo@weareabrigoFor Upcoming and Archivedsessions,visit www.abrigo.comFHLB Des Moines@FHLBDM
Our Series PresentersDave KochManaging DirectorDarryl MatayaSenior AdvisorRob NewberrySenior Advisor3
Making Big Things Happen from Small Actions!2020 FHLB Des Moines Regional Member Meetings Session 1: Managing Your Balance Sheet in Times of Crisis Session 2: Creating Your Ideal Funding Plan Structure Session 3: Navigating a Flattening Yield Curve During Record LowRates Session 4: Asset and Funding Strategies4
Our Unique InventoryProto-cuneiformtablets showingquantities of barleyand malt.2nd Century BC.The moneychanger and his wifeMarinus van Reymerswaele - 1539
How Do We Acquire Our Liquidity?Where does it come from?Market share, economic growth, expansion, acquisition,demographic trendsHow do we sell (attract) it?Safety, convenience, rates, technology, “we’re friendly”How do we manage the supply?ALCO meetings, contingency funding plans, pricingWhat do we do if we run out?Wholesale funding, brokers, specials6
NOW HIRINGJOIN OUR TEAMOUR FAST-GROWING COMPANY ISLOOKING FOR THE BESTCANDIDATE TO FILL THEFOLLOWING POSITIONSFUNDING MANAGERGENERAL REQUIREMENTSAccounting skills, technology skills and awareness,market knowledge and trends, sales skills, CPA levelinsight when reading financial statements, completefamiliarity with statistical methods, ability to woo boardmembers and regulators.The most highly qualified candidate will understandmarket rate elasticity, what it takes to attract millennials,and will possess the ability to accurately predict thefuture.LendingCFORetailAnyone seen our CDO?7
1Session 2Agenda8Institution StrategyDoes my lending strategy fit with my fundingsituation?2Market Awareness3Quality of Inventory4What about Wholesale?5How Do We Track Progress?6Nurturing the PlanGrowth no longer comes from keeping doors open.Is what we offer the same as what the consumer islooking for?We have dry powder, now what? How do we fitwholesale into our plan?What does a budget look like? How do we measuremarketing success vs. pricing success?Does our staff know what we are trying to accomplish?
What Does This Mean for Funding in 2020?
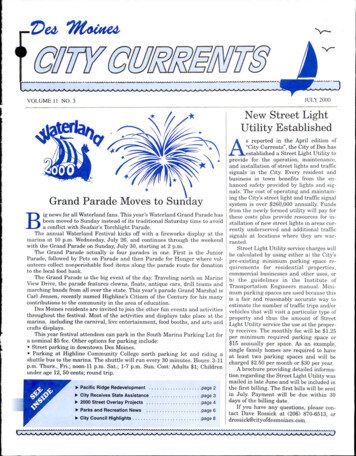
Pricing Betas – 2009 Through 2011This institution reducedits weighted averagerate paid on MMDAaccounts by 34% ofmarket rate changes.And it took an averageof 5 months to react towholesale ratechanges.The Fed Funds rate went to “zero” in December 2008.10
Pricing Betas – 2009 Through 2011The beta on thisinstitution’s CDs was75%, and it took anaverage of 9 monthsto react to wholesalerate changes.11
Deposit Mix Change – 2009 to 2018NMDNMD
Polling SlideHave you changed your pricing or strategy as a result of thecoronavirus pandemic? We have lowered deposit rates somewhat. We have made major deposit rate changes in line with overall marketrate changes. We are still considering how and when to adjust rates. I’m not sure we have made any changes yet.13
Institution Goals -- Funding Strategy 13% capital, feeling smug 11.5% capital, just above-board levels ROA above peer of 0.85% ROA above target of 1.05% Loan growth of 5% expected, but worried aboutcontinuing Loan growth 3% (if we’re lucky) Loan/Deposits at 68% Loan/Deposits at 94%We’re going to take on all loans we arecomfortable underwriting that beat theinvestment benchmark. Not worried aboutfunding costs. 8.2% capital, but RBC is ok ROA less important to us than longterm ROE Loan growth of 10% planned. Loan/Deposits at 105%We’re going to compete on price to growloans. We’ll pay whatever we need to fund it.We’re going to set ROE targets to maintainearnings and capital. This prices our funding at themargin. 9.6% capital, board a little worried ROA of 0.75% below peer Loan growth of 6% planned Loan/Deposits at 78%Multiple choices here – depends on priority of growth vs.capital. But earnings are a problem, therefore cost offunds is an issue.14
Market Awareness FDIC market share data available atfdic.gov, Deposit Market ShareReports. Track over time to measure overalldeposit market success and/orinitiative success. 12-25% market share is a dominantposition. You are likely aprice/product leader. Does not include out of marketbalances that come from yourdepositors (online savings).Market .99Olympia3.713.512.452.36201820193.011.46201715
Market Size 120,000,00012.00% 100,000,00010.00% 80,000,0008.00% 60,000,0006.00% 40,000,0004.00% 20,000,0002.00% 0 Total market size givesus some idea whatgrowth potential there isin deposit balances Here the smallestmarket (Olympia) haslargest recent marketgrowth rate.0.00%201720182019Portland - Sum of SizeTacoma - Sum of SizeSeattle - Sum of SizeOlympia - Sum of SizePortland - Average of GrowthTacoma - Average of GrowthSeattle - Average of GrowthOlympia - Average of Growth16
What is the Ideal Funding Source?Deposit sector continuum - the more features of a product that are important to aconsumer other than rate, the less sensitive they will be to rate paid. Checking– Transaction and access most important Savings– Earns interest, still accessible MMDA– Rate of return, higher balances with some liquidity Certificates– Rate and term most important Wholesale– Zero loyalty, fast access to liquidity17
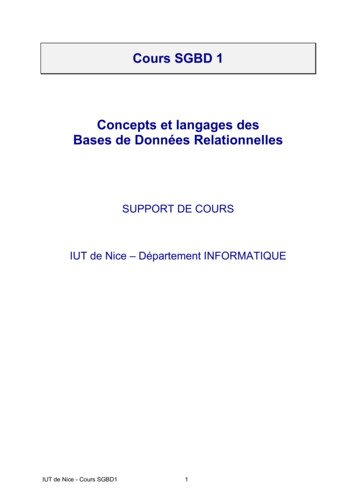
Balance vs Rate PaidShows us exactly how accountbalances are distributed and whatrates we are paying based onaccount size.Balance median is the point atwhich half of the balances are oneach side of the line. In this casethe balance median is atapproximately 16,000, AND, atthe 95th percentile – 1,303accounts (out of 26,066) hold halfof the total sector balances in thisconsumer checking sector.18
How Do We Value Deposits?Decay and Surge SummaryProduct CategoryCheckingSavingsMMDADecay Balance15,79932,13917,808Surge % Base Decay27.84%4.48%39.83%2.20%24.02%11.54%A core deposit study tells ushow non maturity balanceshave been behaving.Beta ResultsProduct CategoryPremium SavingsRegular SavingsMMDACheckingIndexAverage FHLB Advance - 3 YAverage FHLB Advance - 12 M6 Month US TreasuryAverage FHLB Advance – 2 YLag(mo) Pos. Corr Beta1210.863 0.2941210.927 0.0531210.963 0.441610.000 0.095Beta Balance4,59227,54717,63013,505Curr. Rate0.51%0.05%0.22%0.20%The combination of base decay,surge decay, and price responseto market rates allows us tocalculate the relative duration ofour deposits19
Deposit Value – Cost and Duration We measure the value of non-maturity deposits bymarking them to market using an FTP curve. This iswhat is reflected in your institution economic value ofequity measure (EVE).Effective Duration by Sector9.008.00Duration of a7/20 balloon7.00 Using core study data (decay rates and beta values),we calculate the effective duration of various depositcategories. Higher is better – meaning it is a betterhedge against interest rate risk.6.005.00 But, it is time consuming and expensive to attractthese long duration deposits!4.003.002.001.000.00-200bp-100bpBase CaseRegular Consumer Checking 100bpSavings 200bpPremium MMDA 300bp 400bpRegular MMDA20
Gathering Deposits – It Can Take Time21
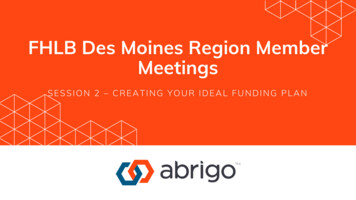
Gathering Deposits – It Can Take Time The line chart represents the average of all account’s percentage of maximum balance found forthat age. We look at how old the account is, and after filtering out dormant and very large accounts, wecalculate the percentage of that month’s balance relative to the largest balance we found for thataccount in its lifetime (so far). We then average all those percentage numbers for each account in the vintage – regardless of theactual dollars in each account. To keep in mind: New accounts grow or fund their balances with different patterns. CDs fund immediately. Non maturity accounts can vary depending on demographic factors, product design, and lengthof relationship.22
What Drives Consumers? 6%-12% of consumer checking accountsturn over on their own each year. You can easily figure out how manychecking accounts you are opening permonth/per branch. Do you know why you are openingaccounts?Possible Factors Location Product Features (fees,rates) Brand Convenience Value23
Polling SlideWhich of these factors ranks as most important for why consumerschoose a checking account? Product features Location Convenience Fees Brand recognition Friendliness24
J.D. Power 2019 U.S. Retail Banking Satisfaction Study 4% of consumers shifted primary accounts to a newinstitution, lowest level since measurement began 10 yearsago. 10 largest banks increased share of deposits from 39% to48% since 2009. Customers are staying because it’s become so convenient atthe large banks to transact business. The Big 6 banks have benefitted from improved customersatisfaction among customers under age 40 in recent yearsand, in 2019, attain higher satisfaction scores than regionaland midsize banks. Across all age groups included in the study, overallsatisfaction increases more notably among digital-centriccustomers of midsize and regional banks than amongcustomers of Big 6 banks.“Customer satisfaction and convenience haveimproved, but far too many customers have notre-established the trust and developed the deeperlevels of connection required to improve theindustry’s reputation. Looking 10 years into thefuture, when digital banking will be the norm fornearly all customers, retail banks will be requiredto be unique by scale or unique by strategy.Personalization of important customer journeys—transactional, advisory and solving problems—will emerge as the ways to elevate customertrust.”Challenge to community FIs – Finding amessage while offering top tier convenience andofferings!Convenience may be more critical than reputation25
Online CompetitorsChime A free transaction account. You get a debit card and an app. It includes an innovative NSFsolution. They ignore a bad ChexSystemreport. It is not called a checking account.American Express Bank Online savings rate of 1.60% 18 Month CD at 1.50% (April 15). Possibly the best online accountopening experience. It still feels like an old-money bank. Do you still think they are just a cardcompany?26
The Good News Incomes and savings rates are up,highest since 2013 and well abovepre-crisis levels. You have access tomore liquidity. Non-maturity savings are likely togrow as long as we have economicuncertainty. Majority of consumers who useelectronic banking still prefer to openan account in person. Large bank market share growth is notuniversal. Fintech startups are at an all time high. Many of these firms want to partnerwith you in order to compete withlarge bank market share. 2018 survey of electronic banking trends.27
Our Sample Bank – Wholesale Options We are at 90% loans todeposits. MMDA rates are near topof market. We increased brokeredCDs in the past year. We have been usingFHLB overnight for cashneeds.Deposit MixDDANOWSavingsMMDATime - RetailTime - BrokeredTotal Deposits Balance99.00115.50132.00165.00115.5033.00660.00% 0%Current Current 00%1.85%1.30%2.01%1.60%0.72%0.60%28
Traditional Wholesale Strategies They are used as liquidity sources, not funding sources. You may even designate specified values in a liquidity action plan. (Bottledwater) You don’t consider the marginal cost and IRR implications of bottled watersources. You just look at the volumes. We avoid using available FHLB capacity in order to keep our powder dry. Other than brokered or rate board CDs, we keep the balances short term.29
Sample Bank – Wholesale Funding Plan Avoid paying rate board CD rates(no loyalty). Reprice standard CD rates at themedian of the market. Plan CD specials priced to maintainbudgeted growth rate for sector.Price at marginal cost under FHLBadvance rates. If CD pricing is not working, replacefunding with duration matchedadvances. Use best short-term funding optionas part of the liquidity action plan. Segment MMDA balances to reducecurrent funding costs. Price MMDA accounts to achievesector growth budget. You are willing to pay more forMMDA growth because of effectiveduration, especially in this rateenvironment.30
The Cost of Paying Up?Marginal Cost AnalysisSummaryBalanceName: Top of Market SpecialDate: 7/31/2019Rate Env (bp):0ExpenseCostBnchMkStrategy 19,900790.800%2.300%1.500%Strategy 150%Marginal CostStrategy 1CurrentAccountsTermCurrentRateNotes:Maturities Decay %0.800%11,0000.0%NewRateStrategy 2Continue to lose 10% of balancesBetaSpreadRetention %0.800%Notes:Retention ExpenseNewRate9,900791.169%Price special at top of marketBetaRetention %Retention Expense11,50013412 Mo CD - 00312 Mo CD - .0%1,6001012 Mo CD - 0.0%6,4005813 Mo Special - 25K130.000%1.000.0%02.000%4.00100.0%7001413 Mo Special - 150K130.000%1.000.0%02.500%5.00100.0%2,00050The real cost of pricing a CD special at top of market. Balance growth of 5% that includescannibalizing 1/5th of existing balances results in actual cost of 3.45%.31
Segmentation How can we grow balances without paying up on “old” balances? How do we compete with other institutions paying more than theFHLB advance curve for funding? How long do you wait to assess success of a strategy or product? What about “fairness”?32
Fairness Issues - Consumer Institutions struggle with the concept and execution of offering different rates forwhat seem to be the same product. Is this fair? Won’t we get complaints? How do we actually pull this off? Virtually every institution offers rate discounts for: Volume discount (balance tiers, fees waived on minimum)Relationships (discount on loan with direct deposit)Credit mitigation (discount on loan with auto pay, better rate for higher FICO)Short term promotion (limited time offer, short term CD special)Channel (discount on on-line only product, special at the new location) In other words, we use segmentation to determine which characteristics aremore important to the consumer – just like every other consumer industry.33
Solutions Fairness is a bigger problem if I have not segmented, or do not have products withdifferent characteristics. Do not assume that all consumers have the same preferences for all characteristics (rate, fees,minimums, locations, features like paper statements or no fee ATMs). A retailer rarely offers a special without forcing consumer to take an action advantageous toboth. If a retailer has a “flat fee” mentality, it is part of a marketing campaign. Does your product line have choices for a consumer who perceives an unfair oruncompetitive rate? We do have a better rate for you. You simply need to choose this Yes, there are better rates out there, but they don’t come with , or they require to you DO NOT assume that all consumers will elect to spend the effort to switch, even if theyknow about the choices! Let the consumer select the product, not the CSR.34
Funding PlanFunding GoalProjected FundingCurrent balanceOrganic growthNew growthNet AccountsNew Accounts Goal (annual)*Net Accounts GoalOrganic growthNew growthTotalsAssetsLoansLoan Growth %Net Loan GrowthCurr Loan/Deposit RatioTarget Loan/Deposit RatioAnn Funding Goal (maintain L/D ratio)Ann Funding Goal (target ratio)Deposits 44,258 37,816 6,442 -- needed to meet goal1Breakout retail balances by sector.Cons MMDA Bus MMDA Inst CDST CDLT CDCons Savings Bus Savings PF Savings Cons Checking Bus Checking PF Checking 128,552 39,650 0 46,973 45,957 87,552 0 0 176,829 298,144 4,3746,5521,85566941,58235524,7237,5692,1008 2,571 0 2,571 1,983 0 1,983 0 0 0 3,758 0 3,758 1,105,643 796,225Make a loan growth25%assumption. 39,81190%88% 44,258 64,875 885,166 (net of borrowings) 1,379 0 1,379 4,378 0 4,378 0 0 0 0 0 03 8,841 0 8,841 14,907 0 14,907 0 0 0Project growth innumber of accounts.35
Funding Plan – The Whole Balance Sheet The concept of effective duration can be extended to the entirebalance sheet produced by an EVE/NEV report. Once the report is produced it can be used to identify potentialstrategies aimed at managing interest rate risk. Forecast EVE reports can be used to measure the effectiveness ofthese strategies.36
Funding Plan – The Whole Balance Sheet Here is a typical EVE summary. Effective duration comes from the relative price (value) difference whenwe shock our institution with rate scenarios.EVE ReportAssetsInvestmentsR/E LoansCommercialConsumerNon-EarningTotal AssetsLiab & EquityNIB DDAIB DDASavings & MMCDsBorrowingsNIB LiabTotal LiabEquityTotal Liab & EquityBook-100bpFlat 100 bp 200bp 300 bp 60,16418,225767176,40521,947198,35237
Funding Plan – The Whole Balance Sheet Concept: Based on core study information, and EVE/NEV report, allocate the sources based on“duration” of cash flows, like you would an investment “ladder”.Duration Map ( 200)AssetsInvestmentsR/E LoansCommercialConsumerNon-EarningTotal AssetsLiab & EquityNIB DDAIB DDASavings & MMCDsBorrowingsNIB LiabTotal LiabEquityTotal Liab & EquityMismatchCum 21,10738
Polling SlideDo you have a 2020 funding plan that more than just projecting adeposit growth and average cost of funds? Yes, we project balances at the major deposit sector level. Yes, we project costs at the major deposit level. Yes, we use an IRR approach to plan funding to match earning assets. No, we use a simple budget.39
Measuring SuccessIs my strategy working? What is my market share trend?Are average balances growing?What share of customer balances do we have?Are active accounts growing?Are my assumptions correct? Back test your core assumptions Track the response to promotions and balancemigration.40
Measuring Success – What Are We Opening? This looks at number of newaccounts per month, notbalances. What accounts do you wantto open? Accounts take some period to“fund” or reach a typicalbalance. Specific promotions, lobbystrategies, consumerpreferences, staff turnover,competitor positioning all willaffect these numbers andtrends.41
Measuring Success – Active Accounts Active accounts – thenumber of accounts in asector that are aboveeither a dormantthreshold (e.g. 50savings), or have incomegenerating activity (e.g.more than 10transactions/month). The active accountgrowth rate is the netgrowth in this number. It is affected by newaccount originations,closed accounts andaccounts going inactive.42
Measuring Success – Recent Decay The core study predictedabout 16% annual decayin MMDA accounts in thisrate environment. This institution’s actualexperience was lower.Why? In this case it was due tothe behavior of a smallnumber of largedepositors.43
How Do We Nurture Education and training Retail errors can sabotage a well thought out plan. Scenarios, what happens when someone walks in and. Consumer empathy and fairness Sorry, we don’t carry that model vs. I think we have something that meets yourneeds. Pricing strategies Avoid a wild west mentality on rates and terms. Pricing rules, generic and specific, can help here.44
Thank YouProgram Resource -series-2020/abrigo.com45
2020 FHLB Des Moines Regional Member Meetings Session 1: Managing Your Balance Sheet in Times of Crisis Session 2: Creating Your Ideal Funding Plan Structure Session 3: Navigating a Flattening Yield Curve During Record Low Rates Session 4: Asset and Funding Strategies 4