Transcription
TYPEOriginal Research24 August 202210.3389/fnins.2022.901337PUBLISHEDDOIOPEN ACCESSEDITED BYShelley Fried,Massachusetts General Hospitaland Harvard Medical School,United StatesREVIEWED BYBiju B. Thomas,University of Southern California,United StatesMohit Naresh Shivdasani,University of New South Wales,Australia*CORRESPONDENCEIone Fineionefine@uw.eduSPECIALTY SECTIONThis article was submitted toNeuroprosthetics,a section of the journalFrontiers in NeuroscienceRECEIVED 21March 2022July 2022PUBLISHED 24 August 2022ACCEPTED 11CITATIONYücel EI, Sadeghi R, Kartha A,Montezuma SR, Dagnelie G, Rokem A,Boynton GM, Fine I and Beyeler M(2022) Factors affecting two-pointdiscrimination in Argus II patients.Front. Neurosci. 16:901337.doi: 10.3389/fnins.2022.901337COPYRIGHT 2022 Yücel, Sadeghi, Kartha,Montezuma, Dagnelie, Rokem,Boynton, Fine and Beyeler. This is anopen-access article distributed underthe terms of the Creative CommonsAttribution License (CC BY). The use,distribution or reproduction in otherforums is permitted, provided theoriginal author(s) and the copyrightowner(s) are credited and that theoriginal publication in this journal iscited, in accordance with acceptedacademic practice. No use, distributionor reproduction is permitted whichdoes not comply with these terms.Factors affecting two-pointdiscrimination in Argus IIpatientsEzgi I. Yücel1 , Roksana Sadeghi2 , Arathy Kartha3 ,Sandra Rocio Montezuma4 , Gislin Dagnelie3 , Ariel Rokem1,5 ,Geoffrey M. Boynton1 , Ione Fine1* and Michael Beyeler6,71Department of Psychology, University of Washington, Seattle, WA, United States, 2 Departmentof Biomedical Engineering, Johns Hopkins School of Medicine, Baltimore, MD, United States,3Department of Ophthalmology, Johns Hopkins School of Medicine, Baltimore, MD, United States,4Department of Ophthalmology and Visual Neurosciences, University of Minnesota, Minneapolis,MN, United States, 5 eScience Institute, University of Washington, Seattle, WA, United States,6Department of Computer Science, University of California, Santa Barbara, Santa Barbara, CA,United States, 7 Department of Psychological and Brain Sciences, University of California,Santa Barbara, Santa Barbara, CA, United StatesTwo of the main obstacles to the development of epiretinal prosthesistechnology are electrodes that require current amplitudes above safety limitsto reliably elicit percepts, and a failure to consistently elicit pattern vision.Here, we explored the causes of high current amplitude thresholds and poorspatial resolution within the Argus II epiretinal implant. We measured currentamplitude thresholds and two-point discrimination (the ability to determinewhether one or two electrodes had been stimulated) in 3 blind participantsimplanted with Argus II devices. Our data and simulations show that axonalstimulation, lift and retinal damage all play a role in reducing performance inthe Argus 2, by either limiting sensitivity and/or reducing spatial resolution.Understanding the relative role of these various factors will be critical fordeveloping and surgically implanting devices that can successfully subservepattern vision.KEYWORDSsight restoration, retinal prosthesis, retina, current spread, modeling, psychophysicsIntroductionDiseases such as Retinitis Pigmentosa (RP) and Age-Related Macular Degeneration(AMD) cause photoreceptor degeneration that results in severe loss of vision at laterstages (Pfeiffer et al., 2020). RP affects approximately 1/4,000 (Ayuso and Millan,2010) and late AMD affects 1/300 adults globally (Wong et al., 2014). While some ofthese diseases have treatments that slow progression (Mitchell et al., 2018), none arecurable. Once the disease has progressed to severe vision loss, one of the few potentialtreatments is implantation with a retinal or cortical prosthesis. Based on a principlesimilar to cochlear implants, retinal implants use an array of electrodes to stimulateFrontiers in Neuroscience01frontiersin.org
Yücel et al.10.3389/fnins.2022.901337damage, with the goal of examining how these various factorsaffect both sensitivity and two-point discrimination.Our modeling section has three stages:remaining (non-photoreceptor) neurons in the retina to evokephosphenes. The Argus II (Second Sight Medical Products, Inc.)is one of two FDA-approved devices, with the other being asuprachoroidal device (Ayton et al., 2014). Currently, there aremore than 350 individuals worldwide using Argus II devices(Ayton et al., 2020a). Although the production and implantationof the Argus II ended in 2019, there is ongoing research todevelop other epiretinal devices (Ferlauto et al., 2018; NanoRetina, 2020).The perceptual experience of clinically implanted ArgusII patients has been variable (Erickson-Davis and Korzybska,2021). In many patients a significant proportion of electrodescannot elicit percepts within safe current density limits (Ahujaet al., 2013), and only limited pattern vision is generated by thedevice (Stronks and Dagnelie, 2014; da Cruz et al., 2016; Arevaloet al., 2021).A variety of factors are likely responsible for the limitedpattern vision found in Argus II devices (Caspi and Zivotofsky,2015). These include the decoupling of retinotopic stimulationfrom eye-position (Caspi et al., 2017), the fact that the perceptsproduced by the electrodes are not well formed “pixels”(Nanduri et al., 2012; Luo et al., 2016; Beyeler et al., 2019), andan inability to resolve individual electrodes.Two-point discrimination (the ability to determine whetherone or two percepts are seen when a pair of electrodes arestimulated) is thought to be a particularly useful measure forcharacterizing the ability to resolve individual electrodes withinan array (Ayton et al., 2020b). Unlike other spatial acuity tasks,such as grating acuity or square localization, two-point acuityis not susceptible to blurring by eye-movements. Thus, twopoint discrimination is useful for characterizing losses in spatialresolution at a retinal level. An ability to resolve whether oneor two electrodes have been stimulated is necessary but notsufficient for good visual performance with a prosthetic device;however, one previous study does suggests a correlation betweentwo-point discrimination and grating spatial acuity in Argus IIpatients (Lauritzen et al., 2011).Here we measured both current amplitude thresholds andtwo-point discrimination performance in three participantsdiagnosed with severe retinitis pigmentosa and chronicallyimplanted with the Argus II epiretinal prosthesis (Table 1).Electrical stimulation was delivered directly to single or preselected pairs of electrodes (Figure 1). We measured singleelectrode thresholds using a yes-no procedure, and measuredtwo-point discrimination thresholds by stimulating a pair ofelectrodes and asking participants both to report the number ofphosphenes and draw the phosphene shape(s) on a tablet touchscreen.Having measured current amplitude and two-pointdiscrimination thresholds, we used a combination of regressionanalyses and simulations to examine the role of physical distancebetween electrodes, current amplitude, axonal stimulation,height of the electrode above the retinal surface (lift), and retinalFrontiers in NeuroscienceStage I: Estimating electrode-electrode distance to and alongaxonal bundlesWe began by using the pulse2percept model (Beyeleret al., 2019) to estimate the position of the array onthe retinal surface, the distance between electrodes,and the distance to a shared axonal bundle for eachpair of electrodes. These estimates were then used aspredictive factors in our regression models (Stage II).Stage II: Regression modeling: The effects of physical andaxonal distance on two-point discriminationthresholdsNext, we fit nested linear logistic models to determinewhich factors—physical distance between electrodes,mean current amplitude of the two electrodes, anddistance to axon (as estimated in Stage I), bestpredicted our psychophysical data.Stage III: Current spread modeling: The effects of retinaldamage and electrode lift on thresholds and twopoint discrimination thresholdsFinally, we used a simple version of a “scoreboard”model to estimate the relative contributions ofelectrode lift from the retinal surface and retinaldamage on both current amplitude thresholdsand two-point discrimination performance. Thescoreboard model assumes that each electrodegenerates a unitary, circular percept in the region ofvisual space that corresponds to the retinal positionof that electrode, as would be predicted if electricalstimulation only elicited firing in ganglion cell bodiesclose to the electrode (Fine and Boynton, 2015).PsychophysicsMethodsParticipantsOur initial participant pool consisted of nine participantswith Argus II retinal prostheses (Second Sight Medical Products,Inc.): six participants implanted and tested at the Retina Serviceat the University of Minnesota, and three tested at the LionsVision Research and Rehabilitation Center at Johns HopkinsUniversity; one of these patients was implanted at Wills EyeHospital in Philadelphia, the other two at the Johns HopkinsWilmer Eye Institute.Unfortunately, five of the six University of Minnesotaparticipants almost never reported seeing two percepts whenstimulated with a pair of electrodes, and the one participant02frontiersin.org
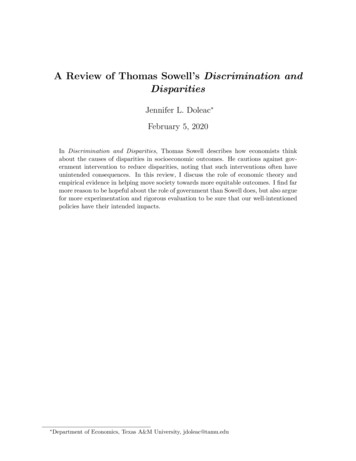
Yücel et al.10.3389/fnins.2022.901337TABLE 1 Patient demographics.Participant IDSecond sight participant IDImplantEyeAge at testingDate of implantationDate of testingS112-005Argus IIRight Eye8320092019S212-104Argus IIRight Eye6120152019S313-101Argus IIRight Eye7420142019All data reported in this paper were collected at Johns Hopkins University Wilmer Eye Institute.FIGURE 1(A) Experimental setup. (B) Example pulse trains for an individual trial (not to scale) of the two-point discrimination paradigm. In all experimentswe used square-wave, biphasic, cathodic-first pulse trains with a fixed pulse train duration.who did report seeing two percepts on a reasonable proportionof trials (7/49 in session 1; 35/90 in session 2) also reportedseeing two percepts on 6/7 (no stimulation) catch trials.Consequently, we excluded the Minnesota participant data fromfurther analysis.Of the patients tested at Johns Hopkins, S1 was implantedas part of the Argus II Feasibility Study (clinicaltrials.gov trialNCT00407602), whereas S2 and S3 were implanted after ArgusII became commercially available in 2013, see Table 1. Thedata described in this paper (Johns Hopkins participants) werecollected in two sessions, with each session taking roughly 3 h,including frequent breaks.Frontiers in NeuroscienceData were collected at the Retina Service at the Universityof Minnesota and the Lions Vision Research and RehabilitationCenter at Johns Hopkins University, and were provided toUW researchers in a de-identified format. The study wasapproved by IRBs of the University of Washington and JohnsHopkins University.StimuliThe Argus II retinal prosthesis consists of an epiretinalelectrode array implanted in the macular region of the retina,an ASIC chip, RF transmitter and receiver coil, as well asglasses containing a mini camera (not used in our experiment)03frontiersin.org
Yücel et al.10.3389/fnins.2022.901337tested within a single run. Each trial started with an audioprompt. Then one of the six selected electrodes (selectedpseudorandomly) was stimulated at either 20 or 6 Hz, with apulse train duration of either 250 or 500 ms (depending on whatthe participants used in their daily life, see Table 2), squarewave pulse width of 0.46 ms, and interphase gap of 0 or 1 ms.The amplitude of stimulation was adapted through a staircaseprocedure. The participant was asked to report whether or notthey had seen a phosphene on that trial using a game controllerand feedback was given on each trial. Each run consisted of amaximum of 60 trials per electrode (5 blocks of 12 trials), fora maximum of 360 trials, and 4 catch trials per block (SecondSight Medical Products Inc, 2013). Each run was followed by abrief rest, which ended based on participant feedback.Perceptual thresholds for detection at a given electrode werecalculated by pooling data across all trials. The probability ofreporting a percept as a function of stimulus intensity wasfit with a psychometric function using maximum likelihoodestimation, and the current amplitude detection threshold wasdefined as the stimulus amplitude at which the participantreported a percept 50% of the time (Watson and Robson, 1981;Wichmann and Hill, 2001; Ahuja et al., 2013).and a video processing unit (VPU), see Ahuja et al. (2011),for more detail. The signal from the VPU is received bythe internal receiver coil, and the ASIC chip generates theelectrical pulses that are then sent to the electrode array, agrid of 6 10 platinum disk electrodes in a rectangular gridarrangement with 225 µm diameter and 575 µm center-tocenter separation.We stimulated electrodes directly by connecting the VPU ofeach participant’s device to a psychophysical testing computerprovided by Second Sight Medical Products, Inc., see Figure 1A.Electrode stimulation was controlled by in-house softwareprogrammed in MATLAB by Second Sight Medical Products,Inc. (Mathworks, MATLAB Version: 7.1, R14SP3), that sentcurrent waveforms directly to the electrodes (by-passing thecamera). Stimuli consisted of biphasic, cathodic-first, chargebalanced, square-wave pulse trains with frequency, interphasegap, interpulse delay (the offset between pulses on differentelectrodes) and pulse train duration parameters as shown inFigure 1B and Table 2. Stimulation current amplitudes werekept below a charge density limit of 1 mC/cm2 /phase.Identifying electrodes with lower perceptualthresholdsA proprietary fast threshold estimation procedure, SwiftPA(Second Sight Medical Products Inc, 2013) was used todetermine which electrodes had electrical thresholds belowthe safety limit. Stimulation consisted of 0.46 ms, cathodicfirst pulse trains of 1 s duration. Starting from the top leftelectrode, a yes-no procedure was used to determine whetherstimulation produced a detectable phosphene. If participantsfailed to detect a phosphene the amplitude of the electricalstimulation was increased. If participants reported a phosphenethe amplitude was held constant. After 3 consecutive correctdetections, testing moved to the next electrode. We limitedfurther testing to a subset of the electrodes which produced3 consecutive correct detections at a current amplitude belowthe safety limit (10 electrodes in S1, 7 electrodes in S2, and 10electrodes in S3). These electrodes were selected to have lowthresholds, and to be spread as widely apart as possible onthe array.Two-point discrimination measurementsFor each participant, we selected electrodes with thelowest detection thresholds and paired them in all possiblecombinations. Stimulation was carried out at an amplitude twicethe detection threshold, or at a maximum of 660 µA (the chargedensity limit of 1 mC/cm2 /phase for a 0.46 ms pulse). On eachtrial, we asked “how many shapes did you see” and asked themto draw the phosphene shape(s) on a tablet touch screen.Parameters used for each participant are shown in Table 2.The pulse width was always 0.46 ms, with an interphasegap of 1 ms for S2 and 3, and no interphase gap for S1,based on the stimulation parameters each individual wasaccustomed to through daily use. Stimulation was interleaved,with either a 25 ms (20 Hz) or 83 ms (6 Hz) interpulse delaybetween the beginning of each pulse on one electrode and thebeginning of the corresponding pulse on the second electrode,Figure 1B.In each experimental run, every possible pair of electrodeswas tested 3 times. On each trial, participants verbally reportedthe number of shapes they were seeing, gave a qualitativedescription (e.g., “the one on the bottom is smaller,” “left oneis twice as big as right one—they are side by side”) and tracedthe perceived phosphene shape(s) on a tablet (drawing datanot reported here). Although the “correct” answer was alwaystwo percepts, participants were never given feedback as to howmany electrodes had been stimulated. Importantly, the numberof shapes drawn by the participant was almost always consistentwith the number of shapes they verbally reported, suggestingthat they were not reporting whether they saw one or two shapeson the basis of the overall brightness or size of the percept.Current amplitude detection thresholdmeasurementsWe then used proprietary software (Argus II-HybridThreshold) provided by Second Medical Products Inc. tocarry out an adaptive, single interval yes-no procedure tomeasure detection thresholds (50% detection performance)within electrodes pre-selected by the SwiftPA procedure,methodological details are explained more fully in Ahuja et al.(2013).To avoid adaptation effects (Horsager et al., 2009; PérezFornos et al., 2012) we interleaved threshold measurementsacross electrodes within each run. Up to six electrodes wereFrontiers in Neuroscience04frontiersin.org
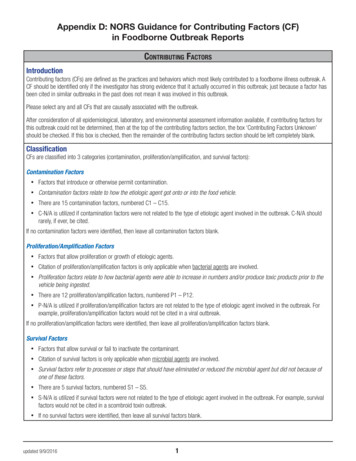
Yücel et al.10.3389/fnins.2022.901337TABLE 2 Stimulation protocol and parameters for all experiments.Patient ID1st Session2st SessionExperimentFrequency (Hz)Interphase gap (ms)Interpulse delay (ms)Duration (ms)S1Perceptual Threshold200N/A250S2Perceptual Threshold61N/A250S3Perceptual Threshold61N/A250S1Two-point Discrimination20025250S2Two-point Discrimination20025250S2Two-point Discrimination6083500S3Two-point Discrimination6183500S3Two-point Discrimination6183500S1Perceptual Threshold200N/A250S2Perceptual Threshold61N/A500S3Perceptual Threshold61N/A500S1Two-point Discrimination6183500S2Two-point Discrimination6183500S3Two-point Discrimination6183500TABLE 3 Current amplitude detection thresholds (50% detection performance) and reports of daily usage.Medianthreshold aximumthreshold(µA)Daily useS1274218–3311534843–4 days a week, 3–5 h a day, for an average of 20 h a weekS2476355–621217645Approximately once a monthS3210177–28089323Used the device almost every day outdoors, for a limitedamount of time, averaging about 2 h a day.We included 25% of catch trials, randomly interspersed, inwhich neither of the electrodes was stimulated. We deliberatelyused no stimulation as compared to single electrode stimulationduring catch trials, because we were concerned that differencesin brightness or size might allow participants to differentiatebetween single and paired stimulation in the absence of genuinepattern vision (see section “Discussion”).The order of the trials was pseudorandomized. We askedparticipants to avoid head and eye movements to maximizestability of the perceived phosphene locations, but to maximizeparticipant comfort we did not use a chin rest.ResultsCurrent amplitude detection thresholdsTable 3 shows 50% current amplitude detection thresholdsand self-reported daily usage for all three participants, andFigure 2 shows a histogram of current amplitude thresholds forall participants.FIGURE 2Histogram of current amplitude detection thresholds (50%detection performance).Two-point discrimination thresholdswhat they saw. Table 4 shows the reported number of perceptsand the probabilities of each verbal response.Trials where participants did not report seeing a perceptwere discarded (0–4%). The few trials where participantsIn the paired electrode stimulation experiment, we askedthe question “How many shapes did you see?” Participants couldpotentially report any value, and they were then asked to drawFrontiers in Neuroscience05frontiersin.org
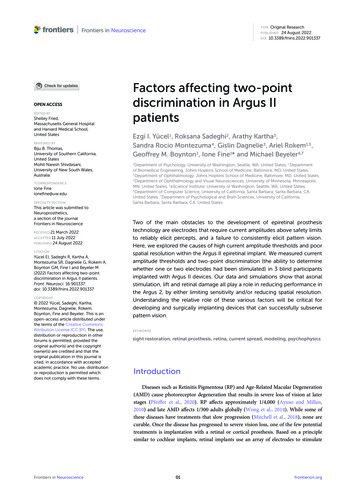
Yücel et al.10.3389/fnins.2022.901337Relationship with device useTABLE 4 Reported number of percepts and their frequency andprobability in the two-point discrimination experiment.Reported numberof perceptsS1S2S3FrequencyProbabilityP(“X” .00In a separate questionnaire, participants were asked howoften they used their device. Participants varied widely indevice use, see Table 3. S1, who had a median amplitudethreshold of 274 µA and saw 2 percepts 69% of the timewith paired stimulation, used the device most consistently,reporting using the device 3–4 days a week, 3–5 h a day,for an average of 20 h a week. S3, who had a medianamplitude threshold of 210 µA and saw 2 percepts 64%of the time with paired stimulation, used the device almostevery day when outdoors, but for a limited amount of time,averaging about 2 h a day. S2, who had a median amplitudethreshold of 476 µA and saw 2 percepts only 37% of thetime with paired stimulation, reported using the device once amonth.Modelingreported 3 percepts (0–6%) or more percepts were collapsedwith trials where participants reported 2 percepts for theremainder of the analyses.Given that we always used paired electrode stimulation,we were concerned that participants might shift their criterionfor reporting two percepts over the course of the experiment.However, there was little evidence that the probabilityof participants reporting two (or more) percepts changedsubstantially either within or across sessions (although it shouldbe noted that electrode pairs varied between sessions, Table 5,which may have masked some experience driven effects). For S3there was a significant increase in the probability of reportingtwo percepts between the first and second 1/2 of trials in session2. The reason for this is not clear, but might possibly bedue to an improved ability to recognize two percepts withexperience. Since there was little effect of time on our twopoint discrimination data we did not use time as a factorin our further analyses. The number of shapes participantsdrew consistently matched their verbal report, throughout everysession.The probability of reporting 1 or 2 (or more) percepts duringcatch trials (with no stimulation) also remained reliably lowthroughout the experiment (S1:0/15 trials, S2:2/12 trials, S3: 0/16trials).Pulse2percept analyses and current amplitude thresholdestimates were carried out in Python using pulse2percept(Beyeler et al., 2017) and in-house code. The remaining analyseswere carried out in MATLAB (Mathworks, MATLAB Version:9.10.0, R2021a) using in-house code. All in-house code can befound at https://github.com/VisCog/Argus current spread.Stage I: Estimating electrode-electrodedistance to and along axonal bundlesAs an initial step we estimated distance to and along axonalbundles for each pair of electrodes.Both electrophysiological (Fried et al., 2009) andpsychophysical data (Beyeler et al., 2019) suggest that axonalstimulation may contribute significantly to the poor resolutionof retinal prostheses. Axonal stimulation is a particular concernfor epiretinal prostheses, such as the Argus II which areplaced on the nerve fiber layer, adjacent to the axon fiberbundles of retinal ganglion cells. Depending on stimulusconditions, participants implanted with the Argus II describethe phosphenes generated by single electrodes as elongated,due to activation of passing axon fibers, resulting in perceptualdistortions (individual electrodes producing “streaks” instead ofpunctate spots) that vary in their length and orientation acrossthe retinal surface in a way that can be predicted based on theknown axon fiber trajectories (Nanduri et al., 2012; Beyeleret al., 2019).It is not yet entirely clear how sensitivity to electricalstimulation falls off as a function of distance from theinitial segment (Fried et al., 2009), with psychophysicallyestimated decay constants ranging widely from 500–1,420 µmOptical coherence tomography dataUnfortunately, it was impossible to collect useable opticalcoherence tomography (OCT) images for the region of theretina including the array in S2 and S3. OCT data from S1,2 years after implantation (2011), are shown in Figure 3. In thispatient the array appears to be flush to the retinal surface, butthere is some thickening (evidence of potential damage) of theretina underneath the array.Frontiers in Neuroscience06frontiersin.org
Yücel et al.10.3389/fnins.2022.901337TABLE 5 Probability of reporting two percepts, within and across sessions.ParticipantS1S2S3Session1st half of trials in session2nd half of trials in sessionUnique electrodes testedSession 10.73 [0.48,0.89]0.93 [0.7, 0.99]Session 20.68 [0.57, 0.77]0.50 [0.4, 0.62]A4, A8, D1, E10, F2A2, A4, A8, B3, B6, D1, D8, E10, E3, F2, F7Session 10.33 [0.12, 0.65]0.56 [0.27, 0.81]B6, B9, F7, F9Session 20.39 [0.2, 0.61]0.44 [0.25, 0.66]A10, B10, B5, B6, B9, F7, F9Session 10.71 [0.25, 0.66]0.59 [0.41, 0.74]A8, B10, B4, C6, C8, C9, D6, E9, F10Session 20.35 [0.19, 0.55]0.91 [0.72, 0.97]A6, A8, B10, B9, D6, F10Values in the bracket are 95% confidence intervals calculated by Wilson method.FIGURE 3OCT data from participant S1. (A) Schematic showing the estimated location of OCT b-scans overlaid on the array (alignment was carried outusing the registered OCT fundus image). The array schematic is flipped along the y-axis to reflect visual space coordinates, such that the top ofthe schematic represents the superior visual field and the inferior retina. (B) The metal electrodes block light from the scanning light source,casting shadows on the retinal image.(Beyeler et al., 2019). Nonetheless, if axonal stimulation plays asignificant role in reducing resolution, then distance, both to andalong a shared axon bundle should predict how many distinctpercepts are seen when two electrodes are stimulated.were then used to estimate the array center with respect to thefovea, the array rotation with respect to the horizontal raphe,and the retinal distance between the fovea and the optic nervehead for each participant. In the human retina, the extendedraphe is typically located 15 2 inferiorly to a horizontalline at the latitude of the fovea through the center of the opticdisk. We approximated this by fitting a parabola centered on theoptic nerve and approximating the horizontal raphe as parallelto the axis of symmetry on the abscissa (Jansonius and Schiefer,2020).The spatial layout of axonal pathways was calculated usingpulse2percept software (Beyeler et al., 2017), that simulatesMethodsTo provide a measure of the distance to and along axonbundles we used an existing computational model developed byBeyeler et al. (2019). This model begins by using ophthalmicfundus photographs in which an eye care provider marked theoptic nerve, fovea, and the center of the implant on the fundus,using photos taken pre- and post-surgery. These landmarksFrontiers in Neuroscience07frontiersin.org
Yücel et al.10.3389/fnins.2022.901337FIGURE 4Estimated position of the electrode array on the retinal surface for all three participants (see Beyeler et al., 2019 for estimation methods) overlaidon estimates of the axon fiber pathways for that participant. Note that all panels are in visual space coordinates, with the upper visual field at thetop of the figure.3. Distance along axon was defined as the distance betweenan electrode and the point on its axon that is closest to theaxon of the other electrode.pathways using a model (Jansonius et al., 2009) that assumesthat the trajectories of the optic nerve fibers can be described ina modified polar coordinate system (r,φ) with its origin locatedin the center of the optic disk. Each nerve fiber is modeled asa spiral defined by the angular position of the trajectory at itsstarting point at a circle around the center of the optic disk, witha second parameter describing the curvature of the spiral, seeFigure 4.Given that the size of the Argus II electrodes islarge compared to the density of the underlying axonpathways, it was assumed that an electrode always sitson top of a ganglion axon fiber bundle. We simulated400 axonal bundles, which provided sufficient resolutionto ensure that there was an axonal bundle underneathevery electrode.We defined three inter-electrode distance values, Figure 5:ResultsThese three measures of distance on the retina werestrongly correlated with each other. The Pearson correlationcoefficient between physical distance and distance to axonwas r(337) 0.58, p 0.0001, between physical distance anddistance along axon was r(337) 0.84, p 0.0001, and betweendistance to axon and distance along axon was r(337) 0.28,p 0.0001.Intuitively, the reason for this is that (except when electrodesare on the opposite side of the Raphe) the shortest distanceto the axon (orange line in Figure 5B) tended to fall along aline that was close to orthogonal to the distance along the axon(purple line), since axonal bundle curvature (purple line) tendedto be relatively small. As a result, these three distances form theedges of an approximate right triangle, with the hypotenuse asthe Euclidean distance between two electrodes (green line) anddistance to and along the axon (with a slight curvature) formingthe other two sides. Because these three co-varying distancevariables essentially contain 2 degrees of freedom, we onlyincluded physical distance and distance to axon as predictivefactors in our modeling.1. Physical distance was defined as the Euclidean centerto-center distance between two electrodes on theretinal surface.2. Distance to axon (daxon12 ) was defined as the minimumdistance between two electrodes (e1 , e2 ) and the axonsclosest to them. This was calculated by:a. Selecting the axonal bundles a1 and a2 that fell beneatheach of the two electrodes.b. Determining the closest Euclidean distance from thecenter of each electrode to the fellow axon bundle: de1 a2 min d (e1 , a2 ) and de2 a1 min d (e2 , a1 )c. Choosing the minimum distance of the pair, daxon12 min de1 a2 , de2 a1 .(An alternative would have been to calculate the distanceto the axon bundle midway between the two electrodes,but this would have essentially resulted in the samevalues, halved).Frontiers in NeuroscienceStage II: Regression modeling: Theeffects of spatial and axonal distanceon two-point discrimination thresholdsNext, w
The Argus II (Second Sight Medical Products, Inc.) is one of two FDA-approved devices, with the other being a suprachoroidal device (Ayton et al.,2014). Currently, there are more than 350 individuals worldwide using Argus II devices (Ayton et al.,2020a). Although the production and implantation of the Argus II ended in 2019, there is ongoing .